


Abstract
We investigate the cosmic evolution of low-luminosity (L1.4 GHz < 1025 W Hz−1 sr−1) radio sources in the XMM Large Scale Structure Survey (XMM-LSS) field. We match low-frequency-selected (610-MHz) radio sources in the XMM-LSS field with near-infrared K-band observations over the same field from the UKIRT Infrared Deep Sky Survey. We use both the mean V/Vmax statistic and the radio luminosity function of these matched sources to quantify the evolution of the comoving space density of the low-luminosity radio sources in our sample. Our results indicate that the low-luminosity sources evolve differently from their high-luminosity counterparts out to a redshift of z∼ 0.8. The derived luminosity function is consistent with an increase in the comoving space density of low-luminosity sources by a factor of ∼1.5 at z= 0.8. We show that the use of the K–z diagram for the radio source population, although coarser than a full photometric redshift analysis, produces consistent results with previous studies using approximately >10 band photometry. This offers a promising method for conducting similar analyses over the whole sky with future near- and mid-infrared surveys.
1 INTRODUCTION
The strong cosmic evolution of the most-powerful radio sources was first deduced by Longair (1966) from low-frequency radio source counts. This evolution has since been confirmed by a number of investigations which imply that the comoving space density of high-luminosity radio sources has decreased by a factor of approximately 1000 between z∼ 2 and z∼ 0 (e.g. Laing, Riley & Longair 1983; Dunlop & Peacock 1990, Willott et al. 2001). Beyond z∼ 2 the evolution remains uncertain (e.g. Jarvis & Rawlings 2000; Jarvis et al. 2001b) but appears to undergo a gradual decline (e.g. Wall et al. 2005). The evolution of the low-power radio sources is less well constrained, but early studies of the radio source counts indicated that the low-luminosity sources could not be evolving as strongly as their high-luminosity counterparts (Longair 1966; Doroshkevich, Longair & Zeldovich 1970). Many models of the evolution of radio sources thus divide the radio source population into two independently evolving components, a strongly evolving high-luminosity component and a lower luminosity component with much weaker evolution (e.g. Jackson & Wall 1999; Willott et al. 2001).
Radio galaxies can be classified into two morphologically distinct groups identified as Fanaroff–Riley type I (FR I) and Fanaroff–Riley type II (FR II) sources (Fanaroff & Riley 1974). The FR I sources have higher surface brightness close to the centre of their radio lobes, whereas the FR II sources have highly collimated large-scale jets and bright emission hotspots at the edges of their radio lobes. The FR II sources are typically more luminous than the FR I sources with the division in luminosity falling at roughly L1.4 GHz = 1025 W Hz−1 sr−1. This dividing luminosity may be dependent on the optical luminosity of the host galaxy; a higher optical host luminosity results in a higher FR I/FR II division luminosity (Ledlow & Owen 1996). It has been suggested that the FR I and FR II sources might, respectively, be associated with the slowly and rapidly evolving components of the radio source population (Jackson & Wall 1999). However, Rigby, Snellen & Best (2007) find evidence that high-luminosity FR I sources evolve as rapidly as FR II sources of comparable radio power. Furthermore, Gendre, Best & Wall (2010) performed a detailed comparison of the radio luminosity function (LF) of FR I and FR II sources at a number of redshifts. This analysis revealed that both populations experience luminosity-dependent number density enhancements at higher redshifts, z≈ 0.8 ∼ 2.5, and that there were no significant differences between the enhancements measured for these two populations. These results would seem to suggest that both types of FR sources experience a common evolutionary history and thus cannot fully account for the observed dichotomy in cosmic evolution.
Recent evidence suggests that a more important division in the radio source population, distinct from the morphological classification, may be related to different modes of black hole accretion. Radio galaxies have also been classified according to the presence or absence of narrow high-excitation emission lines in the spectra of their optical host galaxies (Hine & Longair 1979; Laing et al. 1994; Jackson & Rawlings 1997; Willott et al. 2001). Objects without high-excitation emission lines are referred to as low-excitation radio galaxies (LERGs). Low-luminosity FR I galaxies are predominantly LERGs and most objects with high-excitation emission lines are associated with the more powerful FR II sources. However, the relationship between the FR class and the emission-line classification scheme is not one-to-one as many FR II galaxies have been found to be LERGs (e.g. Evans et al. 2006). It has been argued that these two groups correspond to different active galactic nucleus (AGN) phenomena powered by fundamentally different modes of accretion. The LERGs are powered by a radiatively inefficient accretion of the hot gas in the intergalactic medium, referred to as ‘radio’ mode accretion, while the high-excitation radio galaxies (HERGs) are powered by radiatively efficient accretion of cold gas, referred to as quasar mode accretion (Evans et al. 2006; Hardcastle, Evans & Croston 2006, 2007; Herbert et al. 2010). Smolčić et al. (2009) argue that the observed bimodal evolution of radio sources may be caused by differences in the evolution of these black hole accretion modes.
Understanding the relationships between different classes of radio galaxies, and their cosmic evolution, is important for understanding models of galaxy formation and evolution. Semianalytic models of hierarchical galaxy formation predict that galaxies in the local Universe should be more massive and have higher rates of star formation than is observed (Bower et al. 2006). There is increasing observational evidence that radio activity from AGNs may disrupt cooling flows in luminous early-type galaxies, thus slowing or preventing significant accretion of gas and further star formation (Fabian et al. 2003; Bîrzan et al. 2004; Rawlings & Jarvis 2004). This negative AGN feedback has been successfully incorporated into models of galaxy formation which are then able to better reproduce several features of the observed Universe, including the exponential cut-off in the bright end of the galaxy LF (Bower et al. 2006; Croton et al. 2006). Best et al. (2006) implied that the low-luminosity radio sources may be the predominant contributors to this negative feedback effect.
Current studies of the cosmic evolution of low-power radio sources seem to imply that these sources are not evolving at all or experiencing only mild negative evolution. Clewley & Jarvis (2004) found that the low-luminosity radio sources with L325 MHz < 1025 W Hz−1 sr−1 exhibit no evolution out to redshift z∼ 0.8. Waddington et al. (2001) also found no evidence of evolution in their study of 72 sources. Sadler et al. (2007) found evidence of mild evolution out to z∼ 0.7 in their comparison of the radio LF of sources in the 2dF-SDSS Luminous Red Galaxy and QSO survey with that of sources in the 6dF Galaxy Survey. This was consistent with pure luminosity evolution of the form (1 +z)2.0±0.3 which ruled out the no-evolution scenario at the 6σ level. Donoso, Best & Kauffmann (2009) also found evidence of mild positive evolution in the z = 0.1 ∼ 0.55 redshift range. Using radio sources in the VLA-COSMOS survey, Smolčić et al. (2009) found evidence that this mild evolution continues out to z∼ 1.3. All of these studies imply that the level of evolution in the low-power radio sources is significantly less than that taking place in the high-luminosity sources.
In this study, we use low-frequency radio sources detected in the XMM Large Scale Structure Survey (XMM-LSS) field to investigate the comoving space density of low-luminosity radio sources. The low-frequency selection is preferred over the high-frequency one (e.g. ≥1.4 GHz), as it provides an orientation-independent selection, as low-frequency surveys detect the optically-thin lobe emission, whereas high-frequency surveys contain a higher fraction of pole-on sources where the optically-thick core dominates (e.g. Jarvis & McLure 2002).
In Section 2 and 3, we discuss the radio and optical observations used in our analysis. Section 4 outlines the method we used to cross-match the radio sources with their optical counterparts. In Section 5, we describe the method used to obtain redshifts for our sample. In Sections 6 and 7, we discuss the V/Vmax statistic used to quantify the evolution of our sources. In Section 8, we determine the radio LF of the low-luminosity sources in our observed field and use it to investigate their evolution. We present our conclusions in Section 9.
We assume an H0 = 70 km s−1 Mpc−1, ΩM = 0.3 and ΩΛ = 0.7 cosmology throughout this paper.
2 RADIO DATA AT 610 MHZ
We use the radio observations of the XMM-LSS field described in detail in Tasse et al. (2007). These observations cover an area of 13 deg2 centred at α(J2000) =2h24m00s, δ(J2000) = . This field was observed for a total of 18 h with the Giant Metrewave Radio Telescope (GMRT) in 2004 August at a frequency of 610 MHz. The observations have a resolution of ∼6.7 arcsec and a 5σ rms sensitivity ranging from 1.5 to 2.5 mJy across the observed field. Tasse et al. (2007) detected 767 radio sources in this field and obtained estimates or upper limits for the spectral indices of these sources by comparison with the NRAO VLA Sky Survey (NVSS).
3 K-BAND DATA
We match the radio sources detected in the XMM-LSS field with K-band sources detected in the 7th data release (DR7) of the ongoing UKIRT Infrared Deep Sky Survey (UKIDSS) (Lawrence et al. 2007). The UKIDSS uses the Wide Field Camera mounted on the UK Infrared Telescope (UKIRT) (Casali et al. 2007). This survey, which began in 2005 May, comprises five complementary subsurveys of varying depths and sky coverage. Our study uses data from the Deep eXtragalactic Survey (DXS) which is a deep, wide survey over four observed fields. The survey is aiming to cover 35 deg2 to a planned 5σ depth of K∼ 20.8 (see e.g. Kim et al. 2010). We use the online catalogue of sources in the XMM-LSS field. The sky coverage of this field in the DR7 is illustrated in Fig. 1. The overlap in the DXS sky coverage and the radio observations is approximately 2.75 deg2. These data are complete down to K = 19.2 (Kim et al. 2010) and vary in depth across the observed field. Thus, to ensure completeness, we adopt a cut-off of K > 19.2 for the optical counterparts to our radio sources. K-band magnitudes in the UKIDSS are calibrated in the Vega system described by Hewett et al. (2006).
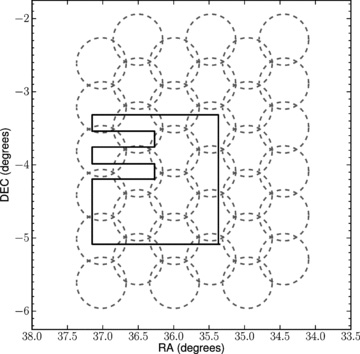
The location of the radio and IR data used in this paper. The light grey circles show the 610-MHz pointings of the GMRT. The thick black line indicates the UKIDSS DXS coverage of the XMM-LSS field in the DR 7.
4 RADIO AND INFRARED MATCHING
For the purposes of identifying near-infrared (near-IR) counterparts to the radio data, we divide the radio data into two categories. The first category comprises sources whose radio and optical emission are expected to be physically co-incident and includes all single-component radio sources as well as partially resolved multiple-component sources and double radio sources with clear radio cores. The second category contains sources where the optical emission is expected to be separated from the radio emission; this includes double radio sources with no detected radio core, radio jets and other complex multiple component structures.
To determine the optimal pairing radius for sources in the first category, we consider the accuracy of the radio and K-band source positions. The radio source positions in the catalogue we use are accurate to approximately 2 arcsec (Tasse et al. 2007) and the UKIRT survey provides accurate astrometry to within 0.1 arcsec (Lawrence et al. 2007). We thus adopt a pairing radius of 5 arcsec, corresponding to roughly 2.5σ, where σ is the combined error in the positions of the radio and K-band sources. This large radius ensures relatively few true optical counterparts will be located outside our search area. However, as the surface density of optical sources increases, there is an increasing probability that an optical counterpart may appear within our adopted search radius by chance. To determine the probability of a given optical counterpart being such a spurious alignment, we use the method of Downes et al. (1986). This method calculates the probability P that an optical source could lie at the given distance from the radio source by correcting the raw Poissonian probability for the number of ways such an apparently significant association could take place. We reject all matches whose corrected probability value P > 0.05. As a further consistency check, we plotted the contours of all the radio sources in the UKIDSS-DXS–XMM-LSS field over the optical images and inspected the data by eye.
Determining the optical counterparts of the more complex radio sources in our second category is much less suited to statistical methods. Thus, we determined the best match for sources in this category by means of visual inspection. We find matches brighter than K = 19.2 for 131 sources out of a total of 213 radio sources detected in the UKIDSS-DXS–XMM-LSS field.
5 ESTIMATING REDSHIFTS
We use a method of redshift estimation, developed by Cruz et al. (2007), which utilizes the tight correlation between K-band magnitude and redshift for radio galaxies. This K–z relation has been investigated for a number of radio galaxy samples including the 3CRR (Lilly & Longair 1984), 6CE (Eales et al. 1997), 6C* (Jarvis et al. 2001a) and 7CRS samples (Willott et al. 2003), and continues to at least z = 3 (Jarvis et al. 2001a).
The method developed in Cruz et al. (2007) uses a model of the distribution of radio galaxies as a function of redshift together with the linear K–z relation to generate a Monte Carlo simulation of radio sources which populate a synthetic K–z diagram. The advantage of this method over simply applying a linear fit to the K–z relation is that it incorporates information about the scatter in this relation and is thus able to provide a measure of the uncertainty in the output redshift estimates.
The Monte Carlo simulations assume Gaussian deviations about a mean K magnitude obtained from the K–z relation. A constant dispersion for these deviations is adopted for the entire redshift range. We use the dispersion σk obtained by Cruz et al. (2007) via a fit to the same data set as used to obtain the K–z relation. This dispersion was found to be σk = 0.593.

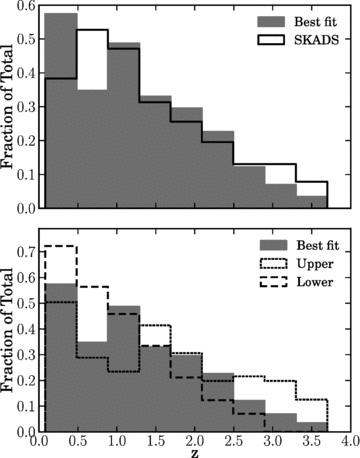
The distribution of the estimated redshifts of the matched radio sources in our sample. The top panel compares the best-fitting redshift estimates determined by our method to the theoretical redshift distribution in the SKADS simulations (Wilman et al. 2008) of a radio survey the same flux limits as that described in Section 2. The bottom panel compares the best-fitting distribution to the distributions which would occur if all the sources had redshifts corresponding to the upper and lower 68 per cent confidence intervals of their predicted redshift.
This method of redshift estimation does not adjust for the possibility that the optical host galaxy luminosity and radio luminosity may be correlated (e.g. Willott et al. 2003). This would most likely occur as a result of a correlation between both these properties and the mass of the central black hole. McLure et al. (2004) investigated the relationship between radio luminosity and black hole mass and concluded that these properties were only significantly correlated for the higher luminosity FR II and HERGs, and the effect is relatively small. As we are predominantly interested in investigating the evolution of low-luminosity sources in this analysis, we are confident that this will not have a significant effect on our conclusions.
Although using this method essentially precludes us from investigating any correlations between the galaxy mass and radio emission (e.g. Willott et al. 2003; McLure et al. 2004), it does allow us the possibility of just using single-band photometry to measure the evolution of radio sources and is therefore much less telescope intensive than multiband photometry. This is particularly true if one wants to constrain the brighter end of the LF and therefore driven to use larger survey areas.
6 V/Vmax
The evolution of the comoving space density of sources in a complete sample can be assessed using the non-parametric V/Vmax method (Rowan-Robinson 1968; Schmidt 1968). Here V is the volume enclosed by the object and Vmax is the volume enclosed by the object if it were located at the redshift zmax, where its measured flux drops below the limit of the survey. In order to determine zmax, it is necessary to take into account flux density limits of the radio survey and the limiting magnitude of the IR survey. If zmax determined by the radio data is larger than the redshift zopt which would cause the source to drop out of the IR survey, then zmax=zopt. We use our Monte Carlo simulations of the K–z diagram to predict zopt. We obtain a value of zopt = 2.5 as the mean z corresponding to our limiting K-band magnitude of 19.2.
If the objects in our sample are uniformly distributed in space, then V/Vmax will be uniformly distributed between 0 and 1 with a mean value of  , where N is the number of objects in the sample. A value of 〈V/Vmax〉 > 0.5 implies that the comoving space density of sources increases at higher redshifts, that is, negative evolution with cosmic time, whereas 〈V/Vmax〉 > 0.5 indicates a decline in the space density with increasing redshift.
The original 〈V/Vmax〉 test was formulated for a single sample complete above a given radio flux density and optical magnitude. However, the radio survey used in this analysis is inhomogeneous in depth (Tasse et al. 2007); thus, it is more appropriate to use the generalized Ve/Va test devised by Avni & Bahcall (1980) to analyse the evolutionary properties of this sample. The generalized test treats the incomplete radio data as a single sample with a variable survey area. This variable survey area depends on the flux density of the individual radio source. The new test variables are the enclosed volume Ve and the available volume Va; the statistical properties of the Ve/Va variable are identical to those of the V/Vmax variable in a single flux-limited sample (Avni & Bahcall 1980).
To determine the effective survey area as a function of the radio flux density, we perform a simple simulation. We inject 1000 radio sources with peak flux densities ranging from 1 to 4 mJy into the original map of the radio data. These simulated sources are restricted to the 2.75-deg2 area covered by the DXS. We determine the fraction of these simulated sources which are recovered by the source extraction algorithm SAD in the Astronomical Image Processing Software (aips) as a function of their input flux densities.
7 V/Vmax RESULTS
In Fig. 3, we compare the mean Ve/Va statistics obtained in our analysis with those found in Clewley & Jarvis (2004). We find that our results are in agreement with their analysis which is based on galaxies selected at 325 MHz in the Sloan Digital Sky Survey. Our results also compare very well with the V/Vmax results of Tasse et al. (2008). Their analysis is based on a combination of 325- and 610-MHz radio sources in the XMM-LSS field. The data used in their analysis overlap the DXS field studied in this paper, so it is encouraging that we obtain a similar result. The strong evolution of the high-luminosity radio sources detected by Clewley & Jarvis (2004) is also evident in our Fig. 3, although this result is at a lower statistical significance due to the small size of our sample; similarly, there is a little evidence that the low-power sources are evolving with cosmic time. The 610-MHz flux densities of our radio sources were converted to 1.4-GHz radio luminosities using the spectral index estimates obtained by Tasse et al. (2007) by comparision with the NVSS.
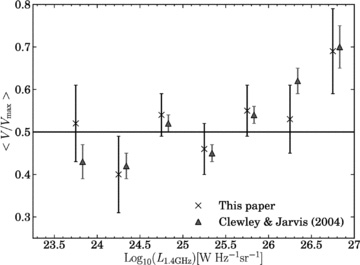
Average V/Vmax in seven different radio luminosity bins compared to the results obtained in Clewley & Jarvis (2004).
As discussed in Section 5, there is some uncertainty in the redshift estimates used in this analysis due to the inherent scatter in the K–z relation. To characterize the effect of this source of error on our Ve/Va estimates, we use Monte Carlo methods. In these Monte Carlo simulations, we assign each source a redshift estimate determined by the redshift probability density function derived from its K-band magnitude. We use these simulated redshifts to re-derive 〈Ve/Va〉 in the seven luminosity bins in Fig. 3. We repeat this process 1000 times to obtain the 68 per cent confidence interval of the Ve/Va estimates. This confidence interval is indicated in Table 1. The size of this source of error is comparable to the statistical errors due to the sample size.
Results of the 〈Ve/Va〉 analysis is seven luminosity bins. The column entitled 1σ (MC) quotes the uncertainty in our 〈V/Vmax〉 estimates due to the uncertainty in our redshift estimates. The last column gives the mean z of sources in each bin.
| L1.4 GHz (W Hz−1 sr−1) | 〈Ve/Va〉 | 1σ | 1σ (MC) | 〈z〉 |
| 23.5–24 | 0.52 | 0.09 | 0.07 | 0.26 |
| 24–24.5 | 0.40 | 0.09 | 0.06 | 0.47 |
| 24.5–25 | 0.55 | 0.05 | 0.04 | 0.91 |
| 25–25.5 | 0.46 | 0.06 | 0.04 | 1.2 |
| 25.5–26 | 0.55 | 0.06 | 0.05 | 1.7 |
| 26–26.5 | 0.53 | 0.08 | 0.06 | 1.7 |
| 26.5–27 | 0.69 | 0.10 | 0.07 | 1.9 |
To further our investigation of this evolutionary behaviour, we determine the banded Ve/Va statistic in two luminosity bins. A high-luminosity bin corresponding to sources with L1.4 GHz > 1025 W Hz−1 sr−1 and a low-luminosity bin with L1.4 GHz < 1025 W Hz−1 sr−1. The banded test calculates the mean Ve/Va for all sources with z > z0 for a range of z0 values. All evolution below z0 is thus masked out of the analysis, allowing us to determine whether the evolution of these two populations of radio sources changes as a function of redshift. The results of the banded test are presented in Fig. 4. The error in the banded test as a result of the uncertainty in our redshift estimates is also calculated using Monte Carlo methods and presented in Table 2.
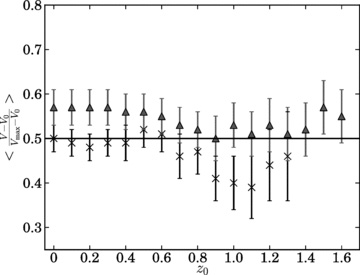
The banded V/Vmax in two luminosity bins. The bin with L1.4 GHz > 1025 W Hz−1 sr−1 is represented by grey triangles and the black crosses represent the L1.4 GHz < 1025 W Hz−1 sr−1 bin.
Results of the banded 〈Ve/Va〉 test. The column entitled 1σ (MC) lists the Monte Carlo estimates of the error in our 〈Ve/Va〉 estimates due to scatter in the K–z relation.
| z0 | L1.4 GHz < 1025 W Hz−1 sr−1 | L1.4 GHz > 1025 W Hz−1 sr−1 | ||||
| 〈Ve/Va〉 | 1σ | 1σ(MC) | 〈Ve/Va〉 | 1σ | 1σ (MC) | |
| 0 | 0.50 | 0.03 | 0.02 | 0.57 | 0.04 | 0.02 |
| 0.2 | 0.48 | 0.03 | 0.02 | 0.57 | 0.04 | 0.02 |
| 0.4 | 0.49 | 0.04 | 0.04 | 0.56 | 0.04 | 0.03 |
| 0.6 | 0.51 | 0.04 | 0.05 | 0.55 | 0.04 | 0.03 |
| 0.8 | 0.47 | 0.05 | 0.07 | 0.52 | 0.04 | 0.03 |
| 1.0 | 0.40 | 0.05 | 0.14 | 0.53 | 0.05 | 0.04 |
| 1.2 | 0.44 | 0.08 | 0.24 | 0.53 | 0.05 | 0.05 |
| 1.4 | 0.52 | 0.06 | 0.05 | |||
| 1.6 | 0.55 | 0.05 | 0.06 | |||
The results in Fig. 4 indicate that there is little evidence of evolution in the low-power radio sources out to a redshift of z∼ 0.8. Beyond this redshift there is a slight decline in the average Ve/Va of this population; however, the errors derived from our Monte Carlo estimates increase significantly at these higher redshifts. The stronger evolution of the high-luminosity sources can also be seen in this figure. The mean Ve/Va for the low- and high-luminosity bins is calculated as 0.5 ± 0.03 and 0.57 ± 0.04, respectively.
8 RADIO LUMINOSITY FUNCTION
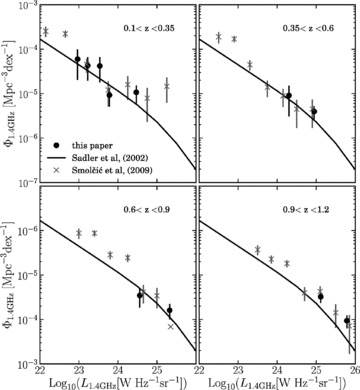
The measured radio LF in four redshift bins compared to the results of Smolčić et al. (2009). The solid line represents the analytic form for the local LF derived in Sadler et al. (2002).
Smolčić et al. (2009) characterized the evolution of the radio sources in the VLA-COSMOS by adopting the LF given by Sadler et al. (2007) as the best representative of their measured local LF and using a least-squares fit to derive the αD and αL parameters for pure density and pure luminosity evolution of this LF, respectively. The analytic form of the radio LF given in Sadler et al. (2002) was obtained from radio galaxies in the NVSS matched with optical counterparts in the 2dF Galaxy Redshift Survey.
The fitting procedure of Smolčić et al. (2009) yielded estimates of αD = 1.1 ± 0.1 and αL = 0.8 ± 0.1 where the errors were derived from the distribution of χ2 in the least-squares fit. Employing the same method we obtain values for the density and luminosity evolution parameters of αD = 0.6 ± 0.1 and αL = 0.8 ± 0.2. These estimates are fairly consistent with the estimates of Smolčić et al. (2009) and imply an increase in the comoving space density of low-luminosity radio sources by a factor of ∼1.5 in the interval z = 0–0.8.
The consistency of our results with those of Smolčić et al. (2009) provides encouraging evidence that the K–z relation can be used to investigate the radio LF. This could provide a useful alternate technique for studying the LF in the absence of multiband photometric redshift estimates.
9 CONCLUSIONS
We have used the non-parametric V/Vmax test and the radio LF to investigate the cosmic evolution of low-power radio sources in the XMM-LSS field. Previous investigations of the evolution of low-power radio sources have found evidence of mild evolution taking place in the redshift range z = 0–1.3. Donoso et al. (2009) found that the comoving density of low-luminosity sources (L1.4 GHz < 1025 W Hz−1 sr−1) in the MegaZ-Luminous Red Galaxy catalogue increases by a factor of 1.5 between z = 0.1–0.55. Similarly, Sadler et al. (2007) found evidence that low-luminosity sources experience mild evolution with an increase in their number density by a factor of ∼2 at z = 0.55. This is significantly less than the strong evolution detected in the high-power radio sources whose number densities are enhanced by a factor of 10 in the same cosmic time-frame. The results of Sadler et al. (2007) seem to rule out the no-evolution scenario. Gendre et al. (2010) found evidence that higher luminosity, L1.4 GHz≥ 1024.5 W Hz−1 sr−1, FR I sources increase their space density by a factor of ≈10 in the interval z = 0.8 ∼ 1.5.
Smolčić et al. (2009) found mild evolution of the low-power AGNs in the VLA-COSMOS out to z∼ 1.3. Our results are broadly consistent with these previous works and imply density enhancements by a factor of ∼1.5 at z = 0.8. This is slightly less than the evolution implied in Sadler et al. (2007), but in fairly good agreement with the estimates in Smolčić et al. (2009) and Donoso et al. (2009). We also find evidence that the low-power radio AGNs are evolving more slowly than their high-power counterparts in the redshift range z = 0–0.8 and tentative evidence that this separation in the evolutionary behaviour persists to z = 1.2.
The division in the FR I/FR II classification system and the LERG/HERG system occurs at roughly the same luminosity threshold of L1.4 GHz∼ 1025. As our analysis categorizes our radio sources solely based on their luminosity, we are unable to determine whether the separation in the evolutionary behaviour is due to the FR I/FR II dichotomy or due to differences in black hole accretion modes in HERGs and LERGs.
Our results demonstrate that using the K band (or similar wavelength), combined with radio surveys, is a viable route to investigating the evolution of the radio source population, at least up to z∼ 1.2. In the future, all-sky radio surveys, such as those carried out with the Low-Frequency Array (Morganti et al. 2010) and the Australian Square Kilometre Array Pathfinder telescope, combined with the UKIDSS and the VISTA Hemisphere Survey, as well as the Wide-field Infrared Survey Explorer survey, will enable us to pin down the evolution of the radio source population to a much higher degree of accuracy.
KMcA gratefully acknowledges financial support received from the South African SKA project and the National Research Foundation. MJJ acknowledges the support of a RCUK fellowship and visitor funding from the University of Cape Town and the South African SKA project. This work is based in part on data obtained as part of the UKIDSS.
REFERENCES
