


Abstract
In the third part of the series presenting the Optical Gravitational Lensing Experiment (OGLE) microlensing studies of the dark matter halo compact objects (MACHOs), we describe results of the OGLE-III monitoring of the Large Magellanic Cloud (LMC). This unprecedented data set contains almost continuous photometric coverage over 8 years of about 35 million objects spread over 40 deg2. We report a detection of two candidate microlensing events found with the automated pipeline and an additional two, less probable, candidate events found manually. The optical depth derived for the two main candidates was calculated following a detailed blending examination and detection efficiency determination and was found to be τ= (0.16 ± 0.12) × 10−7. If the microlensing signal we observe originates from MACHOs, then it means their masses are around 0.2 M⊙ and they comprise only f= 3 ± 2 per cent of the mass of the Galactic halo. However, the more likely explanation of our detections does not involve dark matter compact objects at all and relies on the natural effect of self-lensing of LMC stars by LMC lenses. In such a scenario, we can almost completely rule out MACHOs in the subsolar mass range with an upper limit at f < 7 per cent reaching its minimum of f < 4 per cent at M= 0.1 M⊙. For masses around M= 10 M⊙, the constraints on the MACHOs are more lenient with f∼ 20 per cent. Owing to limitations of the survey, there is no reasonable limit found for heavier masses, leaving only a tiny window of mass spectrum still available for dark matter compact objects.
1 INTRODUCTION
The Milky Way's halo is probably one of the least-known parts of our Galaxy. Numerous recent detections of tidal debris left over after close encounters between smaller dwarf galaxies and our giant spiral confirm the presence of cold dark matter (CDM) substructures in the halo (e.g., Belokurov et al. 2006). However, the following question still remains unanswered: what actually is, or is not, the dark matter? Compact dark matter objects (MACHOs) would have been the most convenient explanation, and in the last two decades this theory has been tested using various methods sensitive to different ranges of masses. In the high-mass regime (M > 30 M⊙), wide halo binary objects were studied, but no signature of disturbance due to MACHOs was detected (see Yoo, Chanamé & Gould 2004; Quinn et al. 2009).
For detecting stellar mass compact DM objects, the technique of gravitational microlensing was suggested by Paczyński (1986). It employs a unique feature of gravitational lensing, namely, its sensitivity to unseen objects when they bend and amplify the light of a distant source. The idea was simple: let us observe some distant background rich in stars (e.g. the Magellanic Clouds) and wait for their temporal brightening due to the passage of a massive object located along the line of sight between us and the source. Several observing campaigns started after Paczyński's proposal: MACHO (Alcock et al. 1993), Optical Gravitational Lensing Experiment (OGLE, Udalski et al. 1993), EROS (Aubourg et al. 1993) and MOA (Yock 1998), which for many years observed the Large and Small Magellanic Clouds (LMC and SMC, respectively).
The MACHO collaboration was first to publish their results and claimed that 20 per cent of the mass of the Galactic halo is composed of MACHOs with an average mass of 0.4 M⊙ (Alcock et al. 2000; Bennett 2005). Based on detection of 10 candidates for microlensing events found in the central 15 deg2 of the LMC observed over 5.7 years, they derived the optical depth towards the LMC of τLMC = (1.0 ± 0.3) × 10−7 (Bennett 2005).
In 2007, the EROS group analysed their data and published their conclusions, which contradicted the MACHO results quite severely. In their data comprising 6.7 years of continuous observations of 84 deg2, they found no candidates for microlensing events among their bright sample of stars (Tisserand et al. 2007). This led them to the upper limit for the optical depth of τLMC < 0.36 × 10⁻⁷, which translated to f=MMACHO/Mhalo < 8 per cent for MACHOs with masses 0.4 M⊙.
The OGLE project monitored the LMC during its second (1996–2000) and third (2001–2009) phases (hereinafter OGLE-II and OGLE-III, respectively), and the observations are still carrying on in the current OGLE-IV phase. Our study of the OGLE-II data (Wyrzykowski et al. 2009, hereinafter Paper I) led to the detection of two candidates for microlensing events, OGLE-LMC-01 and OGLE-LMC-02, and τLMC = 0.43 ± 0.33 × 10⁻⁷, which is closer to the limit of EROS than the value of MACHO. Moreover, all detected microlensing signal can be attributed to self-lensing (SL) (i.e. when foreground LMC stars microlense background LMC stars), leaving no room for lensing due to DM halo objects in the subsolar and solar mass range.
However, the OGLE-II phase lasted only 4 years and covered only parts of the central bar of the LMC (about 4.7 deg2); therefore, its result is naturally limited and is subject to some uncertainty. Due to small number statistics, the upper limit on the MACHO presence in the Milky Way's halo was estimated only at f < 20 per cent.
In this paper, we present yet another voice in this turbulent story of microlensing towards the Magellanic Clouds and report the results of the search for microlensing events in the OGLE-III data gathered towards the LMC. OGLE-III overwhelms most previous studies in terms of its duration (8 years) and coverage (40 deg2), but more importantly, it uniformly covers the entire LMC bar region and much of the LMC outskirts.
This paper is organized as follows. In Section 2, the OGLE-III LMC data set is described. In the following section, the search algorithm is presented. Section 4 contains the results of the search and a detailed description of all detected candidates for microlensing events. Next, the blending study is described and the optical depth is derived. This paper finishes with a discussion on the results and conclusions.
2 OBSERVATIONAL DATA
The photometric observations presented in this work were carried out during the third phase of the OGLE project (2001–2009) with the 1.3-m Warsaw telescope located at Las Campanas Observatory, Chile, operated by the Carnegie Institution of Washington. The ‘second-generation’ camera comprised eight SITe 2048 × 4096 CCD detectors with 15 μm pixels resulting in 0.26 arcsec pixel−1 scale and 35 × 35 arcmin2 field of view. The details on the instrumentation setup can be found in Udalski (2003).
There were 116 fields in the LMC covering a total area of 40 deg2. Their distribution on the sky is shown in Fig. 1. The fields are listed in Table 1 along with the coordinates of their centres, the number of ‘good’ template objects in the I band, the blending-corrected number of stars (see Section 5) and the mean number of all objects visible on a single CCD (of eight) used for deriving the blending density level. By ‘good’ we mean those template objects which have at least 80 good data points (excluding measurements with very large error-bars) and mean magnitude brighter than 20.4 mag. The limiting magnitude was selected based on the mean observed luminosity function.
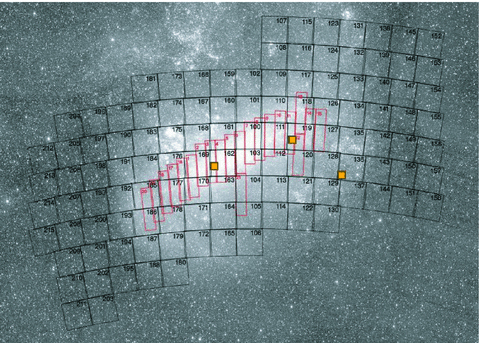
Positions of the OGLE-III LMC fields (black). Also shown are all OGLE-II fields (red rectangles). The three small filled squares show the positions of the HST fields used for our blending determination. Background image credit: ASAS All Sky Survey.
OGLE-III LMC fields.
| Field | αJ2000 | δJ2000 | N*good (103) |  | Field | αJ2000 | δJ2000 | N*good (103) |  | ||
| Template | Real | Template | Real | ||||||||
| LMC100 | 5:19:02.2 | −69:15:07 | 712.2 | 973.9 | 5.13 | LMC158 | 4:30:59.9 | −70:26:01 | 20.0 | 20.8 | 3.63 |
| LMC101 | 5:19:03.1 | −68:39:19 | 279.4 | 323.2 | 4.84 | LMC159 | 5:25:11.4 | −68:03:58 | 129.1 | 137.6 | 4.47 |
| LMC102 | 5:19:03.4 | −68:03:48 | 125.9 | 134.7 | 4.52 | LMC160 | 5:25:20.9 | −68:39:24 | 264.4 | 296.0 | 4.74 |
| LMC103 | 5:19:02.9 | −69:50:26 | 540.6 | 687.4 | 5.02 | LMC161 | 5:25:32.5 | −69:14:59 | 453.6 | 561.8 | 4.99 |
| LMC104 | 5:19:02.4 | −70:26:03 | 272.1 | 313.2 | 4.84 | LMC162 | 5:25:43.3 | −69:50:24 | 817.7 | 1159.9 | 5.17 |
| LMC105 | 5:19:01.6 | −71:01:31 | 205.0 | 224.2 | 4.65 | LMC163 | 5:25:52.2 | −70:25:55 | 524.6 | 669.5 | 5.00 |
| LMC106 | 5:19:01.0 | −71:36:57 | 135.5 | 144.6 | 4.47 | LMC164 | 5:26:08.4 | −71:01:23 | 197.5 | 217.1 | 4.68 |
| LMC107 | 5:13:01.5 | −66:52:57 | 93.2 | 99.3 | 4.45 | LMC165 | 5:26:20.9 | −71:37:01 | 140.6 | 152.3 | 4.61 |
| LMC108 | 5:13:01.9 | −67:28:40 | 105.8 | 113.2 | 4.51 | LMC166 | 5:31:20.1 | −68:03:51 | 127.8 | 138.5 | 4.59 |
| LMC109 | 5:12:53.3 | −68:04:06 | 138.8 | 149.4 | 4.57 | LMC167 | 5:31:39.6 | −68:39:32 | 180.9 | 200.1 | 4.69 |
| LMC110 | 5:12:43.6 | −68:39:42 | 293.4 | 335.6 | 4.82 | LMC168 | 5:32:01.4 | −69:15:00 | 316.2 | 374.0 | 4.90 |
| LMC111 | 5:12:32.7 | −69:15:02 | 441.2 | 526.7 | 4.94 | LMC169 | 5:32:22.8 | −69:50:26 | 757.6 | 1054.8 | 5.14 |
| LMC112 | 5:12:21.5 | −69:50:21 | 481.7 | 594.0 | 4.97 | LMC170 | 5:32:48.1 | −70:25:53 | 588.6 | 769.3 | 5.04 |
| LMC113 | 5:12:10.9 | −70:25:48 | 289.7 | 334.2 | 4.85 | LMC171 | 5:33:10.6 | −71:01:30 | 235.8 | 268.3 | 4.81 |
| LMC114 | 5:11:58.9 | −71:01:22 | 109.4 | 116.2 | 4.44 | LMC172 | 5:33:34.4 | −71:36:54 | 185.7 | 205.9 | 4.72 |
| LMC115 | 5:07:09.7 | −66:52:59 | 133.8 | 143.0 | 4.47 | LMC173 | 5:37:29.3 | −68:03:50 | 126.9 | 135.2 | 4.44 |
| LMC116 | 5:07:00.9 | −67:28:29 | 117.3 | 124.4 | 4.41 | LMC174 | 5:37:59.8 | −68:39:26 | 155.5 | 169.2 | 4.63 |
| LMC117 | 5:06:55.3 | −68:03:58 | 260.4 | 298.2 | 4.82 | LMC175 | 5:38:32.3 | −69:15:01 | 268.7 | 305.3 | 4.79 |
| LMC118 | 5:06:25.4 | −68:39:25 | 383.6 | 463.1 | 4.94 | LMC176 | 5:39:01.6 | −69:50:30 | 357.0 | 414.9 | 4.86 |
| LMC119 | 5:06:02.5 | −69:15:02 | 578.7 | 723.4 | 5.01 | LMC177 | 5:39:38.0 | −70:25:49 | 459.3 | 577.8 | 5.01 |
| LMC120 | 5:05:39.8 | −69:50:28 | 339.4 | 399.4 | 4.89 | LMC178 | 5:40:14.1 | −71:01:27 | 260.6 | 292.4 | 4.77 |
| LMC121 | 5:05:14.4 | −70:25:59 | 200.6 | 223.5 | 4.74 | LMC179 | 5:40:52.3 | −71:36:58 | 167.3 | 180.7 | 4.57 |
| LMC122 | 5:04:52.9 | −71:01:25 | 139.3 | 150.6 | 4.56 | LMC180 | 5:40:51.5 | −72:12:28 | 111.6 | 120.0 | 4.51 |
| LMC123 | 5:01:18.0 | −66:53:00 | 113.5 | 121.3 | 4.48 | LMC181 | 5:43:35.7 | −68:03:58 | 97.2 | 103.1 | 4.40 |
| LMC124 | 5:01:00.3 | −67:28:27 | 136.9 | 147.6 | 4.56 | LMC182 | 5:44:16.0 | −68:39:32 | 141.0 | 152.9 | 4.59 |
| LMC125 | 5:00:36.1 | −68:03:54 | 162.5 | 177.3 | 4.65 | LMC183 | 5:45:02.8 | −69:14:59 | 173.3 | 189.9 | 4.66 |
| LMC126 | 5:00:02.4 | −68:39:31 | 270.9 | 309.7 | 4.82 | LMC184 | 5:45:43.2 | −69:50:33 | 243.2 | 277.0 | 4.78 |
| LMC127 | 4:59:33.6 | −69:14:54 | 296.1 | 340.8 | 4.84 | LMC185 | 5:46:30.8 | −70:25:51 | 350.9 | 413.7 | 4.90 |
| LMC128 | 4:59:03.6 | −69:50:24 | 184.2 | 203.4 | 4.71 | LMC186 | 5:47:21.2 | −71:01:24 | 205.6 | 225.9 | 4.67 |
| LMC129 | 4:58:24.6 | −70:26:07 | 151.9 | 164.6 | 4.58 | LMC187 | 5:48:12.6 | −71:36:52 | 141.6 | 154.2 | 4.57 |
| LMC130 | 4:57:50.8 | −71:01:20 | 118.1 | 126.2 | 4.46 | LMC188 | 5:48:26.6 | −72:12:27 | 68.0 | 71.9 | 4.28 |
| LMC131 | 4:55:28.6 | −66:52:46 | 133.3 | 142.8 | 4.49 | LMC189 | 5:50:37.9 | −68:39:26 | 81.7 | 86.1 | 4.28 |
| LMC132 | 4:55:00.6 | −67:28:36 | 107.1 | 114.0 | 4.44 | LMC190 | 5:51:33.2 | −69:14:55 | 107.7 | 114.4 | 4.40 |
| LMC133 | 4:54:29.2 | −68:03:47 | 186.6 | 204.2 | 4.64 | LMC191 | 5:52:20.1 | −69:50:24 | 137.7 | 147.9 | 4.48 |
| LMC134 | 4:53:49.2 | −68:39:18 | 158.5 | 171.4 | 4.58 | LMC192 | 5:53:24.1 | −70:25:51 | 143.3 | 154.0 | 4.46 |
| LMC135 | 4:53:05.2 | −69:14:51 | 140.0 | 150.6 | 4.55 | LMC193 | 5:54:21.7 | −71:01:34 | 83.4 | 88.1 | 4.24 |
| LMC136 | 4:52:23.7 | −69:50:25 | 117.3 | 125.1 | 4.49 | LMC194 | 5:55:29.7 | −71:36:59 | 44.8 | 46.8 | 3.99 |
| LMC137 | 4:51:30.2 | −70:26:01 | 87.0 | 92.3 | 4.40 | LMC195 | 5:56:00.0 | −72:12:25 | 24.9 | 25.8 | 3.73 |
| LMC138 | 4:49:34.7 | −66:53:07 | 52.2 | 54.8 | 4.17 | LMC196 | 5:56:54.7 | −68:39:29 | 51.7 | 54.2 | 4.16 |
| LMC139 | 4:49:05.2 | −67:28:30 | 52.8 | 55.5 | 4.21 | LMC197 | 5:58:02.7 | −69:15:06 | 50.2 | 52.5 | 4.06 |
| LMC140 | 4:48:18.2 | −68:04:05 | 81.9 | 86.8 | 4.37 | LMC198 | 5:59:02.5 | −69:50:35 | 43.0 | 44.8 | 3.95 |
| LMC141 | 4:47:26.7 | −68:39:36 | 85.6 | 90.7 | 4.38 | LMC199 | 6:00:14.7 | −70:26:00 | 39.2 | 40.8 | 3.90 |
| LMC142 | 4:46:31.9 | −69:15:08 | 112.7 | 120.4 | 4.45 | LMC200 | 6:01:27.5 | −71:01:36 | 35.1 | 36.6 | 3.87 |
| LMC143 | 4:45:43.1 | −69:50:19 | 78.7 | 82.9 | 4.29 | LMC201 | 6:02:45.9 | −71:37:04 | 46.9 | 49.2 | 4.06 |
| LMC144 | 4:44:40.2 | −70:26:01 | 55.8 | 58.5 | 4.16 | LMC202 | 6:03:28.3 | −72:12:34 | 42.9 | 44.9 | 4.00 |
| LMC145 | 4:43:47.5 | −66:52:43 | 30.1 | 31.3 | 3.91 | LMC203 | 6:03:29.9 | −72:48:04 | 40.9 | 42.8 | 3.95 |
| LMC146 | 4:43:03.0 | −67:28:17 | 39.4 | 41.2 | 4.03 | LMC204 | 6:03:14.6 | −68:39:25 | 55.3 | 58.1 | 4.13 |
| LMC147 | 4:42:07.8 | −68:03:55 | 46.9 | 49.1 | 4.11 | LMC205 | 6:04:32.9 | −69:15:04 | 36.7 | 38.4 | 4.01 |
| LMC148 | 4:41:06.8 | −68:39:27 | 49.1 | 51.4 | 4.14 | LMC206 | 6:05:40.3 | −69:50:27 | 38.3 | 40.0 | 3.99 |
| LMC149 | 4:40:05.1 | −69:14:57 | 52.3 | 54.8 | 4.16 | LMC207 | 6:07:04.2 | −70:25:55 | 35.9 | 37.4 | 3.95 |
| LMC150 | 4:39:05.3 | −69:50:16 | 44.8 | 46.8 | 4.08 | LMC208 | 6:08:30.4 | −71:01:27 | 44.1 | 46.2 | 4.04 |
| LMC151 | 4:37:51.6 | −70:25:45 | 38.1 | 39.8 | 4.05 | LMC209 | 6:10:07.0 | −71:37:00 | 37.5 | 39.1 | 3.91 |
| LMC152 | 4:37:54.1 | −66:52:52 | 25.3 | 26.5 | 3.76 | LMC210 | 6:10:55.7 | −72:12:37 | 34.5 | 36.1 | 3.94 |
| LMC153 | 4:37:01.7 | −67:28:30 | 27.3 | 28.5 | 3.85 | LMC211 | 6:11:22.0 | −72:48:04 | 31.3 | 32.7 | 3.88 |
| LMC154 | 4:35:59.1 | −68:04:02 | 26.6 | 27.8 | 3.91 | LMC212 | 6:11:04.0 | −69:14:50 | 39.9 | 41.7 | 4.01 |
| LMC155 | 4:34:49.4 | −68:39:32 | 33.0 | 34.5 | 3.95 | LMC213 | 6:12:17.9 | −69:50:37 | 32.7 | 34.1 | 3.81 |
| LMC156 | 4:33:32.7 | −69:15:00 | 34.3 | 35.9 | 3.96 | LMC214 | 6:13:58.2 | −70:26:08 | 31.6 | 32.9 | 3.88 |
| LMC157 | 4:32:23.8 | −69:50:26 | 25.6 | 26.6 | 3.74 | LMC215 | 6:15:36.4 | −71:01:28 | 32.0 | 33.3 | 3.88 |
| Total | 19 424.4 | 22 740.0 | |||||||||
| Field | αJ2000 | δJ2000 | N*good (103) | | Field | αJ2000 | δJ2000 | N*good (103) | | ||
| Template | Real | Template | Real | ||||||||
| LMC100 | 5:19:02.2 | −69:15:07 | 712.2 | 973.9 | 5.13 | LMC158 | 4:30:59.9 | −70:26:01 | 20.0 | 20.8 | 3.63 |
| LMC101 | 5:19:03.1 | −68:39:19 | 279.4 | 323.2 | 4.84 | LMC159 | 5:25:11.4 | −68:03:58 | 129.1 | 137.6 | 4.47 |
| LMC102 | 5:19:03.4 | −68:03:48 | 125.9 | 134.7 | 4.52 | LMC160 | 5:25:20.9 | −68:39:24 | 264.4 | 296.0 | 4.74 |
| LMC103 | 5:19:02.9 | −69:50:26 | 540.6 | 687.4 | 5.02 | LMC161 | 5:25:32.5 | −69:14:59 | 453.6 | 561.8 | 4.99 |
| LMC104 | 5:19:02.4 | −70:26:03 | 272.1 | 313.2 | 4.84 | LMC162 | 5:25:43.3 | −69:50:24 | 817.7 | 1159.9 | 5.17 |
| LMC105 | 5:19:01.6 | −71:01:31 | 205.0 | 224.2 | 4.65 | LMC163 | 5:25:52.2 | −70:25:55 | 524.6 | 669.5 | 5.00 |
| LMC106 | 5:19:01.0 | −71:36:57 | 135.5 | 144.6 | 4.47 | LMC164 | 5:26:08.4 | −71:01:23 | 197.5 | 217.1 | 4.68 |
| LMC107 | 5:13:01.5 | −66:52:57 | 93.2 | 99.3 | 4.45 | LMC165 | 5:26:20.9 | −71:37:01 | 140.6 | 152.3 | 4.61 |
| LMC108 | 5:13:01.9 | −67:28:40 | 105.8 | 113.2 | 4.51 | LMC166 | 5:31:20.1 | −68:03:51 | 127.8 | 138.5 | 4.59 |
| LMC109 | 5:12:53.3 | −68:04:06 | 138.8 | 149.4 | 4.57 | LMC167 | 5:31:39.6 | −68:39:32 | 180.9 | 200.1 | 4.69 |
| LMC110 | 5:12:43.6 | −68:39:42 | 293.4 | 335.6 | 4.82 | LMC168 | 5:32:01.4 | −69:15:00 | 316.2 | 374.0 | 4.90 |
| LMC111 | 5:12:32.7 | −69:15:02 | 441.2 | 526.7 | 4.94 | LMC169 | 5:32:22.8 | −69:50:26 | 757.6 | 1054.8 | 5.14 |
| LMC112 | 5:12:21.5 | −69:50:21 | 481.7 | 594.0 | 4.97 | LMC170 | 5:32:48.1 | −70:25:53 | 588.6 | 769.3 | 5.04 |
| LMC113 | 5:12:10.9 | −70:25:48 | 289.7 | 334.2 | 4.85 | LMC171 | 5:33:10.6 | −71:01:30 | 235.8 | 268.3 | 4.81 |
| LMC114 | 5:11:58.9 | −71:01:22 | 109.4 | 116.2 | 4.44 | LMC172 | 5:33:34.4 | −71:36:54 | 185.7 | 205.9 | 4.72 |
| LMC115 | 5:07:09.7 | −66:52:59 | 133.8 | 143.0 | 4.47 | LMC173 | 5:37:29.3 | −68:03:50 | 126.9 | 135.2 | 4.44 |
| LMC116 | 5:07:00.9 | −67:28:29 | 117.3 | 124.4 | 4.41 | LMC174 | 5:37:59.8 | −68:39:26 | 155.5 | 169.2 | 4.63 |
| LMC117 | 5:06:55.3 | −68:03:58 | 260.4 | 298.2 | 4.82 | LMC175 | 5:38:32.3 | −69:15:01 | 268.7 | 305.3 | 4.79 |
| LMC118 | 5:06:25.4 | −68:39:25 | 383.6 | 463.1 | 4.94 | LMC176 | 5:39:01.6 | −69:50:30 | 357.0 | 414.9 | 4.86 |
| LMC119 | 5:06:02.5 | −69:15:02 | 578.7 | 723.4 | 5.01 | LMC177 | 5:39:38.0 | −70:25:49 | 459.3 | 577.8 | 5.01 |
| LMC120 | 5:05:39.8 | −69:50:28 | 339.4 | 399.4 | 4.89 | LMC178 | 5:40:14.1 | −71:01:27 | 260.6 | 292.4 | 4.77 |
| LMC121 | 5:05:14.4 | −70:25:59 | 200.6 | 223.5 | 4.74 | LMC179 | 5:40:52.3 | −71:36:58 | 167.3 | 180.7 | 4.57 |
| LMC122 | 5:04:52.9 | −71:01:25 | 139.3 | 150.6 | 4.56 | LMC180 | 5:40:51.5 | −72:12:28 | 111.6 | 120.0 | 4.51 |
| LMC123 | 5:01:18.0 | −66:53:00 | 113.5 | 121.3 | 4.48 | LMC181 | 5:43:35.7 | −68:03:58 | 97.2 | 103.1 | 4.40 |
| LMC124 | 5:01:00.3 | −67:28:27 | 136.9 | 147.6 | 4.56 | LMC182 | 5:44:16.0 | −68:39:32 | 141.0 | 152.9 | 4.59 |
| LMC125 | 5:00:36.1 | −68:03:54 | 162.5 | 177.3 | 4.65 | LMC183 | 5:45:02.8 | −69:14:59 | 173.3 | 189.9 | 4.66 |
| LMC126 | 5:00:02.4 | −68:39:31 | 270.9 | 309.7 | 4.82 | LMC184 | 5:45:43.2 | −69:50:33 | 243.2 | 277.0 | 4.78 |
| LMC127 | 4:59:33.6 | −69:14:54 | 296.1 | 340.8 | 4.84 | LMC185 | 5:46:30.8 | −70:25:51 | 350.9 | 413.7 | 4.90 |
| LMC128 | 4:59:03.6 | −69:50:24 | 184.2 | 203.4 | 4.71 | LMC186 | 5:47:21.2 | −71:01:24 | 205.6 | 225.9 | 4.67 |
| LMC129 | 4:58:24.6 | −70:26:07 | 151.9 | 164.6 | 4.58 | LMC187 | 5:48:12.6 | −71:36:52 | 141.6 | 154.2 | 4.57 |
| LMC130 | 4:57:50.8 | −71:01:20 | 118.1 | 126.2 | 4.46 | LMC188 | 5:48:26.6 | −72:12:27 | 68.0 | 71.9 | 4.28 |
| LMC131 | 4:55:28.6 | −66:52:46 | 133.3 | 142.8 | 4.49 | LMC189 | 5:50:37.9 | −68:39:26 | 81.7 | 86.1 | 4.28 |
| LMC132 | 4:55:00.6 | −67:28:36 | 107.1 | 114.0 | 4.44 | LMC190 | 5:51:33.2 | −69:14:55 | 107.7 | 114.4 | 4.40 |
| LMC133 | 4:54:29.2 | −68:03:47 | 186.6 | 204.2 | 4.64 | LMC191 | 5:52:20.1 | −69:50:24 | 137.7 | 147.9 | 4.48 |
| LMC134 | 4:53:49.2 | −68:39:18 | 158.5 | 171.4 | 4.58 | LMC192 | 5:53:24.1 | −70:25:51 | 143.3 | 154.0 | 4.46 |
| LMC135 | 4:53:05.2 | −69:14:51 | 140.0 | 150.6 | 4.55 | LMC193 | 5:54:21.7 | −71:01:34 | 83.4 | 88.1 | 4.24 |
| LMC136 | 4:52:23.7 | −69:50:25 | 117.3 | 125.1 | 4.49 | LMC194 | 5:55:29.7 | −71:36:59 | 44.8 | 46.8 | 3.99 |
| LMC137 | 4:51:30.2 | −70:26:01 | 87.0 | 92.3 | 4.40 | LMC195 | 5:56:00.0 | −72:12:25 | 24.9 | 25.8 | 3.73 |
| LMC138 | 4:49:34.7 | −66:53:07 | 52.2 | 54.8 | 4.17 | LMC196 | 5:56:54.7 | −68:39:29 | 51.7 | 54.2 | 4.16 |
| LMC139 | 4:49:05.2 | −67:28:30 | 52.8 | 55.5 | 4.21 | LMC197 | 5:58:02.7 | −69:15:06 | 50.2 | 52.5 | 4.06 |
| LMC140 | 4:48:18.2 | −68:04:05 | 81.9 | 86.8 | 4.37 | LMC198 | 5:59:02.5 | −69:50:35 | 43.0 | 44.8 | 3.95 |
| LMC141 | 4:47:26.7 | −68:39:36 | 85.6 | 90.7 | 4.38 | LMC199 | 6:00:14.7 | −70:26:00 | 39.2 | 40.8 | 3.90 |
| LMC142 | 4:46:31.9 | −69:15:08 | 112.7 | 120.4 | 4.45 | LMC200 | 6:01:27.5 | −71:01:36 | 35.1 | 36.6 | 3.87 |
| LMC143 | 4:45:43.1 | −69:50:19 | 78.7 | 82.9 | 4.29 | LMC201 | 6:02:45.9 | −71:37:04 | 46.9 | 49.2 | 4.06 |
| LMC144 | 4:44:40.2 | −70:26:01 | 55.8 | 58.5 | 4.16 | LMC202 | 6:03:28.3 | −72:12:34 | 42.9 | 44.9 | 4.00 |
| LMC145 | 4:43:47.5 | −66:52:43 | 30.1 | 31.3 | 3.91 | LMC203 | 6:03:29.9 | −72:48:04 | 40.9 | 42.8 | 3.95 |
| LMC146 | 4:43:03.0 | −67:28:17 | 39.4 | 41.2 | 4.03 | LMC204 | 6:03:14.6 | −68:39:25 | 55.3 | 58.1 | 4.13 |
| LMC147 | 4:42:07.8 | −68:03:55 | 46.9 | 49.1 | 4.11 | LMC205 | 6:04:32.9 | −69:15:04 | 36.7 | 38.4 | 4.01 |
| LMC148 | 4:41:06.8 | −68:39:27 | 49.1 | 51.4 | 4.14 | LMC206 | 6:05:40.3 | −69:50:27 | 38.3 | 40.0 | 3.99 |
| LMC149 | 4:40:05.1 | −69:14:57 | 52.3 | 54.8 | 4.16 | LMC207 | 6:07:04.2 | −70:25:55 | 35.9 | 37.4 | 3.95 |
| LMC150 | 4:39:05.3 | −69:50:16 | 44.8 | 46.8 | 4.08 | LMC208 | 6:08:30.4 | −71:01:27 | 44.1 | 46.2 | 4.04 |
| LMC151 | 4:37:51.6 | −70:25:45 | 38.1 | 39.8 | 4.05 | LMC209 | 6:10:07.0 | −71:37:00 | 37.5 | 39.1 | 3.91 |
| LMC152 | 4:37:54.1 | −66:52:52 | 25.3 | 26.5 | 3.76 | LMC210 | 6:10:55.7 | −72:12:37 | 34.5 | 36.1 | 3.94 |
| LMC153 | 4:37:01.7 | −67:28:30 | 27.3 | 28.5 | 3.85 | LMC211 | 6:11:22.0 | −72:48:04 | 31.3 | 32.7 | 3.88 |
| LMC154 | 4:35:59.1 | −68:04:02 | 26.6 | 27.8 | 3.91 | LMC212 | 6:11:04.0 | −69:14:50 | 39.9 | 41.7 | 4.01 |
| LMC155 | 4:34:49.4 | −68:39:32 | 33.0 | 34.5 | 3.95 | LMC213 | 6:12:17.9 | −69:50:37 | 32.7 | 34.1 | 3.81 |
| LMC156 | 4:33:32.7 | −69:15:00 | 34.3 | 35.9 | 3.96 | LMC214 | 6:13:58.2 | −70:26:08 | 31.6 | 32.9 | 3.88 |
| LMC157 | 4:32:23.8 | −69:50:26 | 25.6 | 26.6 | 3.74 | LMC215 | 6:15:36.4 | −71:01:28 | 32.0 | 33.3 | 3.88 |
| Total | 19 424.4 | 22 740.0 | |||||||||
Note: Coordinates point to the centre of the field (centre of the mosaic), each being 35 × 35 arcmin2. The number of ‘good’ objects in the template is provided (N > 80 and 〈I〉 < 20.4 mag) together with the estimated number of real monitored stars (see Section 5). The mean number of all objects detected on a single CCD used for calculating the density of a field is given in the last column.
OGLE-III LMC fields.
| Field | αJ2000 | δJ2000 | N*good (103) | | Field | αJ2000 | δJ2000 | N*good (103) | | ||
| Template | Real | Template | Real | ||||||||
| LMC100 | 5:19:02.2 | −69:15:07 | 712.2 | 973.9 | 5.13 | LMC158 | 4:30:59.9 | −70:26:01 | 20.0 | 20.8 | 3.63 |
| LMC101 | 5:19:03.1 | −68:39:19 | 279.4 | 323.2 | 4.84 | LMC159 | 5:25:11.4 | −68:03:58 | 129.1 | 137.6 | 4.47 |
| LMC102 | 5:19:03.4 | −68:03:48 | 125.9 | 134.7 | 4.52 | LMC160 | 5:25:20.9 | −68:39:24 | 264.4 | 296.0 | 4.74 |
| LMC103 | 5:19:02.9 | −69:50:26 | 540.6 | 687.4 | 5.02 | LMC161 | 5:25:32.5 | −69:14:59 | 453.6 | 561.8 | 4.99 |
| LMC104 | 5:19:02.4 | −70:26:03 | 272.1 | 313.2 | 4.84 | LMC162 | 5:25:43.3 | −69:50:24 | 817.7 | 1159.9 | 5.17 |
| LMC105 | 5:19:01.6 | −71:01:31 | 205.0 | 224.2 | 4.65 | LMC163 | 5:25:52.2 | −70:25:55 | 524.6 | 669.5 | 5.00 |
| LMC106 | 5:19:01.0 | −71:36:57 | 135.5 | 144.6 | 4.47 | LMC164 | 5:26:08.4 | −71:01:23 | 197.5 | 217.1 | 4.68 |
| LMC107 | 5:13:01.5 | −66:52:57 | 93.2 | 99.3 | 4.45 | LMC165 | 5:26:20.9 | −71:37:01 | 140.6 | 152.3 | 4.61 |
| LMC108 | 5:13:01.9 | −67:28:40 | 105.8 | 113.2 | 4.51 | LMC166 | 5:31:20.1 | −68:03:51 | 127.8 | 138.5 | 4.59 |
| LMC109 | 5:12:53.3 | −68:04:06 | 138.8 | 149.4 | 4.57 | LMC167 | 5:31:39.6 | −68:39:32 | 180.9 | 200.1 | 4.69 |
| LMC110 | 5:12:43.6 | −68:39:42 | 293.4 | 335.6 | 4.82 | LMC168 | 5:32:01.4 | −69:15:00 | 316.2 | 374.0 | 4.90 |
| LMC111 | 5:12:32.7 | −69:15:02 | 441.2 | 526.7 | 4.94 | LMC169 | 5:32:22.8 | −69:50:26 | 757.6 | 1054.8 | 5.14 |
| LMC112 | 5:12:21.5 | −69:50:21 | 481.7 | 594.0 | 4.97 | LMC170 | 5:32:48.1 | −70:25:53 | 588.6 | 769.3 | 5.04 |
| LMC113 | 5:12:10.9 | −70:25:48 | 289.7 | 334.2 | 4.85 | LMC171 | 5:33:10.6 | −71:01:30 | 235.8 | 268.3 | 4.81 |
| LMC114 | 5:11:58.9 | −71:01:22 | 109.4 | 116.2 | 4.44 | LMC172 | 5:33:34.4 | −71:36:54 | 185.7 | 205.9 | 4.72 |
| LMC115 | 5:07:09.7 | −66:52:59 | 133.8 | 143.0 | 4.47 | LMC173 | 5:37:29.3 | −68:03:50 | 126.9 | 135.2 | 4.44 |
| LMC116 | 5:07:00.9 | −67:28:29 | 117.3 | 124.4 | 4.41 | LMC174 | 5:37:59.8 | −68:39:26 | 155.5 | 169.2 | 4.63 |
| LMC117 | 5:06:55.3 | −68:03:58 | 260.4 | 298.2 | 4.82 | LMC175 | 5:38:32.3 | −69:15:01 | 268.7 | 305.3 | 4.79 |
| LMC118 | 5:06:25.4 | −68:39:25 | 383.6 | 463.1 | 4.94 | LMC176 | 5:39:01.6 | −69:50:30 | 357.0 | 414.9 | 4.86 |
| LMC119 | 5:06:02.5 | −69:15:02 | 578.7 | 723.4 | 5.01 | LMC177 | 5:39:38.0 | −70:25:49 | 459.3 | 577.8 | 5.01 |
| LMC120 | 5:05:39.8 | −69:50:28 | 339.4 | 399.4 | 4.89 | LMC178 | 5:40:14.1 | −71:01:27 | 260.6 | 292.4 | 4.77 |
| LMC121 | 5:05:14.4 | −70:25:59 | 200.6 | 223.5 | 4.74 | LMC179 | 5:40:52.3 | −71:36:58 | 167.3 | 180.7 | 4.57 |
| LMC122 | 5:04:52.9 | −71:01:25 | 139.3 | 150.6 | 4.56 | LMC180 | 5:40:51.5 | −72:12:28 | 111.6 | 120.0 | 4.51 |
| LMC123 | 5:01:18.0 | −66:53:00 | 113.5 | 121.3 | 4.48 | LMC181 | 5:43:35.7 | −68:03:58 | 97.2 | 103.1 | 4.40 |
| LMC124 | 5:01:00.3 | −67:28:27 | 136.9 | 147.6 | 4.56 | LMC182 | 5:44:16.0 | −68:39:32 | 141.0 | 152.9 | 4.59 |
| LMC125 | 5:00:36.1 | −68:03:54 | 162.5 | 177.3 | 4.65 | LMC183 | 5:45:02.8 | −69:14:59 | 173.3 | 189.9 | 4.66 |
| LMC126 | 5:00:02.4 | −68:39:31 | 270.9 | 309.7 | 4.82 | LMC184 | 5:45:43.2 | −69:50:33 | 243.2 | 277.0 | 4.78 |
| LMC127 | 4:59:33.6 | −69:14:54 | 296.1 | 340.8 | 4.84 | LMC185 | 5:46:30.8 | −70:25:51 | 350.9 | 413.7 | 4.90 |
| LMC128 | 4:59:03.6 | −69:50:24 | 184.2 | 203.4 | 4.71 | LMC186 | 5:47:21.2 | −71:01:24 | 205.6 | 225.9 | 4.67 |
| LMC129 | 4:58:24.6 | −70:26:07 | 151.9 | 164.6 | 4.58 | LMC187 | 5:48:12.6 | −71:36:52 | 141.6 | 154.2 | 4.57 |
| LMC130 | 4:57:50.8 | −71:01:20 | 118.1 | 126.2 | 4.46 | LMC188 | 5:48:26.6 | −72:12:27 | 68.0 | 71.9 | 4.28 |
| LMC131 | 4:55:28.6 | −66:52:46 | 133.3 | 142.8 | 4.49 | LMC189 | 5:50:37.9 | −68:39:26 | 81.7 | 86.1 | 4.28 |
| LMC132 | 4:55:00.6 | −67:28:36 | 107.1 | 114.0 | 4.44 | LMC190 | 5:51:33.2 | −69:14:55 | 107.7 | 114.4 | 4.40 |
| LMC133 | 4:54:29.2 | −68:03:47 | 186.6 | 204.2 | 4.64 | LMC191 | 5:52:20.1 | −69:50:24 | 137.7 | 147.9 | 4.48 |
| LMC134 | 4:53:49.2 | −68:39:18 | 158.5 | 171.4 | 4.58 | LMC192 | 5:53:24.1 | −70:25:51 | 143.3 | 154.0 | 4.46 |
| LMC135 | 4:53:05.2 | −69:14:51 | 140.0 | 150.6 | 4.55 | LMC193 | 5:54:21.7 | −71:01:34 | 83.4 | 88.1 | 4.24 |
| LMC136 | 4:52:23.7 | −69:50:25 | 117.3 | 125.1 | 4.49 | LMC194 | 5:55:29.7 | −71:36:59 | 44.8 | 46.8 | 3.99 |
| LMC137 | 4:51:30.2 | −70:26:01 | 87.0 | 92.3 | 4.40 | LMC195 | 5:56:00.0 | −72:12:25 | 24.9 | 25.8 | 3.73 |
| LMC138 | 4:49:34.7 | −66:53:07 | 52.2 | 54.8 | 4.17 | LMC196 | 5:56:54.7 | −68:39:29 | 51.7 | 54.2 | 4.16 |
| LMC139 | 4:49:05.2 | −67:28:30 | 52.8 | 55.5 | 4.21 | LMC197 | 5:58:02.7 | −69:15:06 | 50.2 | 52.5 | 4.06 |
| LMC140 | 4:48:18.2 | −68:04:05 | 81.9 | 86.8 | 4.37 | LMC198 | 5:59:02.5 | −69:50:35 | 43.0 | 44.8 | 3.95 |
| LMC141 | 4:47:26.7 | −68:39:36 | 85.6 | 90.7 | 4.38 | LMC199 | 6:00:14.7 | −70:26:00 | 39.2 | 40.8 | 3.90 |
| LMC142 | 4:46:31.9 | −69:15:08 | 112.7 | 120.4 | 4.45 | LMC200 | 6:01:27.5 | −71:01:36 | 35.1 | 36.6 | 3.87 |
| LMC143 | 4:45:43.1 | −69:50:19 | 78.7 | 82.9 | 4.29 | LMC201 | 6:02:45.9 | −71:37:04 | 46.9 | 49.2 | 4.06 |
| LMC144 | 4:44:40.2 | −70:26:01 | 55.8 | 58.5 | 4.16 | LMC202 | 6:03:28.3 | −72:12:34 | 42.9 | 44.9 | 4.00 |
| LMC145 | 4:43:47.5 | −66:52:43 | 30.1 | 31.3 | 3.91 | LMC203 | 6:03:29.9 | −72:48:04 | 40.9 | 42.8 | 3.95 |
| LMC146 | 4:43:03.0 | −67:28:17 | 39.4 | 41.2 | 4.03 | LMC204 | 6:03:14.6 | −68:39:25 | 55.3 | 58.1 | 4.13 |
| LMC147 | 4:42:07.8 | −68:03:55 | 46.9 | 49.1 | 4.11 | LMC205 | 6:04:32.9 | −69:15:04 | 36.7 | 38.4 | 4.01 |
| LMC148 | 4:41:06.8 | −68:39:27 | 49.1 | 51.4 | 4.14 | LMC206 | 6:05:40.3 | −69:50:27 | 38.3 | 40.0 | 3.99 |
| LMC149 | 4:40:05.1 | −69:14:57 | 52.3 | 54.8 | 4.16 | LMC207 | 6:07:04.2 | −70:25:55 | 35.9 | 37.4 | 3.95 |
| LMC150 | 4:39:05.3 | −69:50:16 | 44.8 | 46.8 | 4.08 | LMC208 | 6:08:30.4 | −71:01:27 | 44.1 | 46.2 | 4.04 |
| LMC151 | 4:37:51.6 | −70:25:45 | 38.1 | 39.8 | 4.05 | LMC209 | 6:10:07.0 | −71:37:00 | 37.5 | 39.1 | 3.91 |
| LMC152 | 4:37:54.1 | −66:52:52 | 25.3 | 26.5 | 3.76 | LMC210 | 6:10:55.7 | −72:12:37 | 34.5 | 36.1 | 3.94 |
| LMC153 | 4:37:01.7 | −67:28:30 | 27.3 | 28.5 | 3.85 | LMC211 | 6:11:22.0 | −72:48:04 | 31.3 | 32.7 | 3.88 |
| LMC154 | 4:35:59.1 | −68:04:02 | 26.6 | 27.8 | 3.91 | LMC212 | 6:11:04.0 | −69:14:50 | 39.9 | 41.7 | 4.01 |
| LMC155 | 4:34:49.4 | −68:39:32 | 33.0 | 34.5 | 3.95 | LMC213 | 6:12:17.9 | −69:50:37 | 32.7 | 34.1 | 3.81 |
| LMC156 | 4:33:32.7 | −69:15:00 | 34.3 | 35.9 | 3.96 | LMC214 | 6:13:58.2 | −70:26:08 | 31.6 | 32.9 | 3.88 |
| LMC157 | 4:32:23.8 | −69:50:26 | 25.6 | 26.6 | 3.74 | LMC215 | 6:15:36.4 | −71:01:28 | 32.0 | 33.3 | 3.88 |
| Total | 19 424.4 | 22 740.0 | |||||||||
Note: Coordinates point to the centre of the field (centre of the mosaic), each being 35 × 35 arcmin2. The number of ‘good’ objects in the template is provided (N > 80 and 〈I〉 < 20.4 mag) together with the estimated number of real monitored stars (see Section 5). The mean number of all objects detected on a single CCD used for calculating the density of a field is given in the last column.
The very first observations of the LMC within the OGLE-III phase were taken in 2001 July (JD =245 2115.9); however, regular monitoring started in 2001 September and continued until 2009 May (JD =245 4964.5). The vast majority of observations were done through the Cousins I-band filter with exposure time of 180 s. Between 385 and 637 measurements were taken in each field with an average sampling varying from 3.0 to 4.6 d between subsequent frames (excluding the gaps between the seasons). In addition to that, between 30 and 137 observations per field were obtained in the Johnson V band and an integration time of 225 s. Average sampling frequency in the V band was between 4.2 and 13.6 d.
The images were reduced with the pipeline based on the Difference Image Analysis (DIA; Alard & Lupton 1998, Woźniak 2000). The photometry used in this work comes from the final reduction calibrated to the standard system. Full descriptions of the reduction techniques, photometric calibration and astrometric transformations can be found in Udalski et al. (2008).
For all the LMC fields, the mean values of the error-correction parameters were 〈γI〉 = 1.2039, 〈εI〉 = 0.0046, 〈γV〉 = 0.9956 and 〈εV〉 = 0.0035.
Error corrections for I and V passbands for the first couple of fields are gathered in Table 2. The full table is available online on the OGLE website.1
Error correction coefficients for each CCD chip of the first four OGLE-III LMC fields for the I and V bands. The full table is available online from the OGLE website.
| Field | γI | εI | γV | εV |
| LMC100.1 | 1.049373 | 0.00412404 | 0.917834 | 0.0035 |
| LMC100.2 | 1.060207 | 0.00485469 | 0.985456 | 0.0035 |
| LMC100.3 | 1.077131 | 0.00463489 | 1.006376 | 0.0035 |
| LMC100.4 | 1.135749 | 0.0039967 | 1.014130 | 0.0035 |
| LMC100.5 | 1.131603 | 0.00512842 | 0.976961 | 0.0035 |
| LMC100.6 | 1.119252 | 0.00442105 | 0.971518 | 0.0035 |
| LMC100.7 | 1.093156 | 0.00463935 | 0.956374 | 0.0035 |
| LMC100.8 | 1.075116 | 0.00473159 | 0.977142 | 0.0035 |
| LMC101.1 | 0.886630 | 0.00412372 | 0.913540 | 0.0035 |
| LMC101.2 | 0.924936 | 0.00485499 | 0.985448 | 0.0035 |
| LMC101.3 | 0.927672 | 0.00463465 | 0.990697 | 0.0035 |
| LMC101.4 | 0.961909 | 0.00399673 | 0.987186 | 0.0035 |
| LMC101.5 | 0.945618 | 0.00512809 | 0.900159 | 0.0035 |
| LMC101.6 | 0.958065 | 0.00442147 | 0.970733 | 0.0035 |
| LMC101.7 | 0.933999 | 0.00463917 | 0.975772 | 0.0035 |
| LMC101.8 | 0.925774 | 0.00473256 | 0.956004 | 0.0035 |
| LMC102.1 | 1.077252 | 0.00412372 | 1.018413 | 0.0035 |
| LMC102.2 | 1.067985 | 0.00485506 | 1.029716 | 0.0035 |
| LMC102.3 | 1.101820 | 0.00463536 | 1.018757 | 0.0035 |
| LMC102.4 | 1.166521 | 0.00399767 | 1.055142 | 0.0035 |
| LMC102.5 | 1.147459 | 0.00512799 | 0.989320 | 0.0035 |
| LMC102.6 | 1.104168 | 0.00442109 | 1.031484 | 0.0035 |
| LMC102.7 | 1.085202 | 0.00463924 | 0.978987 | 0.0035 |
| LMC102.8 | 1.107776 | 0.00473242 | 0.992293 | 0.0035 |
| LMC103.1 | 0.940445 | 0.00412385 | 0.916057 | 0.0035 |
| LMC103.2 | 0.941654 | 0.00485423 | 0.979160 | 0.0035 |
| LMC103.3 | 0.932683 | 0.0046345 | 0.953727 | 0.0035 |
| LMC103.4 | 0.949726 | 0.0039974 | 0.929897 | 0.0035 |
| LMC103.5 | 0.930998 | 0.00512794 | 0.905821 | 0.0035 |
| LMC103.6 | 0.945777 | 0.00442151 | 0.951769 | 0.0035 |
| LMC103.7 | 0.930089 | 0.00463928 | 0.976390 | 0.0035 |
| LMC103.8 | 0.922839 | 0.00473232 | 0.986609 | 0.0035 |
| … |
3 SEARCH PROCEDURE
The main search for microlensing event candidates was performed on the regular data base containing light curves of all stars which were detected on the template images.
The search criteria are gathered in Table 3 along with the number of objects left after each cut for two star samples: ‘All Stars’ and ‘Bright Stars’. We performed the search in the two samples to allow for a comparison with the previous optical depth determinations by EROS (Bright Stars) and MACHO (All Stars). The samples are formed from ‘good’ objects found on a template image and differ with magnitude cut (dubbed ‘cut 0’) applied prior to the actual search for events. The All Stars sample consists of all objects down to 20.4 mag and the Bright Stars sample has the cut 0 set to a red clump centre magnitude plus 1 mag, following Tisserand et al. (2007) and Paper I. The conditions follow the ones we derived for and presented in the study of the OGLE-II LMC (Paper I) and SMC (Wyrzykowski et al. 2010, hereinafter Paper II). Because of slightly different properties of the OGLE-III data and sampling, the search parameters were derived again through the Monte Carlo simulations. Random constant (i.e. non-variable) stars from the data base were artificially microlensed and run through the search pipeline to fine tune the parameters of the pipeline.
Selection criteria for search for microlensing events in the OGLE-III LMC data and the number of objects left after each cut for the All Stars and Bright Stars samples.
| Cut number | Number of objects left | |||
| All Stars | Bright Stars | |||
| 0a | Selection of ‘good’ objects | N > 80, 〈I〉≤ 20.4 mag | 19 424 384 | |
| 0b | N > 80, 〈I〉≤ 18.8 mag | 5 782 733 | ||
| 1 | Significant bump over baseline |  | 5529 | 4553 |
| 2 | SN1987a light echo filter |  arcmin arcmin | 5413 | 4466 |
| 3 | ‘Bumper’ cuta | 〈I〉 > 18.5 mag, 〈V−I〉 > 0.5 mag | 1871 | 1168 |
| 4 | Microlensing fit better than constant line fit |  | 488 | 192 |
| 5 | Number of points at the peakb | Npeak > 5 | 478 | 184 |
| 6 | Microlensing fit better than SN fit | χ2SN > min (χ2, χ2μ4) | 302 | 126 |
| 7 | Peak within the data span (HJD 245 0000) | 2115 ≤t0≤ 4965 | 284 | 114 |
| 8 | Blended fit converged | 0 < fS < 1.2 | 88 | 41 |
| 9 | Conditions on goodness of microlensing fit (global and at the peak) |  and and  | 7 | 6 |
| 10 | Time-scale cut (d) | 1 ≤tE≤ 1000 | 5 | 5 |
| 11 | Impact parameter cut | 0 < u0≤ 1 | 4(2)c | 4(2)c |
| Cut number | Number of objects left | |||
| All Stars | Bright Stars | |||
| 0a | Selection of ‘good’ objects | N > 80, 〈I〉≤ 20.4 mag | 19 424 384 | |
| 0b | N > 80, 〈I〉≤ 18.8 mag | 5 782 733 | ||
| 1 | Significant bump over baseline | | 5529 | 4553 |
| 2 | SN1987a light echo filter | arcmin | 5413 | 4466 |
| 3 | ‘Bumper’ cuta | 〈I〉 > 18.5 mag, 〈V−I〉 > 0.5 mag | 1871 | 1168 |
| 4 | Microlensing fit better than constant line fit | | 488 | 192 |
| 5 | Number of points at the peakb | Npeak > 5 | 478 | 184 |
| 6 | Microlensing fit better than SN fit | χ2SN > min (χ2, χ2μ4) | 302 | 126 |
| 7 | Peak within the data span (HJD 245 0000) | 2115 ≤t0≤ 4965 | 284 | 114 |
| 8 | Blended fit converged | 0 < fS < 1.2 | 88 | 41 |
| 9 | Conditions on goodness of microlensing fit (global and at the peak) | and | 7 | 6 |
| 10 | Time-scale cut (d) | 1 ≤tE≤ 1000 | 5 | 5 |
| 11 | Impact parameter cut | 0 < u0≤ 1 | 4(2)c | 4(2)c |
aMagnitudes as in the field LMC100.1 (shifted according to the position of the centre of the red clump).
bIn the range of t0± 1tE.
cTwo events were rejected based on additional data from EROS and OGLE-II (see text).
Selection criteria for search for microlensing events in the OGLE-III LMC data and the number of objects left after each cut for the All Stars and Bright Stars samples.
| Cut number | Number of objects left | |||
| All Stars | Bright Stars | |||
| 0a | Selection of ‘good’ objects | N > 80, 〈I〉≤ 20.4 mag | 19 424 384 | |
| 0b | N > 80, 〈I〉≤ 18.8 mag | 5 782 733 | ||
| 1 | Significant bump over baseline | | 5529 | 4553 |
| 2 | SN1987a light echo filter | arcmin | 5413 | 4466 |
| 3 | ‘Bumper’ cuta | 〈I〉 > 18.5 mag, 〈V−I〉 > 0.5 mag | 1871 | 1168 |
| 4 | Microlensing fit better than constant line fit | | 488 | 192 |
| 5 | Number of points at the peakb | Npeak > 5 | 478 | 184 |
| 6 | Microlensing fit better than SN fit | χ2SN > min (χ2, χ2μ4) | 302 | 126 |
| 7 | Peak within the data span (HJD 245 0000) | 2115 ≤t0≤ 4965 | 284 | 114 |
| 8 | Blended fit converged | 0 < fS < 1.2 | 88 | 41 |
| 9 | Conditions on goodness of microlensing fit (global and at the peak) | and | 7 | 6 |
| 10 | Time-scale cut (d) | 1 ≤tE≤ 1000 | 5 | 5 |
| 11 | Impact parameter cut | 0 < u0≤ 1 | 4(2)c | 4(2)c |
aMagnitudes as in the field LMC100.1 (shifted according to the position of the centre of the red clump).
bIn the range of t0± 1tE.
cTwo events were rejected based on additional data from EROS and OGLE-II (see text).
From the entire LMC OGLE-III data base (about 35.5 million objects detected on a template), we selected 19.5 and 5.8 million objects in the All Stars and Bright Stars samples, respectively, which satisfied the condition to be a ‘good’ object (cut 0a and 0b, respectively). Light curves of these stars were then subject to check for a positive consistent deviation over some baseline (cut 1). We flagged a star as having a bump when its summary significance (defined after Sumi et al. 2006) over a peak was larger than 30. It limited the sample to 5529 objects (4553 in the Bright Stars sample) and included various types of outbursting variable stars like supernovae (SNe), novae and dwarf novae. Among these were also artefact symmetric bumps with duration of a couple of months caused by the moving light echo of the supernova SN1987a. All objects within the 15 arcmin radius from the SN1987a remnant (αJ2000 = 05:35:28.01, δJ2000=−69:16:11.6) were excluded in cut 2. This cut affected only parts of the eastern CCD chips of the field LMC168 and western chips of the field LMC175.
Next, we removed all bright and blue objects residing in the so-called ‘blue bumper’ region of the colour–magnitude diagram (CMD) (cut 3). These evasive variable stars are a well-known problem in the search for microlensing events (e.g. Alcock et al. 2000) as their light curves often exhibit brightening episodes similar to low-amplification microlensing events. However, most of them reveal their true nature with another bump occurring years after the first one, a feature which is extremely rare for genuine microlensing events (e.g. Skowron et al. 2009). Note that the number of potential ‘blue bumpers’ removed from the All Stars and Bright Stars samples differs. This is because in cut 3, before applying the colour–magnitude cut, all stars for which V-band photometry (hence the colour) was not available were removed.
In cut 4, we selected objects with a bump, described by a four-parameter microlensing fit, which was more significant than a constant line with its noise and scatter. It narrowed down our sample to only 488 (192) objects. Then, we requested there were at least six data points surrounding the peak in the range of 1 Einstein radius crossing time (cut 5).
Next, we compared the microlensing model fit with an SN model fit, approximated by a composition of two exponents (cut 6). In our data set, covering 40 deg2 over 8 years, we should expect to detect about 30 SNe (following e.g. Alcock et al. 2000), assuming a mean efficiency of SN detection of 20 per cent. A visual inspection of light curves of the objects surviving cuts 0–5 showed numerous SNe, often with the background galaxy clearly visible on the finding chart. Most of them were located away from the main bar of the LMC in the most sparse fields, where the internal LMC extinction does not reduce their visibility and the stellar density is low. Light curves removed in cut 6 were clearly asymmetrical and, apart from the obvious SNe, belonged to various kinds of outbursting variables, like novae or redder Be stars.
In the remaining cuts, we narrowed down our sample of candidates for microlensing events directly using derived parameters, like t0, tE, fS and u0 (cuts 7, 8, 10 and 11, respectively), and the goodness of fit (global and at the peak) (cut 9). As a result, the search pipeline returned the same four candidates for microlensing events in both the All Stars and Bright Stars samples.
One of these objects, LMC164.3.892 (αJ2000 = 5:26:33.88, δJ2000=−70:57:44.8), was cross-matched with a previously known microlensing event candidate EROS-LMC-1. That event was reported to have a second episode of brightening after nearly 5 years (Tisserand et al. 2007) and in our data it exhibited a third one after another 7 years. It was therefore rejected as not a genuine microlensing event.
Another object, LMC100.6.50890 (αJ2000=5:18:33.24, δJ2000=−69:11:09.5), had a long-term feature, resembling half of a long time-scale event with amplitude of 0.5 mag; however, when combined with available OGLE-II data, it turned out to be an asymmetric Be star.
This leaves us with only two candidates for microlensing events. They were dubbed OGLE-LMC-03 and OGLE-LMC-04, continuing the numbering of OGLE LMC events started with the findings in the OGLE-II data (Paper I).
We also visually inspected a few hundred light curves with high signal-to-noise ratios, not limited by the magnitude cut, and discovered two additional potential candidates, named OGLE-LMC-05 and OGLE-LMC-06. These did not pass through our main search pipeline due to the mean magnitude below the 20.4 mag threshold (OGLE-LMC-05) or an anomalous shape of the light curve (OGLE-LMC-06).
4 RESULTS
Among the 19 million objects from 40 deg2 of the LMC observed for 8 years by OGLE-III, we found two firm candidates for standard microlensing events present in the All Stars and Bright Stars samples. In addition, we discovered two more potential candidate events, which were not found by our automated search pipeline. One of them resembles a standard microlensing light curve, but was below our magnitude threshold, while the other is a candidate for a binary microlensing event.
Table 4 gathers all the information about these candidates, listing their coordinates, OGLE-III fields in which they were located, OGLE data base star identification number, baseline magnitudes in the I and V bands from a microlensing fit, and derived magnitude and colour of the lensed source (where possible).
Microlensing event candidates detected in the OGLE-III LMC data.
| Event name | RA (J2000.0) | Dec. (J2000.0) | Field | Data base (star id) | Baseline I (mag) | Baseline V (mag) | Source I (mag) | Source V−I (mag) |
| OGLE-LMC-03 | 5:07:03.63 | −71:17:06.3 | LMC122.1 | 15630 | 18.42 | 19.52 | 19.18 | 1.05 |
| (EWS: OGLE-2007-LMC-01) | ±0.01 | ±0.01 | ±0.10 | ±0.05 | ||||
| OGLE-LMC-04 | 5:25:39.58 | −70:19:49.7 | LMC163.6 | 89262 | 17.33 | 18.45 | 17.65 | – |
| ±0.01 | ±0.01 | ±0.02 | ||||||
| OGLE-LMC-05 | 5:24:49.11 | −67:50:04.8 | LMC159.5 | 26848 | 21.27 | 22.31 | 22.62 | 0.51 |
| ±0.03 | ±0.06 | ±0.13 | ±0.22 | |||||
| OGLE-LMC-06 | 5:19:47.80 | −70:46:26.6 | LMC105.4 | 25643 | 18.06 | 19.52 | – | – |
| (EROS2-LMC#15) | ±0.01 | ±0.01 |
Fig. 2 shows derived positions of the sources of all OGLE-III candidates for microlensing events on the CMD, with the locus of LMC stars based on the OGLE and HST data. Also plotted are the positions of two OGLE-II events from Paper I and events reported by MACHO, colour- and shape-coded to differentiate between SL candidates according to Mancini et al. (2004), the binary event MACHO-LMC-9, the thick-disc-lens candidates MACHO-LMC-5 (Kallivayalil et al. 2004) and MACHO-LMC-20 (Kallivayalil et al. 2006), and the remaining candidates.
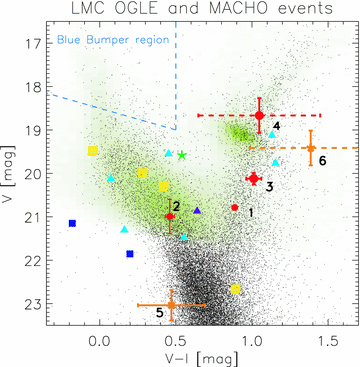
CMD with OGLE (green) and HST (black) stars of the central part of the LMC. Source positions of the OGLE-II events are marked with small red dots with numbers 1 and 2. OGLE-III events found with the automated pipeline are marked with big red dots with numbers 3 and 4, while the remaining two potential candidates (found visually) are marked in orange with numbers 5 and 6. The error bars for V−I shown with dashed lines are fixed to 0.4 mag and indicate that the colour of the source cannot be derived and is assumed to be equal to the colour of the baseline. MACHO events are marked as follows: binary event #9 (green star), candidates for SL (yellow squares), confirmed thick disc lenses #5 and #20 (dark blue filled squares) and remaining candidates (blue triangles). Event #7 which exhibited non-microlensing variations in the OGLE-III data is shown in violet.
Fig. 3 again presents all events ever detected towards the LMC from MACHO, OGLE-II and OGLE-III, overplotted on top of the density map of the red clump stars from the LMC.
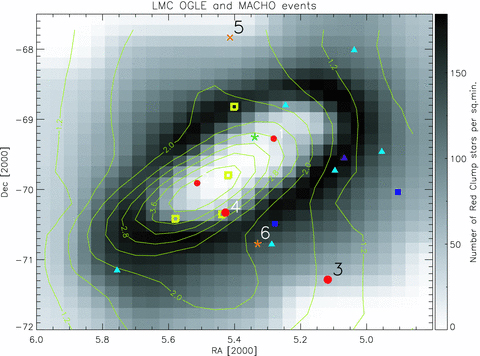
Map of the LMC with OGLE-II (1, 2), OGLE-III (3–6) and MACHO candidates for microlensing events. Colour coding of the events is the same as that in Fig. 2. The grey-scale background is based on the density of red clump stars. The contour shows the SL optical depth map from Mancini et al. (2004).
Light curves of the events are shown in Fig. 4, along with the best microlensing models obtained for the available I- and V-band OGLE data. Parameters of the standard Paczyński model fit for applicable events are gathered in Table 5. Models with seven parameters were performed on I and V data, where available. Five- and four-parameter models were fitted to the I-band data only, with the blending parameter as a free parameter and fixed to unity.
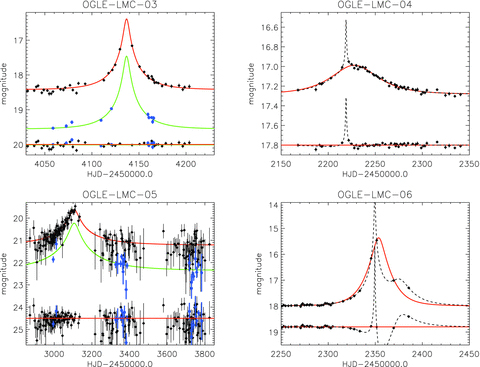
Light curves and microlensing models of candidates for microlensing events detected in the OGLE-III LMC data. The best-fitting standard model is shown with solid lines and the best-fitting binary source model is shown with dashed lines. Residuals for each model are shown at the bottom of each plot. The red curve and black dots show I-band data and the green curve and blue dots show V-band data, where available. The events OGLE-LMC-03 and OGLE-LMC-04 were found with the automated pipeline, whereas the remaining events were found by visual inspection of the data set.
Parameters of the standard Paczyński microlensing model fits to the OGLE-III events. Only events modelled with a standard microlensing model are shown.
| OGLE-LMC-03 | ||||||
| Parameter | Five-parameter fit | Four-parameter fit | Seven-parameter fit | |||
| t0 .…. | 4136.8 | ±0.1 | 4137.0 | ±0.1 | 4136.8 | ±0.1 |
| tE .…. | 34.97 | +4.29−3.84 | 24.65 | ±0.41 | 36.16 | +4.23−3.80 |
| u0 .…. | 0.089 72 | +0.038 24−0.035 08 | 0.226 81 | ±0.009 03 | 0.081 24 | +0.035 54−0.033 91 |
| I0 .…. | 18.423 | ±0.002 | 18.373 | ±0.002 | 18.423 | ±0.002 |
 | 0.514 | +0.117−0.908 | 1.0 | – | 0.486 | +0.104−0.082 |
| V0 .…. | – | – | – | – | 19.517 | ±0.006 |
 .…. .…. | – | – | – | – | 0.520 | +0.114−0.089 |
| χ2 .…. | 1114.1 | 1123.0 | 1309.3 | |||
 | 2.52 | 2.53 | 2.71 | |||
| OGLE-LMC-04 | ||||||
| Parameter | Five-parameter fit | Four-parameter fit | Seven-parameter fit | |||
| t0 .…. | 2227.9 | ±0.5 | 2227.9 | ±0.5 | – | |
| tE .…. | 32.76 | +9.12−12.57 | 29.26 | ±0.59 | – | |
| u0 .…. | 0.877 63 | +0.903 95−0.277 48 | 1.0440 | ±0.008 52 | – | |
| I0 .…. | 17.238 | ±0.001 | 17.238 | ±0.001 | – | |
 .…. .…. | 0.702 53 | +2.9765−0.345 58 | 1.0 | – | – | |
| V0 .…. | – | – | – | – | – | |
 .…. .…. | – | – | – | – | – | |
| χ2 .…. | 911.4 | 911.5 | – | |||
 | 1.56 | 1.56 | – | |||
| OGLE-LMC-05 | ||||||
| Parameter | Five-parameter fit | Four-parameter fit | Seven-parameter fit | |||
| t0 .…. | 3106.0 | ±3.9 | 3108.6 | ±4.1 | 3105.6 | ±3.8 |
| tE .…. | 224.1 | +198.1−86.1 | 135.6 | ±12.1 | 346.9 | +313.5−128.8 |
| u0 .…. | 0.120 14 | +0.118 78−0.065 249 | 0.248 46 | ±0.013 89 | 0.070 525 | +0.058 690−0.037 110 |
| I0 .…. | 21.25 | ±0.03 | 21.24 | ±0.03 | 21.27 | ±0.03 |
 .…. .…. | 0.436 64 | +0.514 32−0.242 85 | 1.0 | – | 0.251 26 | +0.226 15−0.132 85 |
| V0 .…. | – | – | – | – | 22.31 | ±0.06 |
 .…. .…. | – | – | – | – | 0.461 76 | +0.504 23−0.264 35 |
| χ2 .…. | 274.1 | 275.2 | 330.46 | |||
 | 0.673 | 0.674 | 0.749 | |||
| OGLE-LMC-03 | ||||||
| Parameter | Five-parameter fit | Four-parameter fit | Seven-parameter fit | |||
| t0 .…. | 4136.8 | ±0.1 | 4137.0 | ±0.1 | 4136.8 | ±0.1 |
| tE .…. | 34.97 | +4.29−3.84 | 24.65 | ±0.41 | 36.16 | +4.23−3.80 |
| u0 .…. | 0.089 72 | +0.038 24−0.035 08 | 0.226 81 | ±0.009 03 | 0.081 24 | +0.035 54−0.033 91 |
| I0 .…. | 18.423 | ±0.002 | 18.373 | ±0.002 | 18.423 | ±0.002 |
| 0.514 | +0.117−0.908 | 1.0 | – | 0.486 | +0.104−0.082 |
| V0 .…. | – | – | – | – | 19.517 | ±0.006 |
| .…. | – | – | – | – | 0.520 | +0.114−0.089 |
| χ2 .…. | 1114.1 | 1123.0 | 1309.3 | |||
| 2.52 | 2.53 | 2.71 | |||
| OGLE-LMC-04 | ||||||
| Parameter | Five-parameter fit | Four-parameter fit | Seven-parameter fit | |||
| t0 .…. | 2227.9 | ±0.5 | 2227.9 | ±0.5 | – | |
| tE .…. | 32.76 | +9.12−12.57 | 29.26 | ±0.59 | – | |
| u0 .…. | 0.877 63 | +0.903 95−0.277 48 | 1.0440 | ±0.008 52 | – | |
| I0 .…. | 17.238 | ±0.001 | 17.238 | ±0.001 | – | |
| .…. | 0.702 53 | +2.9765−0.345 58 | 1.0 | – | – | |
| V0 .…. | – | – | – | – | – | |
| .…. | – | – | – | – | – | |
| χ2 .…. | 911.4 | 911.5 | – | |||
| 1.56 | 1.56 | – | |||
| OGLE-LMC-05 | ||||||
| Parameter | Five-parameter fit | Four-parameter fit | Seven-parameter fit | |||
| t0 .…. | 3106.0 | ±3.9 | 3108.6 | ±4.1 | 3105.6 | ±3.8 |
| tE .…. | 224.1 | +198.1−86.1 | 135.6 | ±12.1 | 346.9 | +313.5−128.8 |
| u0 .…. | 0.120 14 | +0.118 78−0.065 249 | 0.248 46 | ±0.013 89 | 0.070 525 | +0.058 690−0.037 110 |
| I0 .…. | 21.25 | ±0.03 | 21.24 | ±0.03 | 21.27 | ±0.03 |
| .…. | 0.436 64 | +0.514 32−0.242 85 | 1.0 | – | 0.251 26 | +0.226 15−0.132 85 |
| V0 .…. | – | – | – | – | 22.31 | ±0.06 |
| .…. | – | – | – | – | 0.461 76 | +0.504 23−0.264 35 |
| χ2 .…. | 274.1 | 275.2 | 330.46 | |||
| 0.673 | 0.674 | 0.749 | |||
Parameters of the standard Paczyński microlensing model fits to the OGLE-III events. Only events modelled with a standard microlensing model are shown.
| OGLE-LMC-03 | ||||||
| Parameter | Five-parameter fit | Four-parameter fit | Seven-parameter fit | |||
| t0 .…. | 4136.8 | ±0.1 | 4137.0 | ±0.1 | 4136.8 | ±0.1 |
| tE .…. | 34.97 | +4.29−3.84 | 24.65 | ±0.41 | 36.16 | +4.23−3.80 |
| u0 .…. | 0.089 72 | +0.038 24−0.035 08 | 0.226 81 | ±0.009 03 | 0.081 24 | +0.035 54−0.033 91 |
| I0 .…. | 18.423 | ±0.002 | 18.373 | ±0.002 | 18.423 | ±0.002 |
| 0.514 | +0.117−0.908 | 1.0 | – | 0.486 | +0.104−0.082 |
| V0 .…. | – | – | – | – | 19.517 | ±0.006 |
| .…. | – | – | – | – | 0.520 | +0.114−0.089 |
| χ2 .…. | 1114.1 | 1123.0 | 1309.3 | |||
| 2.52 | 2.53 | 2.71 | |||
| OGLE-LMC-04 | ||||||
| Parameter | Five-parameter fit | Four-parameter fit | Seven-parameter fit | |||
| t0 .…. | 2227.9 | ±0.5 | 2227.9 | ±0.5 | – | |
| tE .…. | 32.76 | +9.12−12.57 | 29.26 | ±0.59 | – | |
| u0 .…. | 0.877 63 | +0.903 95−0.277 48 | 1.0440 | ±0.008 52 | – | |
| I0 .…. | 17.238 | ±0.001 | 17.238 | ±0.001 | – | |
| .…. | 0.702 53 | +2.9765−0.345 58 | 1.0 | – | – | |
| V0 .…. | – | – | – | – | – | |
| .…. | – | – | – | – | – | |
| χ2 .…. | 911.4 | 911.5 | – | |||
| 1.56 | 1.56 | – | |||
| OGLE-LMC-05 | ||||||
| Parameter | Five-parameter fit | Four-parameter fit | Seven-parameter fit | |||
| t0 .…. | 3106.0 | ±3.9 | 3108.6 | ±4.1 | 3105.6 | ±3.8 |
| tE .…. | 224.1 | +198.1−86.1 | 135.6 | ±12.1 | 346.9 | +313.5−128.8 |
| u0 .…. | 0.120 14 | +0.118 78−0.065 249 | 0.248 46 | ±0.013 89 | 0.070 525 | +0.058 690−0.037 110 |
| I0 .…. | 21.25 | ±0.03 | 21.24 | ±0.03 | 21.27 | ±0.03 |
| .…. | 0.436 64 | +0.514 32−0.242 85 | 1.0 | – | 0.251 26 | +0.226 15−0.132 85 |
| V0 .…. | – | – | – | – | 22.31 | ±0.06 |
| .…. | – | – | – | – | 0.461 76 | +0.504 23−0.264 35 |
| χ2 .…. | 274.1 | 275.2 | 330.46 | |||
| 0.673 | 0.674 | 0.749 | |||
Finding charts of the events are shown in Fig. 5 as cut-outs from OGLE-III template images.
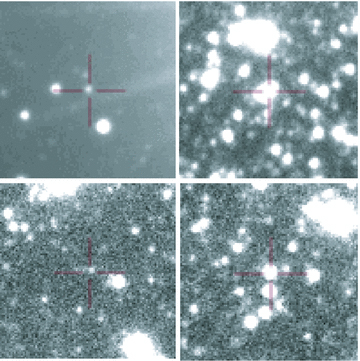
Finding charts of the four candidates for microlensing events. East is to the right, north is down. The side of each chart is 26 arcsec. Events 03 and 04 are shown on the top (from the left-hand to right-hand side, respectively), and events 05 and 06 are shown at the bottom. A cross marks the object on which the microlensing brightening was detected.
Fig. 6 shows the CMD with positions of the baselines of OGLE-III events and estimated locations of the lenses in these events. The lens locations were derived based on an assumption that the entire blending light belongs to the lens.

CMD as in Fig. 2 showing estimated positions of the lenses of the candidates for microlensing events found in the OGLE-III data towards the LMC. Open circles mark the positions of the blended objects as seen at the baseline of each event. The error bars for V−I of the lens shown with dashed lines indicate that the colour of the lens could not be determined and was taken from the blend/baseline.
Below we discuss each of the OGLE-III events.
4.1 OGLE-LMC-03
This event was the only event alerted by OGLE's Early Warning System towards the LMC and was designated as 2007-LMC-01.2
The baseline of this candidate exhibits some irregular variations. These are most likely caused by the presence of the very bright (6 mag, HD 33923) star (saturated on OGLE frames) less than 1 arcmin away. Otherwise, the baseline does not show any additional event-like phenomenon, supported by the MACHO and EROS observations since 1993. This makes a very strong case for the microlensing origin of this event.
A single-lens microlensing model fit to the data was performed using I- and V-band OGLE data, and its parameters are gathered in Table 4. The event's light curve along with the best-fitting model is shown in Fig. 4.
From the multiband fit, we were able to derive the source magnitude and colour of IS = 19.18 ± 0.10 mag and (V−I)S = 1.05 ± 0.05 mag. This places the source on the red giant branch of the CMD (Fig. 2), indicating the source intrinsically belongs to the LMC.
The field LMC122, in which OGLE-LMC-03 is located, is one of the sparsest according to its stellar density (see Table 1). At that density and magnitude level, there are about 9 per cent of stars blended with another one (see Section 5); therefore, we can safely assume that the entire remaining light in the blend constituting the baseline of the event comes from a single star – the lens. Another constraint comes from the astrometric measurements of the DIA residuals around the peak of the event. They clearly indicate a lack of any shift of the centroid during the microlensing magnification, which suggests that the additional flux sits exactly on top of the source star.
The blending parameters in both passbands obtained in the light-curve fitting indicate that the lens is very similar to the source in terms of the brightness and colour. Hence, the lens may also be an LMC red giant (Fig. 6).
4.2 OGLE-LMC-04
This relatively bright red star (17.3 mag) shows an event of small amplitude (∼0.5 mag) just at the beginning of the OGLE-III observations in 2001 November (the peak occurred on HJD = 245 2227.9). Its light curve is shown in Fig. 4.
There were no V-band OGLE data available during the course of the event, but 37 V-band data points after the event allowed a derivation of the colour of the blend. A standard microlensing model fit to the I-band data shown in Fig. 4 (solid line) is best described with a time-scale of tE = 32.76+9.12−12.57 d, a maximum amplification of A = 1.45 and the blending parameter  . Blending less than 1 indicates that there is an additional light present in the overall flux of the object. The source magnitude can be calculated from the model as IS = 17.65 ± 0.02 mag, but the colour can only be assumed to be equal to the blend's, that is, (V−I)S∼ 1.1. Even with these values and their uncertainties, the CMD location of the source can be linked to the LMC stars' locus at the red giant branch, just above the red clump (see Fig. 2). If all additional light within a blend comes from the lens (also hinted by that zero-shift of the light centroid), then its brightness can be calculated; however, because there were no V-band data during the event, we could not derive its colour. The estimated location of the lens in this scenario is shown in Fig. 6.
We note the large positive error on the blending parameter, which might indicate that the standard microlensing model is in fact not favoured for this event. Its relatively bright baseline and small amplification may also suggest that the brightness bump is caused by some kind of a variable star, for example, a ‘blue bumper’ blended with a red star to move its colour towards the red part of the CMD. Moreover, the light curve indicates some small asymmetry around the peak, which can be reproduced with a microlensed binary source (dashed line in Fig. 4) with the goodness of fit χ/Ndof = 1.52. However, that model has very little constraints and the ‘wiggle’ around the peak could be as well caused by instrumental inaccuracies. Further photometric observations of this star are necessary as ‘blue bumpers’ usually have secondary brightenings after a decade or so.
4.3 OGLE-LMC-05
This event was not detected in our regular search procedure described above, because its baseline magnitude (21.22 mag) was well below our threshold (20.4 mag). It was found when the search for events was conducted with the magnitude cut removed (see Table 3), which means it would pass through the pipeline if the magnitude cut was different.
The microlensing model fit to its I- and V-band light curves (shown in Fig. 4) yielded a time-scale of tE = 347 ± 178 d and u0 = 0.0705 ± 0.0447 with blending parameters of  and
and  . The goodness of fit to multiband data was χ2/d.o.f. = 0.749, whereas when only I-band data were used, it was χ2/d.o.f. = 0.676. The single-passband model returned a relatively long time-scale of tE = 224 ± 115 d with u0 = 0.1201 ± 0.0820 and
  .
.
From the blended multicolour models, we were able to estimate the magnitude and colour of the source as IS = 22.62 ± 0.13 mag and (V−I)S = 0.51 ± 0.22, which locates the source on the blue end of the main sequence of the LMC (see Fig. 2).
Severe blending indicates that there is a lot of additional light within the seeing disc of the object with the event. Judging from the sparse stellar density of the field LMC159 containing the event, we could assume all the remaining light belongs to the lens. Astrometry of the centroid from DIA indicates no shift compared to the baseline template position. This also supports the assumption that there is no additional light taking part in the event except the source and the lens. This places the lens at VL = 23.00 ± 0.40 mag and (V−I)L = 1.35 ± 0.43, which is far from the main LMC locus (see Fig. 6). Its CMD location in the vicinity of the two MACHO events caused by thick disc lenses suggests this could be another example of a Galactic lens towards the LMC. This, however, is relatively difficult to confirm with a follow-up using currently available instruments, given the very faint magnitudes of both the source and the lens, and large uncertainties of the event's parameters.
4.4 OGLE-LMC-06
This candidate was also not detected by the regular search pipeline, but was visually found in the data when inspecting largesignal-to-noise ratio light curves. Its light curve exhibits an asymmetric bump with amplitude of about 3 mag, but the peak is covered very sparsely by the OGLE observations. However, a single-lens model does not reproduce the light curve. The simplest static binary-source model is doing a much better job (see Fig. 4); however, due to an insufficient number of data points, we cannot exclude numerous possible binary-lens models here. The binary source model gave a time-scale of about 27 d and amplifications of 3 and 137 on each of the components with χ/Ndof = 1.51, compared to χ/Ndof = 3.55 for a standard single-source single-lens model.
The lack of a sensible model for the event prevents a derivation of the position of the lensed source on the CMD. The colour and magnitude of the blend (source and lens, plus any additional blending light), marked in Fig. 2, place it about 0.4 mag to the right-hand side of the red giant branch of the LMC. If this was the position of the source, then it would suggest it does not belong to the LMC and is either in the foreground (in the Milky Way halo) or in the background behind the LMC.
This candidate was already flagged by the EROS group (Tisserand et al. 2007) as anomalous. Their data also indicate a slight reddening during the brightening of the event. This could hint towards some kind of nova eruption; however, the light curve in its rising part is too smooth for a typical outburst-like object. Taking all these into account, we cannot firmly conclude on the nature of this event.
4.5 Historic events
For completeness, we checked the previously known microlensing event candidates if their OGLE-III counterparts were exhibiting additional variation atypical for microlensing events. It was not necessary for the OGLE-II events as their light curves collected during OGLE-III were already investigated in Paper I, where it was confirmed that they had constant baselines in years 2001–2009.
The MACHO group (Alcock et al. 2000) has reported 17 candidate events and all of them were located within the OGLE-III fields. We confirm the constant baseline behaviour during the OGLE-III phase in most of them, except MACHO-LMC-7 and MACHO-LMC-23. The secondary peak in the event MACHO-LMC-23 we see in our data occurred at JD ≈ 245 2250 and was already reported by Tisserand et al. (2007). This object was on our list of objects which were subject to cuts applied above, but its light curve was clearly asymmetrical and it was removed in cut 8 with its blended model not converging and with a large negative blending parameter.
The event MACHO-LMC-7 originally passed through improved selection criteria for MACHO events and was included in the optical depth determination of Bennett (2005). The OGLE-III light curve of this object reveals three small amplitude bumps separated by ∼2 years, all resembling a microlensing curve with time-scales between 20 and 40 d and amplitudes around 0.5 mag. It clearly indicates that this is not a genuine microlensing event, but some sort of a repeating outbursting variable star. It contributed about 10 per cent to the optical depth derived in Bennett (2005); therefore, their value should now be decreased to about τLMC≈ 0.9 × 10⁻⁷.
Among the events reported by the EROS group (Tisserand et al. 2007), we successfully cross-matched with the OGLE-III data only two candidates: EROS-LMC-1 and EROS-LMC-11. The latter showed a constant baseline over the course of the third phase of the OGLE project; however, the former exhibited a nice symmetric microlensing-like bump at JD ≈ 245 3410 and, as mentioned above, actually passed through our search pipeline. The EROS group has already reported on the second peak they detected in that event occurring nearly 5 years after the first one. The bump we detected happened after another 7 years, showing that the underlying contaminant population of mysterious bumpers towards the LMC can exhibit microlensing-like repeating episodes of brightening with random periodicity. The only possibility of ruling them out is to rely on as long time-baseline of observations as possible.
5 BLENDING
The Earth's atmosphere blurs stellar images. Astronomical images taken with medium- and large-sized telescopes are almost never diffraction limited, unless active and/or adaptive optics are used. The Earth's atmosphere prevents us from seeing much sharper and clearer images than we would otherwise see in its absence. Our atmosphere affects crowded stellar fields the most, such as the Magellanic Clouds, as many stars merge together into composite objects (‘blends’) that often can no longer be resolved by point spread function (PSF) fitting. Since the gravitational microlensing is equally likely to happen on any star in a blend, no matter if it is bright or faint, we would like to know how many stars contribute to one composite object, because in general the number of observed objects is not equal and usually less than the real number of monitored stars. This is of particular importance for the optical depth estimator, since at least three of its ingredients are directly affected by blending. The most obvious dependent quantity is the number of monitored stars. Without correction for blending, our estimate of the optical depth would be overestimated. Another directly dependent quantity from the optical depth estimator is the detection efficiency of microlensing events. Detecting a microlensing event on a bright source blended with fainter stars would yield almost 100 per cent detection efficiency. On the other hand, in the case where a faint microlensed star is blended with a much brighter star, the detection efficiency for such an event will be very small. Also the time-scale of an event is affected by blending and appears shorter with blending (see e.g. Woźniak & Paczyński 1997; Smith et al. 2007). It is critically important to understand the blending and its effects on the optical depth estimator.
The amount of blending can be estimated by comparing the ground-based images with much more detailed archival HST images and then grouping fields according to their stellar density and applying a fixed correction to the number of monitored stars for each density level. Such a method was applied in Papers I and II for the OGLE-II data. However, the area covered in a single HST image is tiny; hence, such a comparison results in very low number statistics of cross-matched stars. Moreover, OGLE-III fields cover a very wide spectrum of stellar densities, which is difficult to cover without an adequate number of archival HST images. Therefore, to address the issue of blending here, we performed simulations of the OGLE-III images based on combined stellar luminosity functions derived from the HST and OGLE images.
5.1 Simulations
Based on known properties of the OGLE-III images, such as the PSF size and shape as well as the shape of the underlying stellar luminosity function, we are able to simulate OGLE-III images with different stellar densities and luminosity functions. We used the LMC photometry from the HST Local Group Stellar Photometry Archive3 (Holtzman, Afonso & Dolphin 2006). Three selected HST fields, LMC_u4b115, LMC_u65008 and LMC_u65007, were each observed in the F555V (F814W) filter with the WFPC2 for 2000 s (2000 s), 2560 s (2460 s) and 1560 s (1560 s), respectively. These fields were calibrated to the standard I-band filter and were located in the OGLE fields LMC162.6 (dense), LMC119.2 (medium density) and LMC136.1 (sparse). Then, the OGLE and HST luminosity functions were combined with a stitching point around the red clump I-band magnitude, that is, I≈ 18.2 mag. Due to low number statistics for stars with I < 14 mag, we approximated the luminosity function with log(N) ∝ 0.4 ×I. Each of the luminosity functions had a slightly different shape, shown in Fig. 7, but, as shown later, this affects the CF for the number of monitored stars by less than 5 per cent.

Top panel: three combined HST and OGLE-III luminosity functions for the LMC used in the blending simulations. The top line (dashed) is for the field LMC162.6, the middle (solid) is for LMC119.2 and the bottom (dotted) is for LMC136.1. Bottom panel: example of the recovered luminosity function (dots) for the field LMC162.6, closely following the observed OGLE-III function (solid line).
Before each simulation, the basic parameters of the OGLE-III template image were measured. This included the PSF shapes and sizes, and the background level. First, we created a mock image (800 × 800 pixels) with the background light and Poisson noise that matched the original OGLE images. Next, we chose an HST stellar density as 200 ×i3/2 stars arcmin−2, where i is the simulation number ranging from i = 1 to 15. Then, we injected stars that were drawn from the combined luminosity function (top panel in Fig. 7) and were brighter than I≲ 24.8 mag. The faint end (I > 23.4 mag) of the luminosity function had a minimal impact on our study as our limiting search for microlensing events is I = 20.4 + 3.0 = 23.4 mag; the faint end simply serves as a background here. Here, I = 20.4 mag is the magnitude threshold for stars (blends) we allow in our search for microlensing events; hence, stars fainter by Δm = 3.0 mag are the faintest which can contribute to combined blended objects as sources for events.
Fig. 8 shows four examples of simulated OGLE images with different stellar densities. Once the image was created, we obtained the stellar photometry in a way identical to the OGLE-III treatment of the template images using the dophot photometry package (Schechter, Mateo & Saha 1993). Finally, we matched the input (simulated HST) and output (simulated OGLE) catalogues of stars. After some experimentation, we found the matching radius of r = 0.8 OGLE-III pixels for stars with I≥ 20.4 mag and  pixels, where G is a size of the Gaussian function at the level of I = 20.4 mag,
  , for stars with I < 20.4 mag and PSF size σ. The output catalogue was calibrated in such a way that magnitudes of recovered single (not blended) stars were nearly identical to those of the injected ones, but also the number of flux counts on a simulated image for a given magnitude was nearly identical to that of real images. Fig. 9 shows the difference between recovered and injected magnitudes as a function of the injected magnitude.
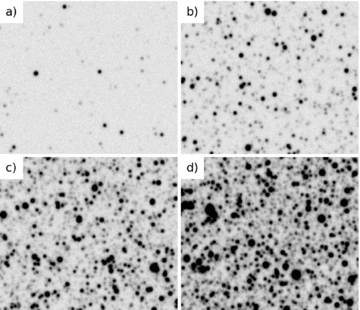
Simulated OGLE-III LMC images. The stellar density increases from panel (a) with log (N*/CCD chip) = 3.82 through panels (b) with log (N*/CCD chip) = 4.83 and (c) with log (N*/CCD chip) = 5.17 up to panel (d) with log (N*/CCD chip) = 5.32.
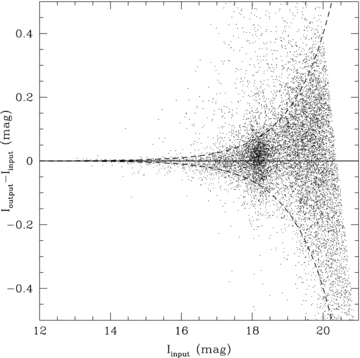
Difference between recovered (output) and injected (input) I-band magnitudes as a function of injected magnitude for a dense field with log(N*/CCD chip) ≈ 5.2. The two dashed lines show 2σ OGLE-III photometric uncertainties.
For each OGLE star of magnitude IOGLE within its radius r, we counted all HST stars with brightness of IHST≤IOGLE+ 3.0 mag. Then, we constructed distributions of blending, where the blending for each star is calculated as  . The blending distributions for selected simulated density levels are shown in Fig. 10.
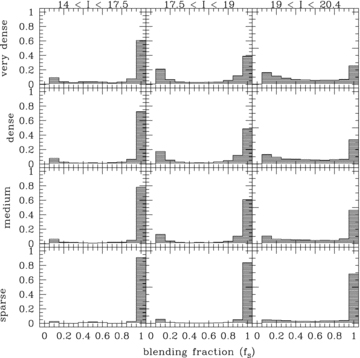
Blending distributions for selected levels of stellar density for the simulated OGLE-III images obtained using archival HST images. The distributions were derived in three magnitude bins, described at the top. The density levels shown correspond to stellar densities of log(N*/CCD chip) = 5.32, 5.24, 5.12 and 4.8 for very dense, dense, medium and sparse fields, respectively.
5.2 Estimating the real number of monitored stars
By comparing the number of input HST stars and resulting number of OGLE objects on simulated frames, we were able to obtain a CF. The CF converts from the number of observed stars in an OGLE-III CCD chip to the number of real stars hidden (unresolvable) due to blending, which may act as a source in a microlensing event. Figs 11 and 12 show the CF as a function of the number of observed stars in a single OGLE-III CCD chip. The plot in Fig. 12 indicates that the CF only weakly changes (by 5 per cent) when different shapes of the luminosity functions are used (see Fig. 7).
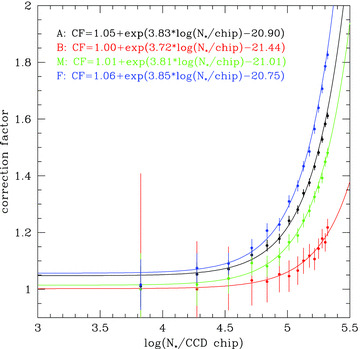
Correction factor as a function of the number of template objects on an OGLE-III CCD chip for different magnitude bins. The magnitude range I≤ 17.5 mag is described by function B (bright), 17.5 ≤I≤ 19.0 mag by function M (middle) and the 19.0 < I≤ 20.4 mag by function F (faint). The function based on the entire magnitude range I≤ 20.4 is marked as A (all).

Correction factor as a function of the number of template objects on an OGLE-III CCD chip for the entire magnitude range but for different areas of the LMC. Blue dots are for the field LMC162.6 (middle part of the LMC bar), red dots for LMC119.2 (edge of the LMC bar) and green dots for LMC136.1 (LMC's disc).
We derived the number of stars correction factor for three magnitude bins, corresponding to the bins in which the blending distributions were derived: bright I≤ 17.5 mag (B), middle 17.5 ≤I≤ 19.0 mag (M) and faint 19.0 < I≤ 20.4 mag (F). Then, for each OGLE template object brighter than 20.4 mag, we calculated the number of corresponding unresolved stars, using the CF for the given field's density, encoded in the number of all objects found on a template image (see Table 1). The resulting estimated number of real stars in each field (combined for all eight CCD chips) is provided in Table 1.
In total, there were around 19.4 million objects on the OGLE template images. These were estimated to be composed of about 22.7 million real stars, all of which could potentially be microlensed. In the Bright Stars sample, there were 5.8 million objects on the templates and 6.3 million estimated real stars.
6 OPTICAL DEPTH
Above we reported a detection of four candidates for microlensing events. However, in order to calculate the optical depth towards the LMC, we could only use events which were returned by our automated search pipeline, that is, events which satisfied well-specified criteria and were possible to describe with a point-source-point-lens microlensing model. These were OGLE-LMC-03 and OGLE-LMC-04. The remaining events were found manually and were either below the magnitude threshold (OGLE-LMC-05) or clearly not due to a single lens (OGLE-LMC-06).
The microlensing model of Paczyński (1996) gives an amplification A described with equation (4). The time-scale (Einstein radius crossing time) is the only parameter of the model which is related to some physical values, but is a degenerate function of the lens mass, distance and relative velocity.
The detection efficiency was derived separately for each field containing a microlensing event in the Monte Carlo simulations of the events covering the range of time-scales 1–1000 d. Fig. 13 shows exemplary curves of the efficiency for the All Stars and Bright Stars samples, and for dense and sparse fields. In these simulations, all microlensing model parameters, except tE, were randomly drawn from appropriate ranges: t0 from 245 2115 to 245 4965 d (the entire range of the OGLE-III LMC coverage), u0 from 0 to 1, I0 from the luminosity function of a given simulated field and fS from the blending distribution derived for that field (see Section 5 and Fig. 10).
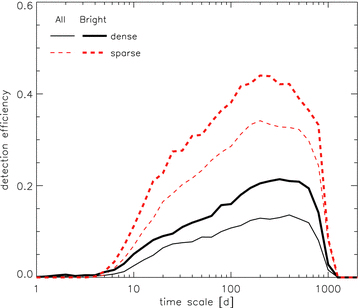
Microlensing event detection efficiency for OGLE-III LMC data for All Stars and Bright Stars samples. The efficiency strongly depends on the stellar density of the field. Curves are shown for dense (LMC163) and sparse (LMC122) fields.
The optical depth was then calculated for Nev = 2 events and their time-scales, with N* = 22 740 000 and Tobs = 2850 d. Following Tisserand et al. (2007) and Papers I and II, we applied a correction for binary events to which our automated search pipeline is not sensitive. It means all the efficiencies were reduced down by 10 per cent.
Table 6 gathers the values of time-scales and detection efficiencies used for deriving the optical depth. For both events, we found an optical depth of τ = (0.15 ± 0.10) × 10−7 and (0.16 ± 0.12) × 10−7 for binary-corrected efficiency.
The optical depth for the two OGLE-III events found by the automated search pipeline. The columns show event name, its time-scale, detection efficiency and individual events' contribution to the overall optical depth.
| Event | tE | ε(tE) | τi× 10−7 |
| Efficiency not corrected for binary events | |||
| OGLE-LMC-03 | 34.97+4.29−3.84 | 0.202 489 | 0.04 |
| OGLE-LMC-04 | 32.76+9.12−12.57 | 0.075 691 | 0.11 |
| Total τLMC-OIII | 0.15 ± 0.10 | ||
| Efficiency corrected for binary events | |||
| OGLE-LMC-03 | 34.97+4.29−3.84 | 0.182 240 | 0.05 |
| OGLE-LMC-04 | 32.76+9.12−12.57 | 0.068 122 | 0.11 |
| Total τLMC-OIII | 0.16 ± 0.12 | ||
If we allowed for non-single events contributing to the optical depth, hence included the candidate OGLE-LMC-06 with its time-scale of around tE = 27 d and estimated efficiency of ε(tE) = 0.182 767, it would add around 0.04 × 10⁻⁷ to the total value of τ. In the other scenario, we could also speculate that OGLE-LMC-04 is actually a ‘blue bumper’ and has to be excluded from the τ measurements. That would reduce the value of the optical depth to τ = (0.05 ± 0.05) × 10−7 or ∼0.08 × 10⁻⁷, if OGLE-LMC-06 were included as above.
In the Bright Stars sample, there were the same two events as in the All Stars sample. The efficiencies of their detection were about 1.4 times larger than efficiencies derived in the All Stars sample. On the other hand, the number of monitored stars was smaller by a factor of around 3. These two factors do not cancel out and the resulting optical depth for the Bright Stars sample is τ = (0.41 ± 0.29) × 10−7, which is around two times larger than for the All Stars sample. However, given the very low number of events and resulting large error bars on τ, comparison between these two values cannot lead to any meaningful conclusions.
7 DISCUSSION
The number of microlensing event candidates detected towards the LMC during the 8 years of the OGLE-III survey is remarkably small. The overall optical depth calculated using the two most reliable events is τLMC-OIII = (0.16 ± 0.12) × 10−7 and is smaller than obtained with two events found in the OGLE-II data [τLMC-OII = (0.43 ± 0.33) × 10−7, Paper I]. On the other hand, large systematic errors in both these measurements only prove that we are dealing with very low statistics in terms of the numbers of events. This is in clear contradiction to a significantly larger number of events claimed by the MACHO collaboration (Alcock et al. 2000; Bennett 2005), but is in agreement with results obtained with the EROS group data (Tisserand et al. 2007).
Can OGLE events still be caused by the hypothetical MACHOs? According to the halo model of Alcock et al. (2000) (model ‘S’), if the Galactic halo were entirely filled with DM compact objects, then it would produce the optical depth of τMACHO = 4.7 × 10⁻⁷. Because microlensing optical depth depends on the total mass of the lensing objects, the fraction of measured τ in τMACHO directly gives a fraction of halo mass in compact objects. Based on our measurement of the optical depth, if both microlensing events were due to MACHOs, then this fraction would be f = 3 ± 2 per cent, with a typical mass around 0.2 M⊙. This mass can be estimated from the mean time-scale of the events found using the formula log M = 2 log (〈tE〉/70) (Alcock et al. 2000; Tisserand et al. 2007). The derived mass fraction is considerably smaller than f = 20 per cent claimed by the MACHO group.
Because of the complexity of the microlensing events, in general, we are not able to definitively tell where the lenses and sources come from and what they are. This is only possible in the case of events exhibiting additional effects, for example, parallax or when the lens is a binary or, in some special cases, after detailed high-resolution imaging and spectroscopic follow-up. Therefore, in the case of our events, we can only speculate about the nature of the events; there are, however, certain hints towards a non-DM scenario.
Due to some line-of-sight depth of the LMC, it is possible that stars of the LMC get microlensed by other LMC stars located in front. The effect of SL was estimated based on the internal structure studies of the LMC by Mancini et al. (2004) and is the strongest for the LMC bar (see Fig. 3). Its contribution to the total optical depth is around τSL = 0.4 × 10⁻⁷ in the central parts of the LMC and around 0.1 × 10⁻⁷ when averaged over all OGLE-III fields.
The lenses should be dark in the case of MACHO lensing, whereas in SL, the lens can be any star from the LMC. Such a luminous lens can be indirectly ‘detected’ when a microlensing model indicates that some amount of light blended in with the source. For crowded fields such as those in the Magellanic Clouds observed with ground-based seeing, blending is a relatively common phenomenon. In Section 5, we tackled this issue with scrutiny and concluded that a single OGLE object is composed of about 1.2 real stars on average over the entire OGLE-III LMC coverage. For the fields containing two event candidates and for their respective magnitude range (Fig. 11), these factors are even smaller than average with 1.09 and 1.16 for the fields LMC122.1 and LMC163.6, respectively. It means that there is less than about 15 per cent chance that the blending detected in the microlensing model fit comes from random line-of-sight alignment of stars within a single seeing disc.
There is yet another tool we have at hand to confirm the last statement further. Photometry processing using the DIA method also provides a precise position of the lensed flux with respect to the centroid of light measured on the template. The accuracy of such a displacement measurement strongly depends on the magnitude at the peak and in the case of our events is at a level of 100 mas (lensed images of the source are usually separated by less than 1 mas; hence, only centroid shift can be measured with such accuracy). Because stars randomly blended together are usually displaced slightly from each other within the seeing disc, astrometric detection of a shift of the light barycentre provides an additional proof for ‘natural’ random blending. In the case of the two events presented here, there was clearly no shift visible in astrometry of the residuals on the DIA-subtracted images. Unless we are very ‘lucky’ and the blended star happens to be sitting exactly on the source of the event, this can be attributed to the fact that all the blending light comes from the lensing object. Hence, the lenses must be luminous. Their locations on the CMD, calculated from the blended microlensing model, indicate that they belong to the LMC star locus. This clearly hints towards the SL nature of the detected events.
The two events found manually are also difficult to attribute to MACHO lensing. OGLE-LMC-05 is likely to be caused by a very red lens, probably located in the Galactic disc. OGLE-LMC-06 is generally very puzzling, with its light curve resembling a binary lens/source event and its very red colour suggesting rather a variable star than a microlensing event.
It means we have no strong candidates for microlensing events caused by lenses from the halo. We can, however, put an upper limit on the MACHO presence in the halo, similarly to what was done by Tisserand et al. (2007) who detected no events in their bright star sample. In our case, however, we have two events that we associated with an origin other than MACHO lensing. This implies that we cannot straightforwardly apply zero-detection Poisson statistics, but should follow the suggestion of Moniez (2010), also applied in Paper II, and treat our SL candidate events as an expected background. This is an obvious estimate, as more detailed studies involving LMC modelling are necessary in order to obtain an exact amount of expected SL events over the entire OGLE-III LMC sky coverage. Such analysis is planned to be performed in a way similar to the OGLE-II LMC study in Calchi Novati et al. (2009).
Based on a mean detection efficiency over all fields, we were able to estimate the number of expected events due to MACHOs considering model ‘S’ of Alcock et al. (2000). This number was calculated for a wide range of MACHO masses from 10−8 to 102 M⊙ and was translated to a fraction of halo mass using the zero-statistics of Feldman & Cousins (1998). It is shown in Fig. 14. For masses around M = 0.4 M⊙, we expected Nexp = 69 events for a halo full of MACHOs; it translates to an upper limit of f < 7 per cent at 95 per cent confidence level and f < 6 per cent at 90 per cent confidence level. The limit reaches its minimum at around M = 0.1 M⊙ with f < 4 per cent and is less rigid on masses higher than 0.4 M⊙ reaching around 20 per cent at M = 10 M⊙ and more at higher masses.
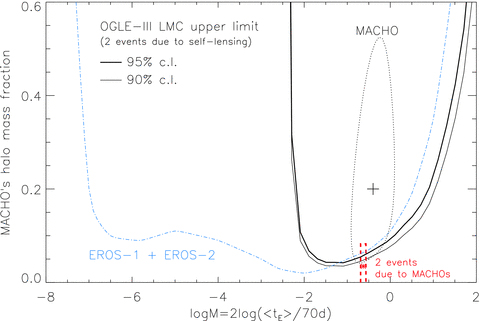
Fraction of the halo mass contained in the DM compact objects as derived from MACHO, EROS and OGLE-III data. The red rectangle indicates the value for the case when both OGLE-III LMC events were caused by MACHO lenses. Solid lines show upper limits for the case where there is no MACHO lensing event in the LMC OGLE-III data and both detected events are due to SL. The MACHO curve (dotted line) denotes signal from the compact objects (at 95 per cent confidence level), whereas the EROS curve (dot–dashed line) is an upper limit (at 95 per cent confidence level) on MACHO mass fraction in the halo.
Our result is in agreement not only with previous LMC microlensing findings (Tisserand et al. 2007), but also with studies of the microlensing effects of compact objects in distant galaxies observed in the lensed quasars (e.g. Mediavilla et al. 2009), which ruled out MACHOs in the mass range 0.1–10 M⊙. For the mass window 10–30 M⊙ our data give only moderate constraint (20–40 per cent). There is actually some hint for high-mass (around 10 M⊙) compact objects in the halo –Dong et al. (2007) studied the OGLE-2005-SMC-001 microlensing event and concluded that it was caused by a binary black hole most likely located in the halo. However, it still remains a mystery why we do not see such events towards the LMC; therefore, it is too early to conclude on DM compact objects existing in that mass window. OGLE-III SMC data, including that unique event, will be presented and studied in a forthcoming paper (Wyrzykowski et al., in preparation).
8 CONCLUSIONS
In this study, we analysed almost 8 years of observations of the LMC by OGLE-III. The data set with its volume, coverage and quality supersedes all previous determinations of the microlensing optical depth, including the one based on the OGLE-II data (Paper I). We detected two sound candidates for microlensing events and a further two possible candidates. Neither of them, however, is likely to be caused by DM compact lenses from the halo of our Galaxy. The two best candidates can be explained as an expected signal from the SL within the LMC. Of the remaining two, one is either a binary event or some kind of chromatic outburst, whereas the other is a candidate for a Galactic disc lens.
Such a null detection for MACHO lensing led to an estimate of the upper limit on their contribution to the mass of the halo of the Galaxy. The upper limit set at a level of 6–7 per cent at M = 0.4 M⊙ leaves very little room for DM compact objects. Still, at the moment, we cannot exclude more heavy DM lenses, like black holes. Our survey puts a 20 per cent halo mass fraction limit on compact objects with masses of M = 10 M⊙ and actually no limit on higher masses. This high-mass-end window should now be explored with more attention.
As a side product of our analysis, we also discovered that the event MACHO-LMC-7, reported by the MACHO group and used in their final optical depth determination, exhibited a couple of additional brightening episodes in the OGLE-III data, a feature which excludes it as a genuine microlensing event.
With the OGLE project now continuing in its fourth phase, we hope the sensitivity to extremely long events will improve significantly within next few years. It should result in an increase in the statistics of potential black hole lenses or allow us to rule out heavy DM compact objects as well and close that topic definitively.
We would like to thank Dr Nicholas Rattenbury, Dr Vasily Belokurov and Dr Patrick Tisserand for their help at various stages of this work. We also thank the anonymous referee for his/her invaluable comments and remarks. This work was partially supported by EC FR7 grant PERG04-GA-2008-234784 to ŁW. JS acknowledges support through the Polish MNiSW grant no. N20300832/0709 and the Space Exploration Research Fund of The Ohio State University. The OGLE project acknowledges funding received from the European Research Council under the European Community's Seventh Framework Programme (FP7/2007-2013), ERC grant agreement no. 246678.
REFERENCES
Author notes
Based on observations obtained with the 1.3-m Warsaw telescope at the Las Campanas Observatory of the Carnegie Institution of Washington.
