


Abstract
As a continuation of our previous studies in 2007 and 2008, new photometric observations of the T Tauri star TW Hya obtained by the MOST satellite and the All Sky Automated Survey (ASAS) project over 40 d in 2009 with temporal resolution of 0.2 d are presented. A wavelet analysis of the combined MOST–ASAS data provides a rich picture of coherent, intermittent, variable-period oscillations, similarly as discovered in the 2008 data. The periods (1.3–10 d) and systematic period shortening on time-scales of weeks can be interpreted within the model of magnetorotationally controlled accretion processes in the inner accretion disc around the star. Within this model and depending on the assumed visibility of plasma parcels causing the oscillations, the observed shortest oscillation period may indicate the stellar rotation period of 1.3 or 2.6 d, synchronized with the disc at 4.5 or 7.1 R⊙, respectively.
1 INTRODUCTION
The data gathered by the MOST satellite in 2007 and 2008 for TW Hya – a T Tauri type star of spectral type K7Ve and V∼ 11 mag surrounded by an accretion disc – were a subject of a Fourier and wavelet analysis by Rucinski et al. (2008). The most interesting discovery resulted from the wavelet analysis, which revealed oscillatory features systematically shortening their periods on time-scales of tenths of days. With typical periods of 2–9 d, a preliminary interpretation was through instability phenomena within the innermost accretion disc. In order to check whether such variations are a constant feature of the star, TW Hya was observed by the MOST satellite for the third (and most likely last) time in 2009 (Section 2). Additionally, simultaneous All Sky Automated Survey (ASAS) observations were obtained as close to the MOST observation in time as possible. In this paper we present an analysis of the new photometric data (Section 3) and propose a more physical interpretation of the features discovered in the wavelet spectrum (Section 4).
2 OBSERVATIONS AND DATA REDUCTION
The optical system of the MOST satellite consists of a Rumak–Maksutov f/6 15-cm reflecting telescope. The custom broad-band filter covers the spectral range of 380–700 nm with effective wavelength falling close to Johnson's V band. The pre-launch characteristics of the mission are described by Walker et al. (2003) and the initial post-launch performance by Matthews et al. (2004).
TW Hya was observed between 2009 March 3 and April 12, corresponding to the hjd range of 4894.53–4934.83.1 The data were collected during the low stray-light segment, lasting typically 30 min, of (almost) every third satellite orbit over 40.3 d. The direct-imaging mode of the satellite was used (Walker et al. 2003) with individual exposures of 30 s.
The data were reduced in the same way as described by Siwak et al. (2010). Small linear correlations between the stellar flux and the sky background level within individual orbits (most probably caused by a small photometric non-linearity of the electronic system) were also removed. In the last step the data were detrended by means of a low-order polynomial fitted to the light curve of a constant star, simultaneously observed with the main target. As a result, we obtained a very good quality light curve with median error of a single data point of about 0.009 mag. The systematic errors related to the uncertainty of the non-linearity corrections do not exceed 0.005 mag and are inconsequential for our investigation.
In parallel with the MOST observations, TW Hya was also monitored by the ASAS (Pojmanski 1997) in Johnson V filter with temporal sampling of about 10 min. Due to deterioration of the CCD chip used for V-band observations over the last years, the individual data points have rather low accuracy with a median error of 0.045 mag. The mean observed magnitude,  , was used for conversion of the ASAS data to normalized flux units. Similarly as in 2008 (Rucinski et al. 2008), the 2009 data show good correspondence between MOST and the ASAS V band. For comparison with the MOST observations, the ASAS V-band data points were averaged using the sampling rate of the MOST data of 0.211 42 d.
In Fig. 1 we present the original and the averaged data points of TW Hya obtained by the MOST satellite and ASAS in Johnson V filter in normalized flux units. The median error of the time-averaged MOST data in flux units is equal to 0.0066. The time-averaged ASAS V-band data have an order of magnitude worse accuracy of about 0.041 flux units. For both data sets, the errors include the genuine, time-averaged, short-time-scale physical variability of TW Hya observed within individual MOST orbits; thus, the rapid variability of the star was lost in the averaging process, similarly as in the previous analysis of the 2007 and 2008 data (Rucinski et al. 2008).
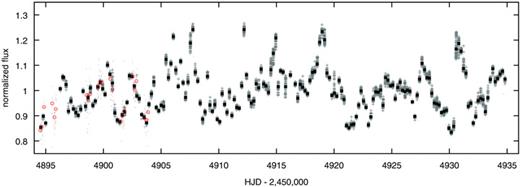
The 2009 light curve of TW Hya in flux units, scaled (separately for each source) to unity at the mean brightness level. The original MOST data are presented as crosses and their respective median-orbital values are shown as black squares. The ASAS observations obtained at hjd = 4894.5–4903.9 in the Johnson V filter with 10 min temporal resolution, expressed in flux units assuming mean magnitude  , are shown as small dots; their mean values, calculated for intervals of 0.2114 d, corresponding to the MOST data collection rate of three satellite orbits, are shown as circles. Note the good match between the MOST and ASAS data sets where they overlap during the first 9 d of the MOST observations.
3 ANALYSIS OF MOST 2009 DATA
3.1 Fourier transform
We performed a Fourier analysis of the 2009 data as in Rucinski et al. (2008) (see section 4.2 of that paper for details). The frequency spectrum was obtained using the light curve formed from the averaged MOST and ASAS V-band data, represented by squares and circles, respectively, in Fig. 1. The 0.2114-d sampling rate (3× the MOST orbit duration) precludes analysis of frequencies higher than 2.35 cycle d−1. In Fig. 2, we show only the frequency range below 1 cycle d−1 because there are no statistically significant peaks at higher frequencies. We note that Günther et al. (2010) did not find any subminute periodicities in their high-speed time-series photometry of TW Hya obtained with the Southern African Large Telescope (SALT).
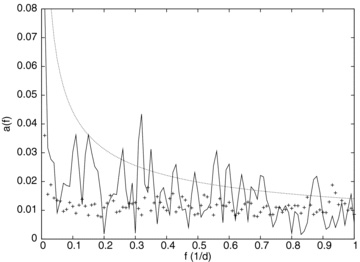
The frequency spectrum of TW Hya obtained from the combined, time-averaged 2009 MOST (185 points) and ASAS V filter (23 points) data. No statistically significant peaks are present above the frequency of 1 cycle d−1. The dotted line shows the arbitrarily scaled  dependence, while the crosses represent errors of amplitudes ai(f).
Because the temporal resolution of the 2009 data was three times poorer than that of the 2008 data, the amplitude errors are now larger than before, with median value of the error 0.012 of the mean flux. As observed before, the peak amplitudes a(f) seem to scale as flickering noise [ ], but due to the larger errors, this tendency is not as obvious as in the 2008 data (Rucinski et al. 2008).
3.2 Wavelet analysis
The original time distribution of averaged data points differs slightly from the uniformity required by the wavelet technique. Therefore, we interpolated the data into a uniform time grid using splines. Except for the orbital-averaged MOST data points, we also included the first five average ASAS points obtained in V band before and during the gap in the MOST data which occurred within hjd ≈ 4895–4896.5. The remaining ASAS points were not used because the ASAS data were significantly less accurate and were used here only to assure uniformity of the main MOST sequence for the wavelet analysis.
Fig. 3 shows the result of the wavelet transform of 191 data points uniformly distributed in time at the spacing of 0.2114 d. As in the case of the 2008 data, the Morlet-6 wavelet provided the best match between the time-integrated power spectrum and original frequency spectrum, as is visible in the right-hand panel of Fig. 3. We stress that only for the Morlet-6 wavelet do we obtain such a nearly perfect match of both plots; as described in Rucinski et al. (2008) Morlet transforms of other orders result in systematic differences in the period scale.
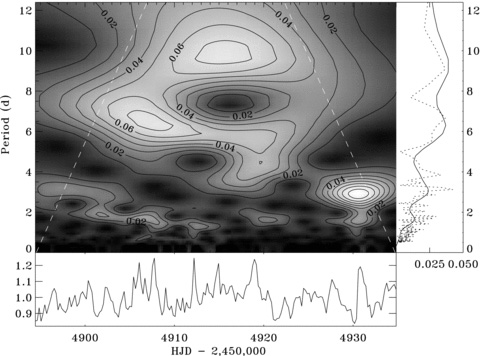
The wavelet transform of the 2009 TW Hya MOST data supplemented by the ASAS data, as explained in the text. The amplitude power of the transform is expressed by the grey-scale intensity plus contours with arbitrary units. Edge effects are present outside the white broken lines; they do not affect our conclusions. At the bottom, the combined MOST and ASAS V-band light curve, resampled into a uniformly distributed time grid with 0.2114 d spacing, is shown; at the right is given a comparison of the restored (via horizontal averaging) frequency spectrum (the continuous line) with the power spectrum corresponding to the amplitude spectrum in Fig. 2 (the dotted line).
4 DISCUSSION
The most important result of this study is that the general behaviour of the Morlet wavelet transform in the time–period plane is similar to that obtained and described by Rucinski et al. (2008) for the 2008 observing season. The systematically migrating oscillatory features that we saw in 2008 were not an unusual phenomenon limited to this particular point in time; apparently, TW Hya shows this phenomenon all or most of the time. The new 2009 data not only confirm the direct visibility of the features drifting to shorter periods, but this time we could identify as many as four of them. Their approximate moments of appearance and disappearance (in hjd), the periods P observed at the beginning and at the end of each oscillation packet and the respective Keplerian radii a1 calculated assuming M* = 0.72 M⊙ and R* = 1 R⊙ are presented in Table 1; they are ordered in their start periods. The data in Table 1 for features 1–3 were obtained by tracing local maxima along the patterns in Fig. 3; similarly we used fig. 8 of Rucinski et al. (2008) to trace feature 5* identified in the 2008 data. We did not investigate features 4 and 6*: the former had a long period of almost 10 d, so that the 2009 run was too short to fully follow its evolution while the latter feature (from the 2008 data) occurred too close to the end of that observing run.
Numerical values extracted from the wavelet spectrum and related physical parameters computed assuming that the features observed in the spectrum come from a Keplerian disc around the central star. The features marked with an asterisk (*) are for the data in Rucinski et al. (2008).
| Feature | hjd | P(d) |  | a1(R⊙) | a2(R⊙) |
| 1 – start | 4901 | 1.9 | 5.8 | 9.2 | |
| 1 – end | 4913 | 1.3 | −0.049(2) | 4.5 | 7.1 |
| 2 – start | 4898 | 3.1 | 8.0 | 12.7 | |
| 2 – end | 4922 | 1.6 | −0.065(1) | 5.2 | 8.2 |
| 3 – start | 4902 | 7.2 | 14.1 | 22.3 | |
| 3 – end | 4931 | 3.0 | −0.151(3) | 7.8 | 12.5 |
| 4 – start | 4914 | 9.8 | – | 17.3 | 27.4 |
| 5*– start | 4533 | 6.0 | 12.5 | 19.8 | |
| 5*– end | 4553 | 3.0 | −0.143(2) | 7.8 | 12.5 |
| 6*– start | 4556 | 7.5 | – | 14.5 | 22.9 |
| Feature | hjd | P(d) | | a1(R⊙) | a2(R⊙) |
| 1 – start | 4901 | 1.9 | 5.8 | 9.2 | |
| 1 – end | 4913 | 1.3 | −0.049(2) | 4.5 | 7.1 |
| 2 – start | 4898 | 3.1 | 8.0 | 12.7 | |
| 2 – end | 4922 | 1.6 | −0.065(1) | 5.2 | 8.2 |
| 3 – start | 4902 | 7.2 | 14.1 | 22.3 | |
| 3 – end | 4931 | 3.0 | −0.151(3) | 7.8 | 12.5 |
| 4 – start | 4914 | 9.8 | – | 17.3 | 27.4 |
| 5*– start | 4533 | 6.0 | 12.5 | 19.8 | |
| 5*– end | 4553 | 3.0 | −0.143(2) | 7.8 | 12.5 |
| 6*– start | 4556 | 7.5 | – | 14.5 | 22.9 |
Numerical values extracted from the wavelet spectrum and related physical parameters computed assuming that the features observed in the spectrum come from a Keplerian disc around the central star. The features marked with an asterisk (*) are for the data in Rucinski et al. (2008).
| Feature | hjd | P(d) | | a1(R⊙) | a2(R⊙) |
| 1 – start | 4901 | 1.9 | 5.8 | 9.2 | |
| 1 – end | 4913 | 1.3 | −0.049(2) | 4.5 | 7.1 |
| 2 – start | 4898 | 3.1 | 8.0 | 12.7 | |
| 2 – end | 4922 | 1.6 | −0.065(1) | 5.2 | 8.2 |
| 3 – start | 4902 | 7.2 | 14.1 | 22.3 | |
| 3 – end | 4931 | 3.0 | −0.151(3) | 7.8 | 12.5 |
| 4 – start | 4914 | 9.8 | – | 17.3 | 27.4 |
| 5*– start | 4533 | 6.0 | 12.5 | 19.8 | |
| 5*– end | 4553 | 3.0 | −0.143(2) | 7.8 | 12.5 |
| 6*– start | 4556 | 7.5 | – | 14.5 | 22.9 |
Within the accuracy of locating the local peaks, only the lowest order fits by straight lines (see Fig. 4) gave a sufficiently significant description of their temporal evolution described by their time derivatives  , as given in Table 1. The fits were weighted by their local peak intensities. We note that the rate of the period change appears to be faster for longer periods.
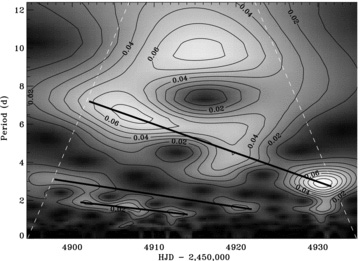
The linear fits (thick black lines) to the local maxima of features 1–3 visible in Fig. 3. Similar fits were made for the features observed in 2008 of which only feature 5* could provide sufficiently well-defined results.
In the most popular interpretation now, originally developed for accreting neutron stars by Ghosh, Lamb & Pethick (1977) and Ghosh & Lamb (1979a,b) and further applied to classical T Tau type stars (CTTS) (Königl 1991; Cameron & Campbell 1993; Hartmann, Hewett & Calvet 1994; Shu et al. 1994; Muzerolle, Calvet & Hartmann 1998, 2001), magnetic loops originating on the stellar surface connect to the accretion disc outside the corotation radius to avoid angular momentum transfer from the disc. The model of magnetically controlled accretion explains observations of many CTTS, e.g. AA Tau (Bouvier et al. 2007) and BP Tau (Donati et al. 2008), as well as some young brown dwarfs, e.g. 2MASSW J1207334−393254 in the TW Hya association (Scholz, Jayawardhana & Brandeker 2005).
As proposed before (Rucinski et al. 2008), we think that the observed light oscillations are produced in one or several regions in the inner accretion disc due to instabilities in the disc plasma. They may be caused by magnetic field threading of the disc near its inner edge via Kelvin–Helmholtz instability or by combined turbulent diffusion and reconnection. Ghosh & Lamb (1979a,b) found that such an interaction would produce a broad transition zone between the unperturbed Keplerian disc and the corotating magnetosphere outside which considerable departures from Keplerian motion are expected. Their theoretical expectation for the outer transition zone seems to be confirmed by Calvet et al. (2002) (their section 4.3), who found that at a distance of 1 au, gas in the TW Hya disc probably drifts slowly inward nearly following Keplerian orbits. In this picture, the oscillations observed by MOST may be explained by orbital motion of optically thick condensations produced by magnetic loop–disc interactions in the inner transition zone within more spatially confined regions, bright enough to produce the observed, large amplitudes of light variations. Once initiated at respective Keplerian radii a1 (see Table 1), they would then rapidly propagate towards the corotation and truncation radii, a property which could explain the high absolute values of  .
.
Although there may be doubts if the stellar rotation–disc revolution synchronization still operates in TW Hya (see below), one could this way estimate the period of rotation of the star. The shortest period observed in the MOST data (the feature 1 at the end of its evolution at hjd = 4913) is 1.3 ± 0.1 d; admittedly, this period is poorly defined at the 2.2σ significance level. This value is almost identical to the shortest period among many periods previously claimed for TW Hya of 1.28 d (Herbst & Koret 1988) (see section 2 of Rucinski et al. 2008 for a summary of this topic). Similar values (1.4 ± 0.1 and 1.55 ± 0.10 d) have been obtained by Alencar & Batalha (2002) in an analysis of veiling measurements, but the authors disregarded these values paying more attention to other detected periodicities, i.e. 2.9 and 4.5 d. However, as obtained by Wilner et al. (2000) from 7-mm Very Large Array (VLA) interferometric observations, the outer accretion disc is oriented almost face-on. This means – for the inner accretion disc being coplanar with its outer parts – that each hypothetical condensation causing observed light oscillations is seen twice during each orbital evolution. Then, the observed periods given in Table 1 would in fact represent half-values of the real orbital periods. Accordingly, we recalculated the Keplerian distances assuming doubled values of the observed periods, which are given as a2 in the last column of Table 1. In this scenario, the value of 2.6 ± 0.2 d rather than 1.3 ± 0.1 d, would correspond to the pure rotational period of the central star itself.
Several semidirect estimates of the inner disc radius are available from the literature: Weinberger et al. (2002), using spatially resolved HST and Keck infrared images and spectra, modelled assuming different dust grain sizes, obtained 10.7 ± 2.1 R⊙ for the inner disc radius. Eisner, Chiang & Hillenbrand (2006), using spatially resolved near K-band interferometric Keck observations and a model utilizing submicrometre-sized dust grains, obtained 12.9 ± 2.1 R⊙. Contrary to Weinberger et al. (2002), their second model with large dust grains gave a smaller radius of 4.3 ± 2.1 R⊙, but much poorer fit to all the data. We note that only if we assume the doubled orbital period do we obtain an inner disc radius of 7.1 ± 0.4 R⊙, which would be commensurate with these estimates (Table 1).
In spite of its conceptual appeal, the coupling between stellar and disc rotation offered by the magnetically controlled accretion model may no longer be valid for TW Hya. Although TW Hya possesses properties of a young (1–2 Myr old) CTTS, it is part of an evolved (≃12 ± 8 Myr old) TWA association, as obtained from lithium depletion estimates of Mentuch et al. (2008). The accretion disc itself also shows indications of being in advanced stages of dust evolution: as previously noted, Weinberger et al. (2002) and Calvet et al. (2002) needed large-size dust grains to fit the observed spectral energy distribution; the latter authors discovered also a developing gap in the disc at the distance of 4 au from the central star. From an analysis of several young stellar associations, Jayawardhana et al. (2006) found that accretion discs in T Tau type stars appear to cease before the age of about 10 Myr: among 32 members of the TWA association, only TW Hya and TWA 3A show signs of ongoing accretion and seem to be slow rotators. We note that the small value of v sin i = 10.6 km s−1 determined by the authors for TW Hya should not be taken to indicate a long rotational period of the star, but is rather a result of the low inclination angle of its rotation axis (Wilner et al. 2000).
Because of the pole-on geometry of TW Hya, Alencar & Batalha (2002) conclude that it is rather unlikely that the observed light variations are caused by rotation of hotspots on the star photosphere, especially in the case when magnetic poles seem to be aligned with the stellar rotation axis (see section 4 of their paper for a detailed explanation). These considerations may also apply to the theoretical prediction of regularities in the geometrical spot distribution as well as quasi-periodic light oscillations caused by hotspots on the stellar photosphere (Kulkarni & Romanova 2009; Romanova & Kulkarni 2009). Although the oscillations may have similar characteristics to light variations observed by MOST, a long rotational period of TW Hya (of the order of 10 d) would be required to be explained by such a mechanism. We note that neither the 2008 nor the 2009 MOST observations revealed any common long-period (8–15 d) wavelet-transform features for both runs, which could be attributed to rotational period of the star itself. Although this result may be caused by the limitation of a single MOST monitoring run to about 45 d, there are no indications of such a long rotational period in the Fourier spectrum of the long series of ASAS (Rucinski et al. 2008) observations.
5 CONCLUSIONS
The wavelet-transform analysis of the 2009 data obtained by the MOST satellite and the ASAS project confirms the essential findings of Rucinski et al. (2008): the general red-noise nature of the Fourier spectrum of TW Hya is rather complex in that it corresponds to several oscillation packets with their frequencies increasing in time and with larger amplitudes for lower frequencies. The respective orbital radii can be calculated assuming that periods of individual oscillation packets are related to Keplerian motion of optically thick plasma condensations in the inner accretion disc. The observed periods are consistent with their origins in the inner accretion disc, several stellar radii outside of the corotation and truncation radii. Noting the pole-on geometry of the accretion disc for TW Hya, consideration should be given to the possibility that the observed periods represent the respective halves of the true orbital periods. Assuming that we detected the shortest possible period in the Morlet wavelet transform of 1.3 d and that the inner boundary of the disc corotates with the star, the corotation radius for TW Hya would be about 4.5 ± 0.2 or 7.1 ± 0.4 R⊙ depending on the assumed period (1.3 ± 0.1 or 2.6 ± 0.2 d, respectively); only for the longer period the inner disc size is in accordance with the results of Weinberger et al. (2002) and Eisner et al. (2006), obtained from spatially resolved infrared images and interferometric observations. Determination of the rotational period of the star is crucially important both for the inner accretion disc considerations as well as for mechanisms investigated theoretically by Kulkarni & Romanova (2009) and Romanova & Kulkarni (2009) which could explain light variations through (possibly time-evolving) geometrical distribution of hotspots and/or quasi-periodic oscillations in this region.
Throughout this paper: hjd ≡ HJD − 245 0000.
MS acknowledges the Canadian Space Agency Post-Doctoral position grant to SMR within the framework of the Space Science Enhancement Programme and thanks Professor Ray Jayawardhana for advice and comments.
The Natural Sciences and Engineering Research Council of Canada supports the research of DBG, JMM, AFJM and SMR. Additional support for AFJM comes from FQRNT (Québec). RK is supported by the Canadian Space Agency and WWW is supported by the Austrian Space Agency and the Austrian Science Fund.
Special thanks are due to the referee, Dr W. Herbst, for very useful comments and suggestions.
REFERENCES
Author notes
Based on data from the MOST satellite, a Canadian Space Agency mission, jointly operated by Dynacon Inc., the University of Toronto Institute of Aerospace Studies, and the University of British Columbia, with the assistance of the University of Vienna, and from the All Sky Automated Survey (ASAS) (conducted by the Warsaw University Observatory, Poland) at the Las Campanas Observatory.
