


Abstract
Details of the processes through which galaxies convert their gas into stars need to be studied in order to obtain a complete picture of galaxy formation. One way to tackle these phenomena is to relate the H i gas and the stars in galaxies. Here, we present dynamical properties of damped and subdamped Lyman α (DLA) systems identified in Hα emission with VLT/SINFONI at near-infrared wavelengths. While the DLA towards Q0302 − 223 is found to be dispersion-dominated, the sub-DLA towards Q1009 − 0026 shows clear signatures of rotation. We use a proxy to circular velocity to estimate the mass of the halo in which the sub-DLA resides and find Mhalo= 1012.6 M⊙. We also derive dynamical masses of these objects, and find Mdyn= 1010.3 and 1010.9 M⊙. For one of the two systems (towards Q0302 − 223), we are able to derive a stellar mass of M*= 109.5 M⊙ from a spectral energy distribution fit. The gas fraction in this object is one-third, comparable to similar objects at these redshifts. Our work illustrates that detailed studies of quasar absorbers can offer entirely new insights into our knowledge of the interaction between stars and the interstellar gas in galaxies.
1 INTRODUCTION
Tremendous progress has been made over the last decade in establishing a broad cosmological framework in which galaxies and large-scale structure develop hierarchically over time, as a result of gravitational instabilities in the density field. The next challenge is to understand the physical processes of the formation of galaxies and structures and their interactions with the medium surrounding them. Of particular importance are the processes through which these galaxies accrete gas and subsequently form stars (Putman et al. 2009). The accretion of baryonic gas is complex. Recently, several teams (Birnboim & Dekel 2003; Keres et al. 2005) have realized that, in haloes with mass <1011.5 − 12 M⊙, baryonic accretion may not involve the traditional shock heating process of White & Rees (1978). Similarly, details of the processes through which galaxies convert their gas into stars are still poorly understood. But the observational evidences for accretion are scarce. A related signature is that the total amount of neutral gas in the Universe,  , is almost constant over most of the cosmic time (Péroux et al. 2005; Prochaska, Herbert-Fort & Wolfe 2005; Noterdaeme et al. 2009), unlike the history of the star formation rate which peaks around z = 1 (Hopkins & Beacom 2006 and references therein). This shows the importance of ongoing global gas accretion and the conversion of atomic gas to molecular gas in the star formation process (Hopkins, Rao & Turnshek 2005; Bauermeister, Blitz & Ma 2010).
One way to tackle these problems is to relate the H i gas and the stars in galaxies. While radio observations now provide detailed constraints on the H i content of a large sample of galaxies (Zwaan et al. 2005), they are still limited to the redshift z∼ 0. Conversely, the study of quasar absorbers, the galaxies probed by the absorption they produce in a background quasar spectrum, is insensitive to the redshift of the object (Wolfe et al. 1995). Indeed, the H i content of the strongest of these quasar absorbers, the so-called damped Lyman α systems (DLAs), have been measured in samples of several hundreds of objects from the Sloan Digital Sky Survey (SDSS). However, studying the stellar content of these systems has proven very challenging until now.
In Paper I of this series (Péroux et al. 2010), we reported the detection at infrared wavelengths of Hα emission of a DLA at zabs = 1.009 and one subdamped Lyman α system at zabs = 0.887 with  (Péroux et al. 2003). Here, we take advantage of 3D spectroscopy made possible by the SINFONI instrument on VLT to study the spatially resolved kinematics and therefore the dynamical state of these galaxies. In all the remaining, we assumed a cosmology with H0 = 71 km s−1 Mpc−1, ΩM = 0.27 and Ωλ = 0.73.
2 SINFONI DETECTIONS OF Hα EMISSION
The observations presented here were carried out at the European Southern Observatory with the near-infrared field spectrometer SINFONI (Eisenhauer et al. 2003) on Unit 4 of the Very Large Telescope. The first results with that instrument reported a high success rate in detecting metal absorption systems traced by Mg ii absorbers (Bouché et al. 2007a) at ∼1, while lower detection rates were found at higher redshifts z∼ 2 (Bouché et al., private communication). In Paper I, we have reported two secure detections of the redshifted Hα emission of high H i column density quasar absorbers: a DLA with  at zabs = 1.009 towards Q0302 − 223 and a sub-DLA with
  at zabs = 0.887 towards Q1009 − 0026 (see Table 1). We detect galaxies associated with the quasar absorbers at impact parameters of 25 and 39 kpc away from the quasar sightlines, respectively.
Summary of the properties of two absorber galaxies detected with SINFONI.
| Quasar | zabs |  (atoms cm−2) (atoms cm−2) | [Zn/H] | Impact parameter (kpc) | Δva (km s−1) | F(Hα) (erg s−1 cm−2) | Lum(Hα) (erg s−1) | SFRb[M⊙ yr−1] |
| Q0302 − 223 | 1.009 | 20.36+0.11−0.11 | −0.51 ± 0.12 | 25 | 1 | 7.7 ± 2.7 × 10⁻¹⁷ | 4.1 ± 1.4 × 1041 | 1.8 ± 0.6 |
| Q1009 − 0026 | 0.887 | 19.48 +0.05−0.06 | +0.25 ± 0.06 | 39 | 125 | 17.1 ± 6.0 × 10⁻¹⁷ | 6.6 ± 2.3 × 1041 | 2.9 ± 1.0 |
| Quasar | zabs | (atoms cm−2) | [Zn/H] | Impact parameter (kpc) | Δva (km s−1) | F(Hα) (erg s−1 cm−2) | Lum(Hα) (erg s−1) | SFRb[M⊙ yr−1] |
| Q0302 − 223 | 1.009 | 20.36+0.11−0.11 | −0.51 ± 0.12 | 25 | 1 | 7.7 ± 2.7 × 10⁻¹⁷ | 4.1 ± 1.4 × 1041 | 1.8 ± 0.6 |
| Q1009 − 0026 | 0.887 | 19.48 +0.05−0.06 | +0.25 ± 0.06 | 39 | 125 | 17.1 ± 6.0 × 10⁻¹⁷ | 6.6 ± 2.3 × 1041 | 2.9 ± 1.0 |
a Observed velocity shift between the zabs and zem of the detected galaxies.
b The SFR estimates are not corrected for dust extinction.
Summary of the properties of two absorber galaxies detected with SINFONI.
| Quasar | zabs | (atoms cm−2) | [Zn/H] | Impact parameter (kpc) | Δva (km s−1) | F(Hα) (erg s−1 cm−2) | Lum(Hα) (erg s−1) | SFRb[M⊙ yr−1] |
| Q0302 − 223 | 1.009 | 20.36+0.11−0.11 | −0.51 ± 0.12 | 25 | 1 | 7.7 ± 2.7 × 10⁻¹⁷ | 4.1 ± 1.4 × 1041 | 1.8 ± 0.6 |
| Q1009 − 0026 | 0.887 | 19.48 +0.05−0.06 | +0.25 ± 0.06 | 39 | 125 | 17.1 ± 6.0 × 10⁻¹⁷ | 6.6 ± 2.3 × 1041 | 2.9 ± 1.0 |
a Observed velocity shift between the zabs and zem of the detected galaxies.
b The SFR estimates are not corrected for dust extinction.
For field Q0302 − 223 where the quasar is bright enough, we have used the quasar itself as a natural guide star for adaptive optics in order to improve the spatial resolution (see Table 1). The two data sets have resulting point spread functions (PSFs) of 0.7 and 1.0 arcsec. Both the objects in our study have well-determined absorption line properties determined from the spectra of the background quasars. Thus, the metallicities are well determined for both of our target absorbers. An estimate of the emission metallicities is made based on the N ii/Hα parameter (Pettini & Pagel 2004): the galaxy with the smaller absorption line metallicity also has the smaller emission-line metallicity. The absorber towards Q0302 − 223 is the more gas-rich absorber, while that towards Q1009 − 0026 is the more metal-rich absorber. Using the Hα luminosity we then derived the star formation rate assuming the Kennicutt (1998) flux conversion corrected to a Chabrier (2003) initial mass function. We find low star formation rates (not corrected for dust extinction), of 1.8 ± 0.6 and 2.9 ± 1.0 M⊙ yr−1 (see Table 1). These values of star formation rates are among the lowest that have ever been possible to detect in quasar absorber searches with ground-based observations at z∼ 1 and 2.
3 KINEMATICS
In addition to the identification and redshift confirmation of the galaxy responsible for the quasar absorbers, the SINFONI data allow for a study of the dynamical properties of the galaxies. We extracted maps of the velocity-integrated line fluxes, relative velocities and velocity dispersion from the reduced data cubes using the following technique. For each pixel, we fitted the line profile to convolved Gaussian with a template of the instrument profile following e.g., Förster-Schreiber et al. (2006, 2009). Thus, the fitting takes into account the intrinsic emission line profile. In addition, weighted fits are performed using the MC resampling based on the spectral noise profile. A boxcar median smooth of size 2 × 2 pixels was applied prior to the line fitting. The velocity resolution is 150 km s−1 while the resulting accuracy of the centroid of the line can be derived to 0.1 of a pixel (29 km s−1). These maps are displayed in Fig. 1.
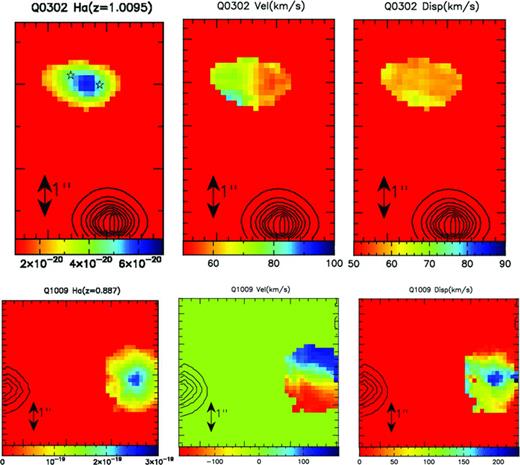
Hα flux map, Hα velocity field and Hα velocity dispersion maps of the two quasar absorbers. The colour scale indicates the flux in erg s−1 cm−2 in the Hα flux map on the left and the velocities or velocity dispersions in km s−1 for the middle and right set of panels. North is up and east is to the left. The thin-lined, black contours indicate the position of the quasar and the arrow represents 1 arcsec which corresponds to 8.1 kpc in the case of Q0302 − 223 and 7.8 kpc in the case of Q1009 − 0026. The system at the top (Q0302 − 223) is dispersion-dominated with Hα luminosity consistent with that of a disc. The system at the bottom (Q1009 − 0026) shows a blueshifted and a redshifted component of the gas on its velocity map. This pattern is a clear characteristic of a rotating disc.
Thanks to these maps, critical information on the dynamical state and properties of galaxies associated with quasar absorbers can be derived. The galaxy associated with the zabs = 1.009 DLA towards Q0302 − 223 shows little sign of rotation and significant amounts of dispersion. It has an axial ratio, corrected for PSF, of b/a = 0.47 corresponding to an inclination of sin i = 0.88. The maximum velocity extracted from the data cube is 2 Vmaxsin i = 20 km s−1, corresponding to an inclination-corrected maximum velocity of Vmax = 11 km s−1. Given that the velocity dispersion (corrected from instrumental effects) is 59 km s−1, the ratio v/σ in this object is 0.19 (see Table 2), much smaller than seen in local disc galaxies (v/σ = 10–20), and at high redshifts (Epinat et al. 2009; Cresci et al. 2009; Lemoine-Busserolle et al. 2010). This might indicate that this object is pressure supported, and early-type morphologies come to mind.
Kinematic properties and mass estimates of the two  absorbers detected (see text for details of the computations).
| Quasar | sin i | v/σ | r1/2 (arcsec) | ΣSFR (M⊙ yr−1 kpc−2) | Mdyn (M⊙) | Σgas (M⊙ pc−2) | Mgas (M⊙) | Mhalo (M⊙) | M* (M⊙) |
| Q0302 − 223a | 0.88 | 0.19 | 0.7 | 0.13 | 1010.3 | 101.9 | 109.1 | – | 109.5 |
| Q1009 − 0026 | 0.60 | 1.45 | 0.5 | 0.31 | 1010.9 | 102.2 | 109.2 | 1012.6 | – |
| Quasar | sin i | v/σ | r1/2 (arcsec) | ΣSFR (M⊙ yr−1 kpc−2) | Mdyn (M⊙) | Σgas (M⊙ pc−2) | Mgas (M⊙) | Mhalo (M⊙) | M* (M⊙) |
| Q0302 − 223a | 0.88 | 0.19 | 0.7 | 0.13 | 1010.3 | 101.9 | 109.1 | – | 109.5 |
| Q1009 − 0026 | 0.60 | 1.45 | 0.5 | 0.31 | 1010.9 | 102.2 | 109.2 | 1012.6 | – |
Note. The inclination is the main source of uncertainties and is estimated to be around 30 per cent.
a The higher-resolution HST/WFPC2 data from Le Brun et al. (1997) clearly shows that the object is subdivided into two subcomponents, consistent with the elongated shape seen in the SINFONI data presented here. In this table, however, the object is treated as only one.
Kinematic properties and mass estimates of the two absorbers detected (see text for details of the computations).
| Quasar | sin i | v/σ | r1/2 (arcsec) | ΣSFR (M⊙ yr−1 kpc−2) | Mdyn (M⊙) | Σgas (M⊙ pc−2) | Mgas (M⊙) | Mhalo (M⊙) | M* (M⊙) |
| Q0302 − 223a | 0.88 | 0.19 | 0.7 | 0.13 | 1010.3 | 101.9 | 109.1 | – | 109.5 |
| Q1009 − 0026 | 0.60 | 1.45 | 0.5 | 0.31 | 1010.9 | 102.2 | 109.2 | 1012.6 | – |
| Quasar | sin i | v/σ | r1/2 (arcsec) | ΣSFR (M⊙ yr−1 kpc−2) | Mdyn (M⊙) | Σgas (M⊙ pc−2) | Mgas (M⊙) | Mhalo (M⊙) | M* (M⊙) |
| Q0302 − 223a | 0.88 | 0.19 | 0.7 | 0.13 | 1010.3 | 101.9 | 109.1 | – | 109.5 |
| Q1009 − 0026 | 0.60 | 1.45 | 0.5 | 0.31 | 1010.9 | 102.2 | 109.2 | 1012.6 | – |
Note. The inclination is the main source of uncertainties and is estimated to be around 30 per cent.
a The higher-resolution HST/WFPC2 data from Le Brun et al. (1997) clearly shows that the object is subdivided into two subcomponents, consistent with the elongated shape seen in the SINFONI data presented here. In this table, however, the object is treated as only one.
However, the morphology of this object indicates that this galaxy might be a late-type object. The SINFONI data show that it is highly elongated. This is supported by the archival HST/WFPC2 images covering this field (Le Brun et al. 1997). In these data, two separate components can be seen but their redshifts cannot be estimated (see Paper I and the two stars in Fig. 1 which indicate the positions of the components). The two individual components are not resolved in the SINFONI observations and might explain the elongated shape or only one is seen but the detection of Hα emission at the position of the absorber provides secure identification. One interpretation is that we might be seeing a dispersion due to a small difference in redshift of two interacting galaxies. However, the Hα light profile appears to be exponential with a scalelength of 0.6 arcsec. Thus, the alternative explanation is that this galaxy is dispersion dominated, although it already has a discy morphology. This is indicative of a young flattened object, with effective radius (containing half of the light) of Re = 0.5 arcsec or 4 kpc, whose kinematics show that sustained rotation has not yet occurred. In other words, this object will have to contract further.
By contrast, the absorber towards Q1009 − 0026 has a morphology and kinematics consistent with that of a disc, with a normal dispersion profile (v/σ = 1.45) peaking at the centre σpeak = 190 km s−1 and flattening out in the outer parts σdisk = 60–70 km s−1 (see Table 2). This object is more face-on with an estimated inclination of sini = 0.60 derived from an axes ratio of b/a = 0.80. It shows clear signatures of rotation with systematic velocity gradients. Its v/σ is not typical of local disc galaxies which have v/σ = 10–20, but the systematic gradient still favours a spiral galaxy.
We also use the kinematic maps to estimate the size of the systems, correcting for the seeing in quadrature. These, in turn, are used to compute the area of the objects assuming that the inclined discs appear as ellipses. Using these estimates of the sizes of the detected galaxies, we compute their star formation rate surface densities (see Table 2) and find ΣSFR = 0.13 and 0.31 M⊙ yr−1 kpc−2 for absorbers towards Q0302 − 223 and Q1009 − 0026, respectively. It is interesting to note that these values are above the threshold at 0.1 M⊙ yr−1 kpc−2 where galactic winds are observed (Heckman 2002). In the log Σgas–log ΣSFR plot of Bouché et al. (2007b), our galaxies appear to be similar to the z∼ 1.5 colour-selected galaxies from the Gemini Deep Deep Survey (Abraham et al. 2004), i.e. at the lower end of the relation with respect to higher-redshift galaxies and submillimetre-selected systems. The results of these are shown in Table 2.
4 MASS ESTIMATES

5 SPECTRAL ENERGY DISTRIBUTION FIT
Stellar mass. In the case of the DLA towards Q0302 − 223, we use the broad-band magnitudes from HST/WFPC2 (Le Brun et al. 1997) and ground-based near-infrared observations (Chen & Lanzetta 2003) which cover the Balmer break of the object to constrain the age of the stellar population in the galaxy with a spectral energy distribution (SED) fit to the integrated light of the galaxies. We used the photometric-redshift code Le Phare (Ilbert et al. 2009), with a single burst of star formation, templates from Bruzual & Charlot (2003) stellar population models, a Calzetti extinction law and a Chabrier (2003) initial mass function. The spectroscopic redshift and star formation rate derived from our SINFONI spectra are used as an input to the code, thus allowing one to constrain the stellar mass of the object with relatively higher confidence. We deduce M* = 109.5 M⊙ for an object that would be about 2.5-Gyr old. An illustration of the template which best fit the observed magnitudes is provided in Fig. 2.
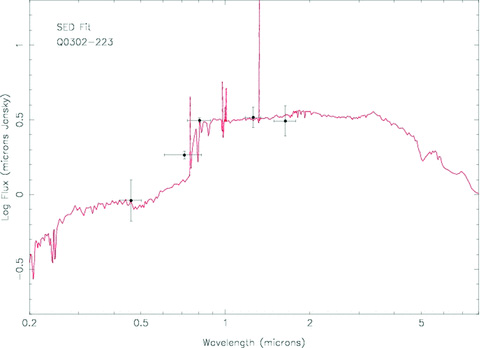
SED fit of emission line galaxy to the broad-band magnitudes from HST/WFPC2 (Le Brun et al. 1997) and ground-based near-infrared observations (Chen & Lanzetta 2003) based on ‘Le Phare’ photometric-redshift code (Ilbert et al. 2009). The spectroscopic redshift and star formation rate derived from our SINFONI spectra is used as an input to the code, thus allowing one to constrain the stellar mass of the object with relative high confidence, M* = 109.5 M⊙ and the age, about 2.5 Gyr.
6 COMPARISON WITH ABSORPTION PROPERTIES
What makes our targets unique in comparison with other galaxies at z∼ 1 observed with Integral Field Unit (e.g. Förster-Schreiber et al. 2009; Law et al. 2009) is the wealth of information about the absorption properties of the gas available from high-resolution Echelle spectroscopy (see also Kacprzak et al. 2010). This allows us to compare the distribution of velocities of the neutral gas (absorption) and the ionized gas (emission). In the case of the absorber towards Q0302 − 223, Pettini et al. (2000) have fit the absorption profile with two main groups of components, separated by Δv = 36 km s−1. They also indicate additional weaker components, at v = 35 and 121 km s−1 relative to zabs = 1.009, which are visible in the stronger Fe ii lines. In the case of the sub-DLA towards Q1009 − 0026, Meiring et al. (2006) have reported complicated velocity structure with seven components spanning Δv∼ 334 km s−1. This is considerably larger than the velocity dispersion measured at the position where it flattens out in the velocity map, σdisk = 60–70 km s−1. This may support previous claims that the width of the absorption systems cannot be solely explained by gravitational motions but by the presence of outflows (Bouché et al. 2007a).
7 CONCLUSION
In conclusion, the observational set-up of SINFONI has demonstrated the power of integral field spectroscopy for deriving a number of emission properties for quasar absorbers, a type of high-redshift galaxies that have been difficult to identify in the past. Detailed dynamical properties of these galaxies with known gas characteristics could be derived. These new tools are now available to systematically study these objects. We find that the two absorbers studied here have kinematical properties similar to other galaxies studied in the same way at these and others redshifts (Förster-Schreiber et al. 2006; Genzel et al. 2006; Epinat et al. 2009; Förster-Schreiber et al. 2009).
We find that the galaxy associated with the DLA identified towards Q0302 − 223 shows little signs of rotation and significant amounts of dispersions. Moreover, the light profile and morphology provide further evidence that this galaxy is dispersion dominated, although it already has a discy morphology. This is indicative of a young object which is confirmed by results from an SED fit or could be due to the blending of the two components detected with HST interacting together. On the contrary, the galaxy associated with the sub-DLA towards Q1009 − 0026 has a morphology and kinematics consistent with that of a disc, with a normal dispersion profile peaking at the centre and flattening out in the outer parts. This object shows clear signatures of rotation with systematic velocity gradients which is not typical of local disc galaxies, but the systematic gradient still favours a spiral galaxy. It remains to be understood why such high  column densities are found at large impact parameters (up to b = 39 kpc) from galaxies.
Overall, we conclude that of the two absorbers studied, the less metal-rich absorber towards Q0302 − 223 arises in a gas-rich system with Hα luminosity consistent with that of a disc, while the more metal-rich absorber towards Q1009 − 0026 arises in a lower gas mass system but with higher total mass showing clear signs of rotation. With the limitations of small number statistics, our findings are consistent with the suggestion (Khare et al. 2007; Kulkarni et al. 2007) that the metal-rich sub-DLAs may arise in more massive galaxies compared to the DLAs, which are usually metal-poor by comparison. Our work illustrates that detailed studies of quasar absorbers can offer entirely new insights into our knowledge of the interaction between stars and the interstellar gas in galaxies.
We would like to thank the Paranal and Garching staff at ESO for performing the observations in Service Mode, the instrument team for making a reliable instrument and Olivier Ilbert for performing the SED fit. VPK acknowledges partial support from the US National Science Foundation grants AST-0607739 and AST-0908890 (PI: Kulkarni). This work has benefited from support of the ‘Agence Nationale de la Recherche’ with reference ANR-08-BLAN-0316-01.
REFERENCES
Author notes
Based on observations collected during programmes ESO 80.A-0330 and 80.A-0742 at the European Southern Observatory with SINFONI on the 8.2-m YEPUN telescope operated at the Paranal Observatory, Chile.
