


Abstract
We present the discovery of the first T dwarf + white dwarf binary system LSPM 1459+0857 AB, confirmed through common proper motion and spectroscopy. The white dwarf is a high proper motion object from the LSPM catalogue that we confirm spectroscopically to be a relatively cool (Teff= 5535 ± 45 K) and magnetic (B∼ 2 MG) hydrogen-rich white dwarf, with an age of at least 4.8 Gyr. The T dwarf is a recent discovery from the UKIRT Infrared Deep Sky Survey (ULAS 1459+0857) and has a spectral type of T4.5 ± 0.5 and a distance in the range 43–69 pc. With an age constraint (inferred from the white dwarf) of >4.8 Gyr, we estimate Teff= 1200–1500 K and log g= 5.4–5.5 for ULAS 1459+0857, making it a benchmark T dwarf with well-constrained surface gravity. We also compare the T dwarf spectra with the latest LYON group atmospheric model predictions, which, despite some shortcomings, are in general agreement with the observed properties of ULAS 1459+0857. The separation of the binary components (16 500–26 500 au or 365 arcsec on the sky) is consistent with an evolved version of the more common brown dwarf + main-sequence (MS) binary systems now known, and although the system has a wide separation, it is shown to be statistically robust as a non-spurious association. The observed colours of the T dwarf show that it is relatively bright in the z band compared to other T dwarfs of similar type, and further investigation is warranted to explore the possibility that this could be a more generic indicator of older T dwarfs. Future observations of this binary system will provide even stronger constraints on the T dwarf properties, and additional systems will combine to give a more comprehensively robust test of the model atmospheres in this temperature regime.
1 INTRODUCTION
Large-scale near-infrared (NIR) and optical surveys, such as the Two-Micron All-Sky Survey (2MASS), the Sloan Digital Sky Survey (SDSS) and the UKIRT Infrared Deep Sky Survey (UKIDSS), are aiding the identification of a rapidly increasing number of ‘field’ brown dwarfs (BDs) (e.g. Lodieu et al. 2007; Pinfield et al. 2008; Burningham et al. 2009), as well as probing down into new cooler temperature regimes (Warren et al. 2007; Burningham et al. 2008; Delorme et al. 2008; Burningham et al. 2009; Leggett et al. 2009). In general, the estimation of properties of these BDs (e.g. age, mass, metallicity) currently relies on model fitting. However, the models are very sensitive to a variety of poorly understood processes in BD atmospheres, such as the formation of dust condensates (Allard et al. 2001) and non-equilibrium chemistry (Saumon et al. 2007) and the spectroscopic fitting of atmospheric properties (Teff, log g, [M/H]) is a major challenge. Crucially, the nature of BD evolution means that the mass–luminosity relation depends strongly on the age, and in the absence of well-constrained atmospheric properties, there is no way to accurately determine the mass and age.
Identifying objects, where one can pin down these properties independently, can help aid the calibration of models. BDs that are members of binaries, where the primary member has age constraints, are good sources of benchmark BDs (e.g. Day-Jones et al. 2008; Burningham et al. 2009; Faherty et al. 2009; Zhang et al. 2010). In particular, white dwarf (WD) primaries can provide a hard lower limit on the age of the system (from the WD cooling age) and in the case of high-mass WDs (where the MS progenitor star will have a short lifetime and the age will thus be essentially the same as the cooling age of the WD), they could provide ages constrained at the 10 per cent level (Pinfield et al. 2006 and reference therein).
Binary systems containing a WD and a BD however are observationally rare (Farihi, Becklin & Zuckerman 2005), and only a handful of such binaries have been identified. To date, there are only five L dwarf + WD systems that have been spectroscopically confirmed: GD 165B (L4; Zuckerman & Becklin 1992), GD 1400 (L6/7; Farihi & Christopher 2004; Dobbie et al. 2005), WD 0137−349 (L8; Maxted et al. 2006; Burleigh et al. 2006), PG 1234+482 (L0; Steele et al. 2007; Mullally et al. 2007) and PHL 5038B (L8; Steele et al. 2009), previously the latest type BD companion to a WD. There have also been several BD companions to WDs found as cataclysmic variables (CVs, e.g. Littlefair et al. 2008), although the nature of such objects means that they may be less useful in the context of studies of typical BD atmospheres.
We present here results from our ongoing search to identify widely separated BD companions to WDs, expanding on our earlier searches of the 2MASS and SuperCOSMOS (Day-Jones et al. 2008), to include the first results from our combined search of the UKIDSS and SuperCOSMOS. We present here the discovery of the first T dwarf + WD binary system, which we confirm through common proper motion and spectroscopy.
In Section 2, we describe the ongoing search to identify and spectroscopically confirm late T dwarfs in the UKIDSS Large Area Survey (LAS). In Section 3, we describe our proper motion measurements of these confirmed T dwarfs and our techniques to search for binary companions to these objects. In Section 4, we describe the spectroscopy of a WD candidate companion and the resulting constraints on its properties. In Section 5, we statistically assess the likelihood that our new T dwarf + WD binary system is spurious. Section 6 determines constraints for the atmospheric properties of the T dwarf, taking advantage of its benchmark age constraints (from the WD primary). We also perform some basic spectral model fits to the T dwarf spectrum and compare the resulting predictions. Finally, in Section 7, we conclude with further discussion of the system as a useful benchmark and comment on the direction of future work.
2 FINDING T DWARFS IN THE UKIDSS LARGE AREA SURVEY
The UKIDSS LAS has been searched for T dwarfs using selection techniques based on the observed UKIDSS+SDSS colours of previously identified T dwarfs, as well as theoretical predictions for the cooler Teff = 400–700 K regime. The selection techniques used to identify these T dwarfs are described in detail in Pinfield et al. (2008). In this paper, we consider T dwarfs that were spectroscopically confirmed (Burningham, private communication) by the Summer of 2008 (see Pinfield et al. 2008 and a subsample of Burningham et al. 2010) and the sky coverage appropriate to this sample includes the full LAS second data release, 72 per cent of the new sky in the third data release and 66 per cent of the new sky in the fourth data release. In total, this sample was identified in 890 deg2 of the LAS sky.
2.1 Follow-up photometry and spectroscopy
Candidates are followed up in general with additional imaging in the NIR and/or optical. This allows confirmation of the expected T-like colours and rules out various forms of contamination (e.g. faint M dwarfs with low signal-to-noise ratio (S/N) and blueward scattered NIR colours due to large photometric uncertainty, as well as Solar system objects that can appear as non-detections due to their motion). This follow-up has been performed using a variety of telescope/instruments, including the Wide Field Camera (WFCAM) and Fast Track Imager (UFTI) on the UKIRT and the Long-slit Intermediate Resolution Infrared Spectrograph (LIRIS) on the William Herschel Telescope (WHT) (all NIR), as well as the ESO Multi-Mode Instrument (EMMI) and the ESO Faint Object Spectrograph and Camera (EFOSC2) on the New Technology Telescope (optical). Spectroscopic confirmation of the LAS candidates was also achieved using a number of facilities, including the Near Infrared Camera and Spectrograph (NIRI) and the Gemini Near Infrared Spectrograph (GNIRS) on the Gemini telescopes, and the Infrared Camera Spectrograph (IRCS) on Subaru. The Near Infrared Camera Spectrograph (NICS) on the Telescopio Nazionale Galileo (TNG) and the UKIRT imager Spectrograph (UIST) were also used for the brighter T dwarfs. Details of the follow-up imaging and spectroscopic strategies, as well as the relevant reduction and calibration techniques used, are further discussed in Lodieu et al. (2007), Pinfield et al. (2008) and Burningham et al. (2010). Corresponding spectral types were derived using the unified T dwarf classification scheme of Burgasser et al. (2006) with an extension from Burningham et al. (2008) for the latest types.
2.2 T dwarf distances
T dwarf distances have been estimated using the absolute magnitude–spectral type relations from Liu et al. (2006), assuming that the T dwarfs are single objects. We calculated absolute magnitude (MJ), choosing the J-band magnitude over the H and K bands, as models have suggested that the J band may be less sensitive to variations in metallicity and gravity than the H and K bands (e.g. Marley et al. 2002). The uncertainties in the distance were obtained by taking into account the error in the spectral type (typically ±0.5) and the residuals of the polynomial fits from Liu et al. (2006). Fig. 1 shows the spectral type distance distribution for the spectroscopically confirmed sample of 49 T dwarfs that we consider in this work. It can be seen that the sample spans the spectral type and distance range of T2–9 and 12–80 pc, respectively. This is comprised of two T2–3 dwarfs, 29 in the T4–6 range, 16 T6–8 dwarfs and two T8+ dwarfs. Due to the cooler temperatures and thus fainter nature of later T dwarfs, it can be seen that we are more sensitive to earlier T dwarfs out to farther distances.
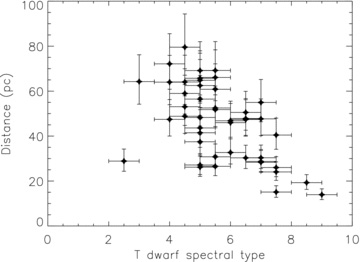
T dwarf distance versus spectral type for our spectroscopically confirmed T dwarfs with second epoch imaging.
3 T DWARF PROPER MOTIONS
The photometric follow-up programme provided second epoch imaging for the LAS T dwarfs, which we combined with the LAS images to give two epochs to calculate proper motion. We used the iraf routines geomap and geoxytran to derive a geometric transformation between the two epoch images and to apply these transforms to the T dwarf positions, respectively. Centroiding uncertainties were calculated based on simulated data with appropriate Poisson noise injected. The availability and quality of the measured proper motions of the T dwarfs are dependent on several factors, including the baseline between the epochs, the number of stars that can be used for positional reference in each of the images, the S/N of both the T dwarf and the reference stars, and the proximity of the T dwarfs to the edge of the WFCAM detector array (in the first epoch images). We were only able to measure the proper motions of 19 T dwarfs from the 49 strong sample of spectroscopic confirmations that we consider, using an average of 12 reference stars across a baseline of 0.5–1.5 Gyr. A vector-point diagram of the T dwarf proper motions is shown in Fig. 2, where two T dwarfs found to have common proper motion companions (see Section 3.1) are highlighted.
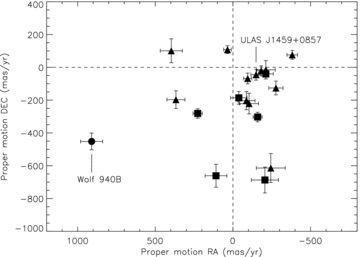
A vector point diagram showing the proper motions of our spectroscopically confirmed T dwarfs with good proper motion estimates (see Section 3). Shown are the different spectral types T4–6, T7–8 and T8+ as squares, triangles and circles, respectively. ULAS J1459+0857 and Wolf 940B are also highlighted.
3.1 A search for common proper motion companions
We searched for candidate common proper motion companions to our sample of T dwarfs with reliable proper motions, by selecting a magnitude-limited sample of SuperCOSMOS sources, where R < 21 (the magnitude limit at which proper motions are measured) and have accurately measured proper motions, such that PM/σPM≥ 3. We searched around each of the 19 T dwarfs out to an angular separation corresponding to 20 000 au, at the estimated minimum distance of each T dwarf. We choose a separation limit of 20 000 au in order to be sensitive to the detection of both widely separated MS and WD companions. It is fairly common to find BD + MS star binaries with separations of ∼5000 au (Gizis et al. 2001; Pinfield et al. 2006). However, a WD companion could have even wider separations, when one considers any outward migration that would have occurred during the post-MS mass-loss phase. We suggest that the outward migration would likely be a factor of ∼4, as the initial and final separation of a low-mass binary companion is directly related to the change in mass of the host star, that is, MMS/MWD (Jeans 1924; Zuckerman & Becklin 1987). To illustrate this, we consider a WD of mass ∼0.65 M⊙ (roughly the mean of the WD mass distribution). The progenitor mass would be ∼2.7 M⊙ (from the initial–final mass relations of Dobbie et al. 2006; Catalán et al. 2008; Kalirai et al. 2008), such that MMS/MWD∼ 4. Thus, for BD + MS binaries separated by 5000 au, we could expect their final separation to be up to ∼20 000 au.
For each common proper motion companion candidate, we assumed a distance that was the same as the estimated distance of the relevant T dwarf, and thus placed companion candidates on an absolute B magnitude (MB) versus B−R colour–magnitude diagram. Their positions were compared with those expected for MS stars and WDs, following the approaches described in Clarke et al. (2009) and Day-Jones et al. (2008), respectively. We then compared their SDSS colours with respect to stellar populations, including MS stars (Hipparcos; Perryman et al. 1997), M dwarfs (West et al. 2004), K subdwarfs (Yong & Lambert 2003) and WDs (McCook & Sion 1999; Eisenstein et al. 2006). We found that only one MS companion candidate was identified, Wolf 940, which had previously been identified serendipitously by Burningham et al. (2009) and will not be discussed further. We also identified five candidate WD companions to the T dwarfs in our sample that are common proper motion (to within the uncertainties) and are consistent with the WD sequence (see Figs 3 and 4), if assumed to be at the same distance as their T dwarf companions.
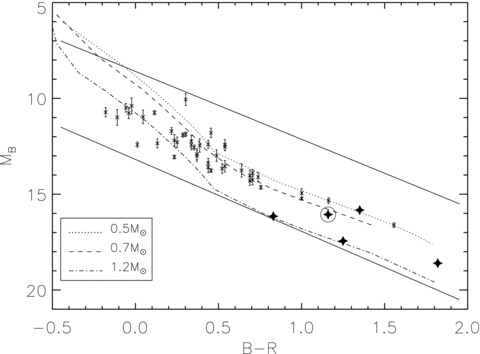
A colour–magnitude diagram of WDs from McCook & Sion (1999) with known parallax (crosses). Photometry is on the SuperCOSMOS system. Overplotted are model cooling tracks (see main text) for WD masses of 0.5, 0.7 and 1.2 M⊙ (dotted, dashed and dot–dashed lines, respectively). Also overplotted is our WD selection region (two solid lines), along with our candidate WD companions (large stars). LSPM J1459+0851 is circled for reference.
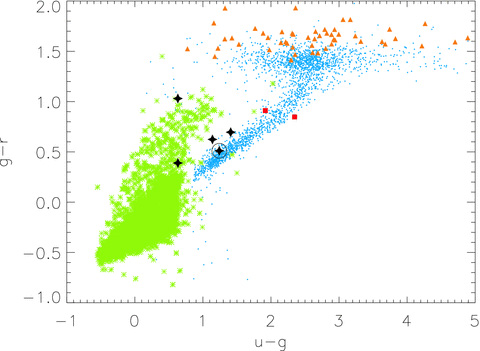
A two-colour diagram in SDSS colours showing populations of MS stars (blue points), M dwarfs (orange triangles), WDs (green asterisks) and K subgiants (red squares), with our WD candidates overplotted as black stars. LSPM J1459+0851 is circled for reference.
The brightest of our WD candidates appears in the LSPM catalogue (LSPM J1459+0851, Lépine & Shara 2005) as a high proper motion object, although it has not been previously studied spectroscopically. The T dwarf associated with this object is ULAS J1459+0857, which has been spectroscopically typed as a T4.5 ± 0.5 dwarf (Burningham et al. 2010). This pair is highlighted in Figs 3 and 4.
3.2 Possible contamination
To assess the possibility that our candidate WD companions may be dominated by high-velocity background objects, such as metal-poor, halo K subdwarfs (which could populate the same colour and proper motion space that we search in this work), we have derived space motion estimates, assuming that our candidates are K subdwarfs. We used the relations of Ivezić et al. (2008) to estimate an absolute r′ magnitude ( ) from g′−i′ colour, for a metallicity range (for subdwarfs) of −0.5 and −2.5, and thus obtained distance constraints applicable, if these objects are subdwarfs. Assuming, for simplicity, that they have a zero radial velocity, we then estimated space motions to assess potential halo membership. All except one candidate would have space motions of 2000–12 000 km s−1, which are thus not consistent with a Galactic halo population. The exception is close enough, such that its kinematics are consistent with a background subdwarf member. Indeed, this is one of the widest separated candidates (400 arcsec), and the level of background contamination for such separation (and volume) approaches 1, even for the low-density halo luminosity function (Gould 2003). However, despite one possible halo contaminant, the majority of the candidates cannot be explained by such contamination.
A more likely source of error potentially leading to misidentification amongst the candidates is a proper motion uncertainty, since the ratio of proper motion to proper motion uncertainty for some of the candidates is in the 3–5 range, and one would thus expect that some fraction of the sample have proper motions that have scattered to large values. Given this likely source of contamination, we choose not to present details of all five of our companion candidates at this stage. We prefer to first establish their nature through spectroscopic study, and in that way, confirm them (or otherwise) as genuine WD companions. We have so far only obtained good spectroscopy for both components of the binary containing LSPM J1459+0851 and thus focus the remainder of the paper on this system.
4 SPECTROSCOPIC OBSERVATIONS OF LSPM J1459+0851
Spectroscopic observations of LSPM J1459+0851 were obtained with FORS2 on the Very Large Telescope on 2009 May 15 and 21, with Directors Discretionary Time in program 282.C-5069(A). We used the long-slit mode in the optical wavelength range 3300–8000 Å with a dispersion of 50 and 55 Å mm−1, respectively, for the ranges 3300–6210 Å (corresponding to the B grism) and 5120–8450 Å (corresponding to the RI grism), giving a resolution of R∼ 1200. Three integrations of 600 s were taken, giving a total exposure time of 30 min for the B grism and two integrations of 360s, totaling to 12 min in the RI grism. Sky flats, arc frames and the spectra of a featureless (DC) WD as well as a standard F-type star and a hydrogen-rich (DA) WD were taken during the same night at a similar airmass to the target so as to provide wavelength, flux and telluric calibrations.
Standard iraf routines were used to reduce the spectra, including flat-fielding and cosmic-ray removal. The spectra were extracted with apall, using a Chebyshev function to fit the background and a third-order Legendre function to trace the fit to the spectrum. The wavelength calibration was done using the spectrum from HgCdHeAr and HgCdHeNeAr arc lamps for the B and RI grisms, respectively, and using identify to reference the arc lines, along with the dispcor routine to correct the dispersion of the spectrum. The resulting spectra of both LSPM J1459+0851 and the standard were divided by the smooth spectrum of the DC WD, which has no intrinsic spectral features, enabling correction for the instrumental response. The standard stars (one for each grism) were then used to flux calibrate the spectrum. The two spectra were then stitched together in the overlapping sections and normalized at 6000 Å. The final spectrum of LSPM J1459+0851 is shown in Fig. 5.
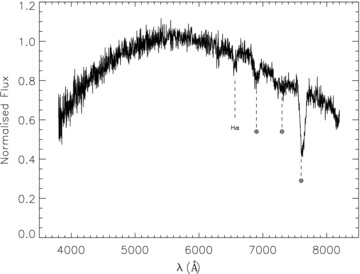
The optical spectra of LSPM J1459+0851, normalized at 6000 Å.
It can be seen that some residual tellurics remain and are highlighted for reference. They do not, however, affect the subsequent analysis in any way, since they do not overlap with features used directly to assess WD properties. The general spectral shape is quite blackbody-like, consistent with a WD or perhaps a very metal poor subdwarf (e.g. Jao et al. 2008). However, the overall strength of the Hα line and the peak of the blackbody-like continuum are only consistent with a relatively cool example of a WD (Kilic et al. 2006). We also compare LSPM J1459+0851 to the spectra of three other very cool, DA WDs, WD 0011−134, WD 1330+015 and WD 0503−174, taken from Bergeron, Ruiz & Leggett (1992) and Bergeron, Ruiz & Leggett (1993). They have corresponding values of Teff of 6000 ± 150, 7450 ± 200 and 5230 ± 140 K, respectively, and are shown in Fig. 6. Although the spectra of LSPM J1459+0851 are noisier, it can be seen that the extent of the Hα feature is consistent with a cool, DA WD. We further assess its properties in more detail in the following sections.
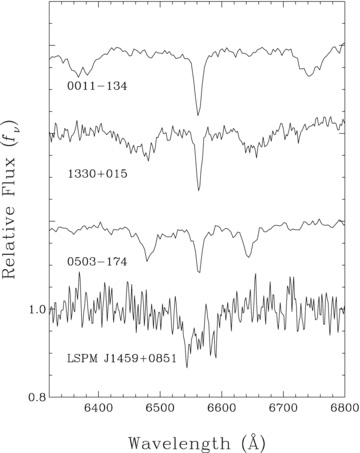
Optical spectrum in the region of Hα for the WD LSPM J1459+0851. For comparison, the spectra of three similar cool, hydrogen-rich, magnetic WDs, WD 0011−134 (B∼ 16.7 MG), WD 1330+015 (B∼ 7.4 MG) and WD 0503−174 (B∼ 7.3 MG) are also shown, with magnetic field strength decreasing from top to bottom.
4.1 Synthetic photometry and fitting procedure
As previously noted, the spectrum shows a lack of strong H lines, which would be expected for a hotter more typical WD. Photometric fitting of the full optical–NIR spectral energy distribution (SED) is thus optimal for determining the effective temperature of the WD, using model fits to the SDSS+UKIDSS photometry and assuming a distance equal to that of the T dwarf companion. The spectra are consistent with a cool WD, showing no strong features in the spectrum blueward of 6000 Å and just a hint of Hα. We performed a fit to the available photometry of the WD (from SDSS, USNO and UKIDSS) using the atmospheric model codes of Bergeron et al., which are described at length in Bergeron, Wesemael & Beauchamp (1995, with updates given in Bergeron, Leggett & Ruiz 2001; Bergeron et al. 2005). These models are in local thermodynamic equilibrium and allow energy transport by convection and can be calculated with arbitrary amounts of hydrogen and helium. Synthetic colours1 were obtained using the procedure outlined in Holberg & Bergeron (2006) based on the Vega fluxes taken from Bohlin & Gilliland (2004).
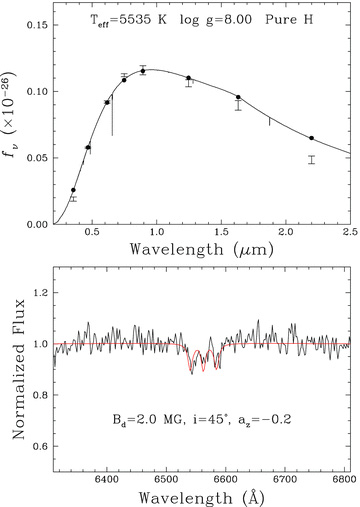
Top panel: Fit of the energy distribution with pure-H models. The observed ugriz and JHK fluxes are represented by error bars, while the model fluxes averaged over the filter bandpasses are indicated by the filled circles. The model monochromatic fluxes are shown by a solid line. Bottom panel: Normalized spectrum near Hα with the synthetic profiles interpolated at the parameters obtained from the energy distribution fits, assuming a pure-H atmospheric composition with a model fit at Teff = 5535 ± 45 K and log g = 8.0 with an offset dipole magnetic field computed with the parameters indicated in the figure.
4.2 A magnetic spectrum
The shape and weakness of the Hα line gives a poor fit to a basic 5535 K model spectra, and we thus investigated the possibility that the WD could be magnetic with the Hα line affected by Zeeman splitting. The line opacity was calculated as the sum of the individual resonance-broadened Zeeman components. The line displacements and strengths of the Zeeman components of Hα are taken from the tables of Kemic (1974), and the total line opacity is normalized to that resulting from the zero-field solution. The specific intensities at the surface, I(ν, μ, τν = 0), are obtained by solving the radiative transfer equation for various field strengths and values of μ(μ = cos θ, where θ is the angle between the angle of propagation of light and the normal to the surface of the star). In doing so, the polarization of the radiation is neglected as we are mainly interested in the total monochromatic intensity. The effect of the magnetic field on the continuum opacity is also neglected. The emergent spectrum is then obtained from an integration over the surface of the star ( ) for a particular geometry of the magnetic field distribution. We note that in this procedure, limb darkening is explicitly taken into account because of the integration over μ.
We computed a series of synthetic spectra based on a model atmosphere of pure hydrogen with Teff = 5535 K and log g = 8.0, while varying Bd, i and az. We display in Fig. 7 the model which best reproduced the observed line profile with Bd = 2.0 MG, i = 45° and az=−0.20. It should be noted that varying the inclination angle i produced only slight variations in the line profiles and as stated in Bergeron et al. (1992), it is not possible to constrain i from observed line profiles alone. The Zeeman-split Hα line in LSPM J1459+0851 can be compared to the same feature in other cool WDs of higher magnetic field strengths in Fig. 6.
4.3 White dwarf age and progenitor lifetime
We start by considering the simple case of a non-magnetic WD for a Teff and log g of 5535 K and 8.0, respectively, for which we calculate a mass of 0.585 M⊙ (Fontaine, Brassard & Bergeron 2001). The corresponding cooling age of a 0.585-M⊙ WD, with a Teff = 5535 K, was then calculated as 3 Gyr, using the isochrones of Fontaine et al. (2001). The total age of the WD comprises both the cooling time and its progenitor lifetime on the MS. In order to constrain the MS lifetime, we accessed the initial–final mass relations of Ferrario et al. (2005), Catalán et al. (2008) and Kalirai et al. (2008) to estimate a likely, initial-mass constraint for the MS progenitor star of 1.50–1.75 M⊙. We then used the tracks of Lachaume et al. (1999) to estimate the MS lifetime for stars of such mass as 1.8–3.0 Gyr. It should be noted, however, that the model tracks converge for masses <2 M⊙, and as a result the ages of these objects can be largely uncertain (up to 10 Gyr).
The strong magnetic field present also provides an additional factor to consider when assessing age. The origin of such strong WD magnetic fields is not fully understood but is thought to have arisen in one of the following two favoured scenarios:
From a single star. The magnetic field is thought to derive from a massive, magnetic progenitor of ∼1.5–8 M⊙, typically an Ap or Bp star. The magnetic field is then maintained through the MS evolution to the WD phase by flux conservation (Wickramasinghe & Ferrario 2000).
From the merger of two stellar cores in a common envelope (CE) event or the merger of two degenerate objects. During the CE phase the orbits of the two cores spiral in closer together through frictional forces causing differential rotation, which coupled with convection in the cores, creates a stellar-magnetic dynamo (Tout & Pingle 1992). Close, but separated, cores form CVs, but some cores coalesce and cool to form a magnetic WD. It may also be possible that two very close WDs emerge from the CE phase, such as G62–46 (Bergeron et al. 1993), where one component is highly magnetic.
In general, it is observed that magnetic WDs have larger masses than the more typical non-magnetic WDs (Liebert 1988). There are two possible hypotheses to explain this. First, in accordance with the favoured scenario for the formation of isolated magnetic WDs (Wickramasinghe & Ferrario 2005), the progenitor was more massive, leading to a massive WD. In this case, the magnetic field has no effect during the progenitor evolution. Secondly, the effect of the magnetic field has an impact on the stellar evolution, such that it could inhibit mass loss (Wickramasinghe & Ferrario 2000), leading to a more massive core and a longer progenitor lifetime. If we consider the possibility that our WD could be of higher mass, for example, 0.8 M⊙ (the mean mass of a highly magnetic WD; Kawka et al. 2007), then the cooling time would be longer, around 6 Gyr (Fontaine et al. 2001). In this case, the progenitor (if a single star) would be around 3.5 M⊙ (Catalán et al. 2008) and the progenitor MS lifetime would be 0.3 Gyr (assuming normal models). However, there is also evidence that many magnetic WDs have masses closer to the peak of the non-magnetic mass distribution (Tout et al. 2008).
As we cannot know which scenario is responsible for the observed magnetic field, nor can we measure more accurately the mass of the WD, we do not know the effects this may have had on the MS evolution. In any case, both scenarios for a magnetic and a non-magnetic WD result in ages greater than 4.8 Gyr (the cooling age plus the minimum progenitor lifetime of a non-magnetic WD) and we thus choose to adopt this as the minimum age for LSPM J1459+0851. Properties of the new WD are given in Table 1.
Parameters of the WD LSPM J1459+0851.
| Parameter | Value | |
| RA | ………… |  |
| Dec. | ………… |  |
| SDSS ′u | ………… | 20.74 ± 0.08 |
| SDSS ′g | ………… | 19.50 ± 0.01 |
| SDSS ′r | ………… | 18.99 ± 0.01 |
| SDSS ′i | ………… | 18.76 ± 0.05 |
| SDSS ′z | ………… | 18.71 ± 0.03 |
| SuperCOSMOS B | ………… | ∼19.48 |
| SuperCOSMOS R | ………… | ∼18.33 |
| SuperCOSMOS I | ………… | ∼18.29 |
| USNO B | ………… | ∼19.8 |
| USNO R | ………… | ∼18.8 |
| USNO I | ………… | ∼18.2 |
| UKIDSS Y | ………… | 18.14 ± 0.02 |
| UKIDSS J | ………… | 17.90 ± 0.02 |
| UKIDSS H | ………… | 17.65 ± 0.04 |
| UKIDSS K | ………… | 17.79 ± 0.06 |
| μ RA | ………… | −170 ± 3 mas yr−1a |
| μ Dec. | ………… | −42 ± 6 mas yr−1a |
| Teff | ………… | 5535 ± 45 K |
| log g | ………… | 8.0 dex |
| Mass | ………… | 0.585 M⊙ |
| WD age | ………… | >4.8 Gyr |
| Parameter | Value | |
| RA | ………… | |
| Dec. | ………… | |
| SDSS ′u | ………… | 20.74 ± 0.08 |
| SDSS ′g | ………… | 19.50 ± 0.01 |
| SDSS ′r | ………… | 18.99 ± 0.01 |
| SDSS ′i | ………… | 18.76 ± 0.05 |
| SDSS ′z | ………… | 18.71 ± 0.03 |
| SuperCOSMOS B | ………… | ∼19.48 |
| SuperCOSMOS R | ………… | ∼18.33 |
| SuperCOSMOS I | ………… | ∼18.29 |
| USNO B | ………… | ∼19.8 |
| USNO R | ………… | ∼18.8 |
| USNO I | ………… | ∼18.2 |
| UKIDSS Y | ………… | 18.14 ± 0.02 |
| UKIDSS J | ………… | 17.90 ± 0.02 |
| UKIDSS H | ………… | 17.65 ± 0.04 |
| UKIDSS K | ………… | 17.79 ± 0.06 |
| μ RA | ………… | −170 ± 3 mas yr−1a |
| μ Dec. | ………… | −42 ± 6 mas yr−1a |
| Teff | ………… | 5535 ± 45 K |
| log g | ………… | 8.0 dex |
| Mass | ………… | 0.585 M⊙ |
| WD age | ………… | >4.8 Gyr |
aUSNO-B1.
Parameters of the WD LSPM J1459+0851.
| Parameter | Value | |
| RA | ………… | |
| Dec. | ………… | |
| SDSS ′u | ………… | 20.74 ± 0.08 |
| SDSS ′g | ………… | 19.50 ± 0.01 |
| SDSS ′r | ………… | 18.99 ± 0.01 |
| SDSS ′i | ………… | 18.76 ± 0.05 |
| SDSS ′z | ………… | 18.71 ± 0.03 |
| SuperCOSMOS B | ………… | ∼19.48 |
| SuperCOSMOS R | ………… | ∼18.33 |
| SuperCOSMOS I | ………… | ∼18.29 |
| USNO B | ………… | ∼19.8 |
| USNO R | ………… | ∼18.8 |
| USNO I | ………… | ∼18.2 |
| UKIDSS Y | ………… | 18.14 ± 0.02 |
| UKIDSS J | ………… | 17.90 ± 0.02 |
| UKIDSS H | ………… | 17.65 ± 0.04 |
| UKIDSS K | ………… | 17.79 ± 0.06 |
| μ RA | ………… | −170 ± 3 mas yr−1a |
| μ Dec. | ………… | −42 ± 6 mas yr−1a |
| Teff | ………… | 5535 ± 45 K |
| log g | ………… | 8.0 dex |
| Mass | ………… | 0.585 M⊙ |
| WD age | ………… | >4.8 Gyr |
aUSNO-B1.
5 LSPM J 1459+0851–ULAS J1459+0857: A BOUND SYSTEM?
In order to determine if this new system is a bona fide binary system, we have statistically assessed the likelihood that two such objects could be a line-of-sight association with photometry and proper motion consistent with binarity by random chance. We first calculated the total region of sky around our T dwarf corresponding to the coverage encompassed by the projected line-of-sight separation of the WD. We then combined this with the T dwarf distance constraint (43–69 pc), allowing for the possibility that the T dwarf might itself be an unresolved binary (at a greater distance), to estimate a volume of sky in which WDs might be line-of-sight contamination. We then used the number density of WDs (e.g. Schröder, Pauli & Napiwotzki 2004) to estimate that we would expect only 0.003 68 WDs in this volume of space.
To factor in the probability that two objects might have a common proper motion at the level of our measurements, we downloaded a magnitude-limited sample (R < 21, the same as our initial selection; see Section 3.1) of objects from the SuperCOSMOS Science Archive. We applied a limit to the proper motion uncertainty of <50 mas yr−1 and required objects to lie in the colour range 1 < B−R < 3 (where we expect contaminant, MS stars to populate). This sample of 10 360 sources was selected from within one degree of the T dwarf as to provide a representative sample of objects in the area of sky in which we find our binary system. We then placed these objects on a colour–magnitude diagram and selected only objects that occupied a region populated by MS stars, when placed at the distance range estimated for the T dwarf. Of the 140 objects that were selected in this way, 13 had proper motion consistent (at the 1σ level) with the T dwarf, leading to a probability of 0.092 that a contaminant star could have proper motion common with the T dwarf.
The chance of finding a WD with the same line-of-sight separation of LSPM J1459+851 from ULAS J1459+0857, where both components share a common proper motion and are consistent with lying at the same distance as that estimated for the T dwarf, is thus 0.003 68 × 0.092 = 0.0003. We thus conclude that these objects form a genuine binary system. Since we searched for companions to a total of 19 T dwarfs, we estimate that the overall chance of finding a spurious system in our sample is 0.0064 and that the systems identified are likely real binaries. Properties of the new WD + T dwarf system are given in Table 2 and a finding chart is presented in Fig. 8. The wide separation of the system (16 500 au, assuming it to be a singular object and not an unresolved binary) is similar to the widest known BD + MS binary systems (e.g. Faherty et al. 2009; Zhang et al. 2010), although prior to the post-MS mass-loss phase of the primary, the separation would have been substantially less. Indeed, we expect that the initial separation of the two components was a factor of ∼4 closer (see Section 3.1) in the region of ∼4100 au and more akin to the more common type of BD + MS binaries (<5000 au; Pinfield et al. 2008).
Parameters of the binary system.
| Parameter | Value | |
| Separation on sky | ………… | 385 arcsec |
| Estimated distance | ………… | 43–69 pca |
| Estimated line of sight separation | ………… | 16 500–26 500 aua |
| Parameter | Value | |
| Separation on sky | ………… | 385 arcsec |
| Estimated distance | ………… | 43–69 pca |
| Estimated line of sight separation | ………… | 16 500–26 500 aua |
aAssuming that the T dwarf is a singular or unresolved binary.
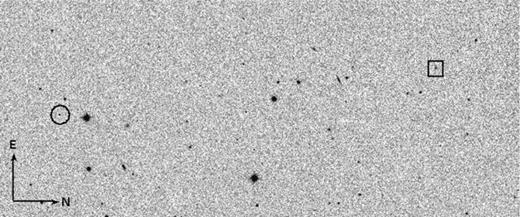
A UKIDSS J-band finder chart showing the position of the T dwarf (square) and the WD (circle), the scale of the image is 8 × 3.5 arcmin2.
6 PROPERTIES OF ULAS J1459+0857
In order to estimate the Teff of ULAS J1459+0857, we used spectral type–Teff determinations from table 6 of Golimowski et al. (2004) as a guide. These determinations are for BDs with known parallaxes (e.g. Tinney 1996; Dahn et al. 2002; Leggett et al. 2002; Tinney, Burgasser & Kirkpatrick 2003; Knapp et al. 2004; Vrba et al. 2004) and SED constraints over a broad wavelength range, for which reliable bolometric flux measurements and luminosities are thus available. The main source of uncertainty in these Teff values comes from a lack of strong age constraints and the resulting evolutionary model radius uncertainties (up to ∼30 per cent for ages >0.1 Gyr; Burrows et al. 1997; Baraffe et al. 1998; Chabrier at al. 2000). By considering the variety of Teff ranges calculated for the T4.5 ± 0.5 dwarfs, which have assumed a range of possible ages from 0.1 to 10 Gyr (±∼300 K), we estimate that for an age range of 4–10 Gyr, ULAS J1459+0857 has Teff in the range 1200–1500 K.
We also used the Lyon Group COND models (Baraffe et al. 2003) to estimate the physical properties of ULAS J1459+0857, allowing for the possibility that it could be a single object or itself an unresolved binary, with a distance in the range 43–69 pc. We calculated absolute magnitudes for ULAS J1459+0857 based on this distance range for ages 4–10 Gyr. We then obtained mass and log g estimates in the range 0.064–0.075 M⊙ and 5.4–5.5 dex, respectively, assuming solar metallicity, by using a linear interpolation between the model grid points. We also consider the evolutionary models of Burrows et al. (1997, 2001) and Burrows, Sudarsky & Hubeny (2006) to estimate a mass of 0.064–0.075 M⊙, if the T dwarf is actually metal poor ([M/H]− 0.5 dex), which is similar to that of the solar metallicity COND models. Both models also indicate a high gravity (log g = 5.5) for the observable J−K colours and temperature range of ULAS J1459+0857. We also compare the optical + NIR colours of ULAS J1459+0857 in comparison with other spectroscopically confirmed T dwarfs from the UKIDSS LAS (Burningham et al. 2010). Fig. 9 shows this complement of T dwarfs compared with the spectral type. Whilst the NIR colours of ULAS J1459+085, in general look fairly typical for a T4.5 dwarf, there is some evidence of relative z band enhancement, which could be the result of the older, higher gravity nature of this object (Pinfield et al. 2008).
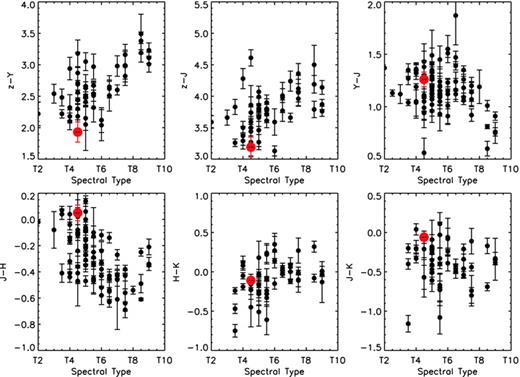
Colour against T dwarf spectral type for UKIDSS T dwarfs (Burningham et al. 2010). ULAS J1459+0857 is shown as a large, filled red circle.
6.1 Initial model testing with benchmark observations
To provide a first-pass test of model atmosphere predictions, we used the dust-free COND models of Baraffe et al. (2003) to provide theoretically informed best-guess constraints of the physical properties of the T dwarf in our binary. We made comparisons between the observed T dwarf spectrum and synthesized spectroscopy for two values of Teff (1200 and 1500 K), three values of log g (5.0, 5.25 and 5.5) and three metallicities (+0.3, 0.0 and −0.5, representing the range observed in the Galactic disc; e.g. Valenti & Fischer 2005; Gray et al. 2006; Holmberg, Nordstróm & Andersen 2007; Jenkins et al. 2008). The model spectra were generated using the atmospheric radiative transfer code, Phoenix (which is described in detail in Hauschildt, Allard & Baron 1999; Allard et al. 2001), which includes the updated water molecular opacity list from Barber et al. (2007) and new solar abundances from Asplund et al. (2009). The model includes the effect of condensation in the chemical equilibrium but ignores the effects of dust opacities. Theoretical spectra were normalized to the observations in the peak of the J band, and the resulting comparisons are shown in Figs 10 and 11. The long red-dotted, short-dashed green and the long-dashed blue lines represent log g = 5.0, 5.25 and 5.5, respectively.
![Spectral model comparisons to ULAS J1459+0857 (black solid line) for Teff = 1200 K and [M/H]=+0.3, 0.0 and −0.5, from the top to bottom panel, with log g = 5.0, 5.25 and 5.5 shown as a long red dotted line, short-dashed green line and the long-dashed blue line, respectively.](https://oup.silverchair-cdn.com/oup/backfile/Content_public/Journal/mnras/410/2/10.1111/j.1365-2966.2010.17469.x/2/m_mnras0410-0705-f10.jpeg?Expires=1750186103&Signature=0PsZOmbe1z58KsE5eNIJQHNXxlmrMu~9TheG0AWb4lP1obfCoE9UzMeCIarHwe5IoANJq~SrYdre613ukbOrHzFeanwTDo9kqgB159SYaVld8IXySWS1HFP48cjqx34BbQ1FmU-uxmnjArR1zYlRQPu37~Yg9je6rZEDgEt~QQfh-QVp8FzhoDlRTzdFFrOG75L8K3qtwbo8PqQRFEmCgeBSm6qSf2GuHBE~Lil1axVKGnhA-dfXOvGSz5JjzMyhoOrSW4TIkhI6CofKI2bmUhiXlpFnesOEX5PYSBvilf76cJ~nr43LobiKHuWxvt2-pK~XCHakmSL2UocoBIzGTQ__&Key-Pair-Id=APKAIE5G5CRDK6RD3PGA)
Spectral model comparisons to ULAS J1459+0857 (black solid line) for Teff = 1200 K and [M/H]=+0.3, 0.0 and −0.5, from the top to bottom panel, with log g = 5.0, 5.25 and 5.5 shown as a long red dotted line, short-dashed green line and the long-dashed blue line, respectively.
![Spectral model comparisons to ULAS J1459+0857 (black solid line) for Teff = 1500 K and [M/H]=+0.3, 0.0 and −0.5, from the top to bottom panel, with log g = 5.0, 5.25 and 5.5 shown as a long red dotted line, short dashed green and the long dashed blue lines, respectively.](https://oup.silverchair-cdn.com/oup/backfile/Content_public/Journal/mnras/410/2/10.1111/j.1365-2966.2010.17469.x/2/m_mnras0410-0705-f11.jpeg?Expires=1750186103&Signature=DG8ig3rl-iIYrYyuJPt82ZN84Po~V8DUw8UXqJ04pl-YwevKfH4cKJy~gQe2LSrdcbNhwshKxlhOkCeOMX3DX41iNxd8a4ffSbR~df-Vnw0rAxGDdzCbZgCIOEP4-rW3YtVbfzzVd6SZ0FUIt7wvv7~kv0PEK8~3wRT-vk8jk44BO-LiLRiZrHssoHIJvvXkEjFC0U7mHDRbyejb6737D2fvetjewLfeHxBWF6tEOpPMBelz6Ttl465ZVfCXD50zY9DqL5xTdHCH2tuM6YGCiae-Rlmg2st81ZB3zdIVHHep9-C-lrOyUUqyWtLBPDALQk2w~NF93K6Q0adYG~5w8w__&Key-Pair-Id=APKAIE5G5CRDK6RD3PGA)
Spectral model comparisons to ULAS J1459+0857 (black solid line) for Teff = 1500 K and [M/H]=+0.3, 0.0 and −0.5, from the top to bottom panel, with log g = 5.0, 5.25 and 5.5 shown as a long red dotted line, short dashed green and the long dashed blue lines, respectively.
Table 3 gives a summary of the reduced chi-squared (χ2ν) values calculated for these comparisons. These values range from ∼1.75 to 3.5, and we note that none of them are close to 1.0. This is to be expected, since there are known shortcomings in the models that introduce differences significantly greater than the measurement uncertainties – e.g. incomplete methane opacities and a poor understanding of the observed J-band brightnening around T3 (e.g. Knapp et al. 2004). As such, we only use these χ2ν values as an additional quality indicator for the overall model-observation comparison.
χ2ν fits to model spectra.
| log g | [M/H] | ||
| +0.3 | 0.0 | −0.5 | |
| Teff = 1200 K | |||
| 5.00 | 1.94 | 2.11 | 2.38 |
| 5.25 | 2.06 | 2.58 | 1.82 |
| 5.50 | 1.97 | 2.07 | 1.76 |
| Teff = 1500 K | |||
| 5.00 | 3.50 | 2.47 | 2.55 |
| 5.25 | 2.89 | 2.03 | 2.62 |
| 5.50 | 3.09 | 1.96 | 2.88 |
| log g | [M/H] | ||
| +0.3 | 0.0 | −0.5 | |
| Teff = 1200 K | |||
| 5.00 | 1.94 | 2.11 | 2.38 |
| 5.25 | 2.06 | 2.58 | 1.82 |
| 5.50 | 1.97 | 2.07 | 1.76 |
| Teff = 1500 K | |||
| 5.00 | 3.50 | 2.47 | 2.55 |
| 5.25 | 2.89 | 2.03 | 2.62 |
| 5.50 | 3.09 | 1.96 | 2.88 |
Our χ2ν analysis reveals that the best-fitting atmospheric model has an effective temperature of 1200 K, a subsolar metallicity and a high gravity of log g = 5.5. However, comparison by eye shows clearly that this fit across the whole spectral range is not particularly good, especially around the peak flux regions of the H and K bands. This best χ2ν value presumably comes from the better fit to the J band, compared to the other models; however, a better fit (by eye) to the overall profile of the spectra comes from a 1500-K, solar metallicity, high-gravity model. This suggests that ULAS J1459+0857 probably has solar to slightly subsolar metallicity and high gravity. This is instructive at least that the observed properties of ULAS J1459+0857 appear to be in general agreement with those predicted by evolutionary models. While the models clearly have some shortcomings, they appear to be making progress, such that model properties for a mid-T dwarf of age >4 Gyr seem to be broadly consistent with benchmark properties.
7 SUMMARY
This is the first discovery of a T dwarf + WD binary system and an example of an evolved, high-gravity BD. During the MS phase of the primary, its separation would have been similar to the bulk population of BD+MS binaries, although the separation must have grown significantly (to its current value) during the post-MS mass-loss phase of the primary.
The WD provides vital age constraints for the binary system from its cooling age combined with a minimum estimate of its MS progenitor lifetime, and the resulting minimum age of 4.8 Gyr for the T dwarf allows a robust constraint on its surface gravity of log g = 5.4–5.5. As such ULAS J1459+0857 is a representative old, high-gravity benchmark BD. A comparison with the bulk popualtion of UKIDSS T dwarfs shows some indication that z band flux enhancement may be an observational characteristic of older high-gravity mid-T dwarfs, which could be a useful factor in attempts to understand the formation history of substellar objects, and more generally, this T dwarf can contribute to our understanding of substellar properties by providing a useful test-bed for theoretical model atmospheres.
This system is an example of how wide BD binary companions to WDs make good benchmark objects, which will help test model atmospheres and may provide independent means to calibrate BD properties of field objects (Pinfield et al. 2006). This is the first of our candidate systems and we expect to find many more as we mine more the UKIDSS sky and with our ongoing efforts to search still deeper by combining UKIDSS BDs with the SDSS for WDs.
Further observations that would have clear benefits for this system include a parallax measurement of either component to yield an accurate distance and fuller spectral coverage of the T dwarf to constrain its mid-IR and optical spectral morphology. In general, and particularly in the optical z band, it would be desirable to assess in more detail spectroscopic features and trends that may be sensitive to higher surface gravity and age. A parallax distance combined with accurate knowledge of the T dwarf bolometric flux would offer significant improvements on the Teff constraints for this object (e.g. Burningham et al. 2009).
An accurate distance would also facilitate greatly improved radius and mass constraints for the WD, and thus a better constraint on the cooling age and progenitor lifetime. More detailed studies of both binary components are clearly crucial to maximize the effectiveness of the benchmark BD component.
The synthetic colours can be obtained at http://www.astro.umontreal.ca/~bergeron/CoolingModels/.
ACD-J, JSJ and MTR would like to acknowledge the support of the grant from CONICYT and the partial support from the Center for Astrophysics FONDAP and Proyecto Basal PB06 (CATA). This work was also suported in part by the NSERC Canada and by the Fund FQRNT (Québec). PB is a Cottrell Scholar of Research Corporation for Science Advancement. JG is supported by RoPACS, a Marie Curie Initial Training Network funded by the European Commission's Seventh Framework Programme. SC is supported by a Marie Curie Intra-European Fellowship within the 7th European Community Framework Programme.
This publication has made use of the the data obtained from the SuperCOSMOS Science Archive, prepared and hosted by the Wide Field Astronomy Unit, Institute for Astronomy, University of Edinburgh, which is funded by the STFC. We also acknowledge the use of data from the Sloan digital archive, which is funded by the Alfred P. Sloan Foundation, the Participating Institutions, the National Aeronautics and Space Administration, the National Science Foundation, the U.S. Department of Energy, the Japanese Monbukagakusho, and the Max Planck Society. We have used data from the Large Area Survey, including those from the data release 4 (Warren et al. 2007). We also acknowledge the use of DENIS and the SIMBAD data base, operated at CDS, Strasbourg, France. ACD-J is supported by a FONDECYT postdoctorado, under project no. 3100098.
REFERENCES
