


Abstract
We have undertaken spectral energy distribution (SED) modelling of discs around low-mass T Tauri stars in order to delineate regions of the infrared two-colour plane (K−[8] versus K−[24]) that correspond to discs in different evolutionary stages. This provides a tool for classifying the nature of star–disc systems based on infrared photometry. In particular, we demonstrate the distinct loci followed by discs that undergo ‘uniform draining’ (reduction in surface density by a spatially uniform factor) from those that clear from the inside-out. We draw attention to the absence of objects on this ‘draining locus’ in those star-forming regions where the 24 -μm sensitivity would permit their detection, as compared with the ∼20 objects in these regions with colours suggestive of inner holes. We thus conclude that discs predominantly clear from the inside-out. We also apply our classification of the infrared two-colour plane to stars of spectral types M3–M5 in the IC 348 cluster and show that some of its members (dubbed ‘weak excess’ sources by Muzerolle et al.) that had previously been assumed to be in a state of clearing are instead likely to be optically thick discs in which the dust is well settled towards the mid-plane. Nevertheless, there are many discs in a state of partial clearing in IC 348, with their abundance (relative to the total population of disc bearing stars) being around four times higher than for comparable stars in Taurus. However, the number of partially cleared discs relative to the total number of late-type stars is similarly low in both regions (10 and 20 per cent, respectively). We therefore conclude that IC 348 represents a more evolved version of the Taurus population (with more of its discs being highly settled or partially cleared) but that the time-scale for clearing is similarly short (a few times 105 yr) in both cases.
1 INTRODUCTION
The infrared colours of discs around young stars provide a prime diagnostic tool for analysing the evolution of circumstellar discs. Just as the distribution of stars on a Hertzsprung–Russell diagram contains information about the relative duration of various stellar evolutionary stages, infrared two-colour diagrams also play a similar role in the case of disc studies. In particular, Kenyon & Hartmann (1995) drew attention, in the case of young stars in the Taurus star-forming region, to a pronounced gap in this diagram, intermediate between the colours of optically thick discs and those of stellar photospheres. This suggested that young stars undergo a rapid transition between disc possessing and discless status, which is a small fraction (around 10 per cent) of their previous lifetimes as disc-bearing sources. Such ‘two-time-scale’ behaviour has provided a strong constraint on viable models of disc clearing, requiring scenarios, such as photoevaporation (Clarke, Gendrin. & Sotomayor 2001; Alexander, Clarke & Pringle 2006; Ercolano et al. 2008; Ercolano, Clarke & Drake 2009a; Gorti & Hollenbach 2009; Owen et al. 2010) or possibly planet formation (Armitage & Hansen 1999) where there is a final rapid clearing phase. Discriminating between these two scenarios may become possible in the future when disc statistics in clusters of different metallicities start becoming available (Yasui et al. 2009; Ercolano & Clarke 2010).
In recent years, data acquired with the Spitzer Space Telescope have permitted collation of infrared colours for stars in a range of star-forming regions (Allen et al. 2007; Muench et al. 2007; Koenig et al. 2008; Evans et al. 2009; Gutermuth et al. 2009; Rebull et al. 2010). These provide samples that are, in some cases, somewhat older than Taurus and that generally contain a higher proportion of stars of a later spectral type (M stars). Both these factors have been invoked when explaining cases where the distribution of different categories of infrared SEDs is rather different from that in Taurus.
A case where differences from Taurus have been the subject of much debate is the cluster IC 348, which was initially age-dated at roughly 2.5 Myr (Haisch, Lada & Lada 2001), but has since been revised to 4–5 Myr by Mayne et al. (2007) and Mayne & Naylor (2008). Spitzer photometry has been acquired for this cluster by Lada et al. (2006) and Muench et al. (2007) with revised photometry and extra 24 -μm data being added by Currie & Kenyon (2009). Here Lada et al. (2006) drew attention to a population of what they called ‘anaemic’ discs, being objects that exhibited discs that were weak compared with those typical of Taurus. This category includes sources which have alternatively been dubbed as ‘homologously depleted’ discs by Currie & Kenyon (2009) and as three separate categories by Muzerolle et al. (2010) (i.e. ‘weak excess’, ‘warm excess’ and ‘classical transition’ discs). Each of these designations is designed to suggest discs that are in a state of partial clearing. The number of such sources is large in IC 348 (e.g. including sources where only an upper limit is available at [24]μm, Lada et al. (2006) classified 44 M3–M5 stars in IC 348 as having anaemic discs, compared with 41 with optically thick discs; if only sources with a detection at [24]μm are included, then the number of anaemic and optically thick discs are 18 and 31, respectively).
The large number of discs that are apparently in a state of partial clearing has prompted us (Section 2) to investigate the expected trajectories in the infrared two-colour plane for M star discs that clear according to a variety of scenarios. Our aim is therefore to deduce the likely physical state of discs from their infrared colours and to provide a framework that can be applied to the M stars in a range of clusters. We will avoid empirical classifications (e.g. those that relate infrared excesses to the distribution found in Taurus) and instead focus on the likely physical properties of the discs concerned. We will however discuss how our classification relates to the various empirical categories of cleared discs mentioned above.
In Section 3, we analyse the case of IC 348 by assessing how the distribution of sources in the infrared two-colour plane can be mapped on to a distribution of discs in different evolutionary states. We will show that – although some of the anaemic discs in this cluster are merely flat, optically thick discs with no evidence for clearing (Luhman et al. 2010) – there are nevertheless more partially cleared discs among M stars in the intermediate-age IC 348 cluster than in the case of M stars in the younger Taurus. Section 4 summarizes our conclusions.
2 THE EVOLUTION OF M STAR DISCS IN THE INFRARED TWO-COLOUR PLANE
2.1 Model evolutionary tracks
We consider a range of disc clearing scenarios and plot their trajectories in the K−[8] versus K−[24] plane. K-band emission is largely contributed by the star whereas that at 8 and 24 μm originates in a broad radial range in the disc (roughly 0.2–0.3 and 1–2 au, respectively, for M stars). Our choice of these bands is motivated by the availability of data acquired by Infrared Array Camera (IRAC) and Multiband Imaging Photometer for Spitzer (MIPS), respectively, and also by the fact that they are well separated in wavelength. As pointed out by Ercolano, Clarke & Robitaille (2009b), the shorter wavelength infrared bands are less useful for the study of disc clearing in M stars since they can be dominated by the star even in the case of an optically thick (uncleared) disc.
2.1.1 The case of zero thickness discs
We first consider the limiting case of razor-thin, flat, optically thick reprocessing discs, viewed at a range of inclination angles. We then consider two scenarios for disc clearing: (i) progressive uniform reduction of the disc surface density at all radii and (ii) the carving out of the optically thick disc by an inner cavity of progressively larger radius.1 In each case, we compute the SED using the radiative transfer code of Whitney et al. (2003a,b).
Fig. 1 shows the result of this exercise in the case of a star of spectral type M4.5. The point F represents the colours of a flat, optically thick reprocessing disc that is almost face-on (cos i = 0.95) and the point E of a similar disc viewed almost edge-on (cos i = 0.05). The slope of the line EF is consistent with the fact that tilting the disc mainly results in a reduction of the 8- and 24 -μm flux rather than the (mainly stellar) emission at K. We would expect that a disc with negligible accretion luminosity and where the dust was completely settled to the mid-plane would, depending on its inclination, lie on the line FE.
![Model evolutionary tracks for a zero thickness disc surrounding an M4.5 star. Point F is for an optically thick reprocessing disc seen almost face-on (cos i = 0.95), point E is for the same disc seen almost edge-on (cos i = 0.05) and intermediate inclinations lie along the line FE. Point P represents the colours of a pure stellar photosphere. The red dashed lines show the evolution for uniform draining of the disc if seen close to face-on (line FP) or close to edge-on (line EP). The red ‘X’ marks nominal ages along the FP and EP lines (1, 100, 469 Myr and 2.1 Gyr) based on an extrapolation of the disc's viscous draining according to a similarity solution (see the text). The blue dash–dot–dotted lines FP and EP show the evolution of a disc that is clearing via inside-out erosion. The three intermediate points marked by diamonds are for inner holes of [8], 20 and 40 au, respectively.](https://oup.silverchair-cdn.com/oup/backfile/Content_public/Journal/mnras/410/1/10.1111_j.1365-2966.2010.17473.x/1/m_mnras0410-0671-f1.jpeg?Expires=1749873319&Signature=Tfkf0nzmYscWdoQ0zh2hQgIJDOUSVCD3lzTFfmUVUP3KgRnwBKaoyD4UezwSavMnzOKXCEYMSub5aXuhM7y0RVkBjy~mHI0NM3UoVB30HF8SPC8WHJDgHguxMSCFU8yYCPUcWLP2QMByZHzzREXn~yx9fTQao4i0Yc01jdpOG4Ci6b9wwt3k2OA8cqeFI87ZI9pIuwVdy6VnqZpviroQ46BjKZ8atwOLZdX1XW652iSuCszMunsHave6TXo5u0yS6MnRwzUDMsKUL3kEH2FLOI3Tk2yKmRfdaWKYIor1AY0OK8A2cqaPzLGOCg5uJOwgxxRvzD3WsUClqn-kzVesBQ__&Key-Pair-Id=APKAIE5G5CRDK6RD3PGA)
Model evolutionary tracks for a zero thickness disc surrounding an M4.5 star. Point F is for an optically thick reprocessing disc seen almost face-on (cos i = 0.95), point E is for the same disc seen almost edge-on (cos i = 0.05) and intermediate inclinations lie along the line FE. Point P represents the colours of a pure stellar photosphere. The red dashed lines show the evolution for uniform draining of the disc if seen close to face-on (line FP) or close to edge-on (line EP). The red ‘X’ marks nominal ages along the FP and EP lines (1, 100, 469 Myr and 2.1 Gyr) based on an extrapolation of the disc's viscous draining according to a similarity solution (see the text). The blue dash–dot–dotted lines FP and EP show the evolution of a disc that is clearing via inside-out erosion. The three intermediate points marked by diamonds are for inner holes of [8], 20 and 40 au, respectively.
The dashed line FP represents the trajectory of a face-on disc that undergoes progressive uniform reduction in its surface density until it arrives at P which has the colour of a pure stellar photosphere. Once the disc starts to become optically thin, its radial surface density profile affects the SED: the model shown is for the case that the surface density profile Σ scales as R−1. The line EP is the corresponding locus for a nearly edge-on disc. The slope of these lines reflects the fact that as the disc surface density is reduced, it is the longer wavelength emission (i.e. at 24 μm) that becomes optically thin first. We emphasize that very small surface densities are required in order to achieve unit optical depth in the mid-infrared (i.e roughly 6 × 1022 cm−2 at 8 μm and 1023 cm−2 at 24 μm) and that the progression along FP or EP would be slow unless the disc draining was accelerated.
In order to illustrate this last point, we place ticks on the line FP which correspond to nominal times in the case of a viscously draining disc. This disc model has been normalized so that we start from a disc at an age of 1 Myr for which the accretion rate on to the star has fallen to the point of marginal detectability (i.e. 10−10 M⊙ yr−1). The forward evolution employs a viscous similarity solution for a disc with steady surface density profile ∝R−1 for which the disc surface density declines as t−1.5 (Hartmann et al. 1998); the ticks correspond to ages of 1 Myr (at F) and then 100 and 460 Myr and finally 2.1 Gyr by the time such a disc would arrive at P. Given that many young stars already exhibit purely photospheric emission at an age of a few Myr, it is immediately obvious that the later stages of disc clearing cannot be a simple extrapolation of the viscous draining that dominates the earlier phases of disc evolution. If the lines FP and EP had any relevance to disc clearing they would instead have to correspond to a faster depletion mechanism, possibly related to the reduction in opacity due to grain growth or a lowering of the dust-to-gas ratio in the disc.
We now instead consider the alternative scenario in which a disc that has settled to a flat, optically thick configuration (and thus, according to its inclination, resides along the line FE) is carved out from the inside by the creation of successively larger inner holes. We draw a couple of loci (dash-triple-dotted lines in Fig. 1) which originate at F and E and where the diamonds mark hole sizes of 8, 20 and 40 au. These loci initially descend nearly vertically as the creation of a small hole reduces the 8 -μm flux without appreciably changing the 24 -μm flux; for hole sizes of around 10 au and larger, the 24 -μm flux also starts to decline and the locus flattens out so as to approach P nearly horizontally.
2.1.2 Finite thickness discs
We now repeat the above experiments (i.e. we calculate the evolution in the two-colour plane of discs at a variety of inclinations which clear either by uniform draining or by the growth of an inner hole) but consider the case of discs where the dust has a finite thickness. An important difference from the razor-thin case is that in this case, the line of sight to the star is now blocked at high inclinations by the disc and the K-band flux is strongly reduced. We however do not plot any models whose inclination is such that the extinction of the star by the disc exceeds Av=10, since such objects would not appear in samples of optically selected T Tauri stars.
Fig. 2 plots a sequence of models at various inclinations (i.e. from face-on to the most tilted case for which Av<10) for a range of assumptions about the vertical structure of the disc. The vertical structure of the dust disc is parametrized by two quantities that control the degree of flaring and dust settling: b is the parameter that controls the radial variation of the disc scaleheight (i.e. H∝Rb). A disc with b = 1 has a constant opening angle whereas models with b > 1 are flared. In addition, a further parameter represents the ratio (HD) of the scaleheight in the dust to that in the gas: HD = 1 corresponds to the case of well-mixed gas and dust whereas HD < 1 denotes cases where the dust is relatively settled towards the mid-plane.
![Model evolutionary tracks for finite thickness discs surrounding an M4.5 star; note the different scale (cf. Fig. 1). Black, red and green symbols denote optically thick models where b = 1, 1.13 and 1.25, respectively. Squares, asterisks and triangles denote optically thick models where HD = 0.1, 0.5 and 1.0 (see the text for definitions of b and HD). In each case, the succession of points with the same symbol type and colour represents a sequence of inclinations up to the point where the disc is viewed sufficiently close to edge-on that the star itself is obscured (Av>10). The dashed lines show the tracks for a uniformly draining model where HD = 1, b = 1.13[blue = face-on; magenta = close to edge-on (cos i = 0.95 and 0.05)], with the latter model only being plotted at periods when the central star is optically visible.](https://oup.silverchair-cdn.com/oup/backfile/Content_public/Journal/mnras/410/1/10.1111_j.1365-2966.2010.17473.x/1/m_mnras0410-0671-f2.jpeg?Expires=1749873319&Signature=R-b1Z~2fgBblWFs13HaXvwSN4aU8amcfrJXlk4ly19C9b9z355p5c8URd~hf5T23s-3iSkE8KvA92Fzx-~QN0wVLLZXpYDmc36uimAbk8Al00KHO5zMmF1uet5DkAdFUrHQ0mMjtxQVZ2ql9isUsN2dNAvZtQDohV6qD1MzHInq8q2Wtus8KmR~Qsfr07YZNjMJpHfwDKswwvQ7IQArEhqk-bMRQYBs8JtDaWyocDZ4Zif9W9VEpomgvGFlkVlWkEKyote4QKy5wCaF-uRUZyojl-HLd9wuoUNUJFSyqqAe4CmQwjZzD98TCePkInuOXliFToTiU4SETdKK2Dj7Nxg__&Key-Pair-Id=APKAIE5G5CRDK6RD3PGA)
Model evolutionary tracks for finite thickness discs surrounding an M4.5 star; note the different scale (cf. Fig. 1). Black, red and green symbols denote optically thick models where b = 1, 1.13 and 1.25, respectively. Squares, asterisks and triangles denote optically thick models where HD = 0.1, 0.5 and 1.0 (see the text for definitions of b and HD). In each case, the succession of points with the same symbol type and colour represents a sequence of inclinations up to the point where the disc is viewed sufficiently close to edge-on that the star itself is obscured (Av>10). The dashed lines show the tracks for a uniformly draining model where HD = 1, b = 1.13[blue = face-on; magenta = close to edge-on (cos i = 0.95 and 0.05)], with the latter model only being plotted at periods when the central star is optically visible.
Fig. 2 shows that a variation in b over the range of 1–1.25 and in HD over the range of 0.1–1 produces (in combination with a range of disc inclinations) optically thick model discs with a range of colours; as expected, the reddest discs are flared, unsettled, face-on structures. The bluest colours that are produced by an optically thick disc correspond to where the disc is observed close to edge-on but with the extinction to the star still satisfying Av>10. We find that even where the dust is significantly settled (i.e. HD = 0.5), the bluest optically thick (uncleared) disc has a value of K−[8] of around 1.2. Only models with HD∼ 0.1 can reach K−[8] < 1.2, and these represent a very extreme case of settling.
When these optically thick flared discs are subject to uniform draining, they evolve (for Σ∝R−1) along the dashed lines shown. As long as the disc is optically thick in the optical, the models are still redder (for a given surface density normalization) than the flat disc models, since the geometry of the optical photosphere sets the temperature distribution in the disc. It is only at the point where the disc becomes optically thin also to the star's optical radiation that disc geometry no longer affects the disc colours. What is notable, however, is that (although the flared disc models are redder than the flat discs in both colours for a given surface density profile) both flared and flat draining models lie along the same trajectory in colour space.2 We have therefore shown that there exists a well-defined draining sequence such that discs with a wide range of vertical structure and inclinations lie along this trajectory.
The tracks for flared discs of various inclinations that are subject to clearing through the progressive growth of inner holes are qualitatively similar to the tracks with inner holes for flat discs except that, as expected, they are redder at K−[24].
2.1.3 Summary
In Fig. 3, we use the models computed above in order to classify various regions of the two-colour plane. Regions A and B correspond to optically thick discs and pure stellar photospheres. The blueward extent of region A depends on the disc geometry; however, even unflared discs (i.e. with constant opening angle: b = 1) have K−[8] values of >1.2 if the star is optically visible, unless the degree of dust settling is extreme (i.e. the case of HD = 0.1). The redward extent of region B depends on the spectral type; the solid lines represent the empirically derived infrared colours of an M5 star presented in the appendix of Luhman et al. (2010). (K−[8] = 0.46, K−[24] = 0.69.) The dotted line encompasses our estimate of the uncertainties in this limit (see Section 3).
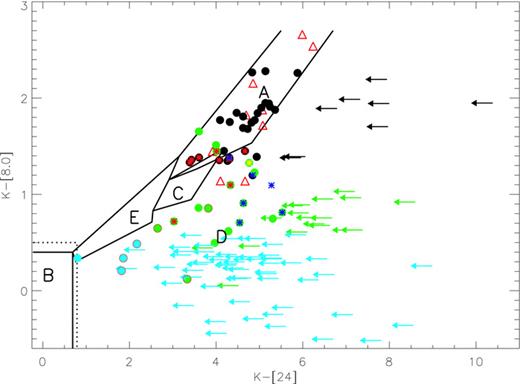
Two-colour plot showing the location of the M3–M5 sources in IC 348 from the catalogues of Muench et al. (2007) and Lada et al. (2006) in the updated version of Currie & Kenyon (2009). See Section 2.2 for details about the colour codes and symbols. Five distinct regions have been labelled in this diagram; A: optically thick reprocessing discs; B: pure stellar photospheres; C: ultra-settled discs viewed close to edge-on; D: inner hole sources and E: uniformly draining discs.
Systems which lie outside these regions are ‘partially cleared discs’, apart from the small wedge of colour space (region C) which corresponds to ‘ultra-settled’ discs viewed close to edge-on. (‘Ultra-settled’ denotes the case that the ratio of dust to gas scaleheight HD < 0.1.) Region D contains objects that are compatible with being sources with cleared inner holes. The strip E is the ‘draining locus’, which corresponds to the trajectory of discs in which the column density of dust is successively reduced by a (spatially constant) factor.
Below, we use this plot in order to classify the disc bearing properties of late-type stars in IC 348.
2.2 Matching to sources in IC 348
We now turn to the question of how we should interpret the various categories of partially cleared discs classified by previous authors. Since many star-forming regions (notably Taurus) contain relatively few discs that occupy the partially cleared region, we here select a cluster in which it has been claimed that there is a relatively large population of partially cleared discs (see Currie & Kenyon 2009; Luhman et al. 2010 for contrasting views on this issue). We present a statistical analysis of IC 348 in Section 3 and here restrict ourselves to some exemplary cases from this cluster. Fig. 3 combines the classification derived above with Spitzer colours of the stars in IC 348 in the spectral type range from M3 to M5, dereddened using the Av values of Lada et al. (2006) and Muench et al. (2007) and the reddening law of Rieke & Lebofsky (1985). We have, where available, revised the photometry obtained by Lada et al. (2006) in accordance with the more sensitive measurements (and MIPS photometry) obtained by Currie & Kenyon (2009). The black symbols represent discs classified as (optically) thick discs by Lada et al. (2006), the green symbols are the ‘anaemic discs’ of Lada et al. (2006) and the blue dots are systems classified as photospheres (on the basis of IRAC data alone). The red triangles are the sources observed by Muench et al. (2007). The horizontal arrows represent the sources for which only upper limits are available at 24 μm which are unfortunately quite numerous in this cluster owing to the bright background emission. The red, yellow and blue asterisks denote sources that have variously been classified as ‘weak excess’, ‘warm excess’ and ‘classical transition’ (i.e. inner hole) sources, respectively, by Muzerolle et al. (2010). The sources with an outer red circle are those classified as ‘homologously depleted’ by Currie & Kenyon (2009).
It is immediately obvious from this plot that the various classification schemes overlap and that we have sources that are associated with a variety of designations. Thus, there are red asterisks with black borders [objects counted as weak excess by Muzerolle et al. (2010) but as ‘thick discs’ by Lada et al. (2006)] which have very similar colours to other sources that were counted as ‘anaemic’ by Lada et al. (2006). Other anaemic sources (those with a red border) are described as ‘homologously depleted’ by Currie & Kenyon (2009). Here we draw attention to the following three aspects of this plot.
Almost all the ‘weak excess’ discs of Muzerolle et al. (2010) lie close to the upper end of the line FE in Fig. 1, implying that they are describable as razor-thin, optically thick discs at a range of (relatively face-on) inclinations (i < 60°). In order to check this, we have fitted these sources as such discs in which the only free parameter is the source inclination; the results of this exercise are shown in Fig. 4 and demonstrate excellent agreement in 5/9 cases (namely sources LRLL 135, 176, 213, 229 and 241). Note that this is not a unique interpretation: these same sources could also be fitted by finite thickness (though rather settled) optically thick discs at somewhat larger inclinations (see Fig. 2). The other four models have too much flux at 24 μm to be produced by a completely flat model; in three of these (sources LLRL 68, 76 and 214), the colours are compatible with a finite thickness (but settled) optically thick disc (Fig. 2). Only one source (LLRL 182) has colours suggestive of a cleared inner hole. Thus whereas Muzerolle et al. (2010) speculated that these weak excess models are in a state of partial clearing, we demonstrate that they can mostly be fitted by optically thick discs in which the dust is somewhat settled towards the mid-plane. The sizeable population of sources in this region of the two-colour diagram is a demonstration that disc clearing is preceded by a significant period where the disc is optically thick and with the dust well settled towards the mid-plane. A similar conclusion concerning the prevalence of settled discs in late-type stars was reached by Pascucci et al. (2003), Apai et al. (2004) and Allers et al. (2006).
There are six sources classified as ‘homologously depleted’ by Currie & Kenyon (2009) in Fig. 3 (red outer circles). The positions of these sources in the two-colour diagram are suggestive of an inner hole and in Fig. 4, we illustrate inner hole models for two of these sources (sources LLRL 124 and 261, located respectively at [K− 24, K− 8] of [2.17, 0.49] and [2.65, 0.65]). Amongst the many degeneracies that afflict dust SED modelling of discs, we highlight that there is a degeneracy between the disc inclination and the inner hole size, as shown in Fig. 5 where the two sources are equally well matched with flat discs with [8] or 20-au holes of different inclinations.
Overall we see that among the partially cleared discs (see Fig. 3), there are no detected sources close to the draining locus. The interpretation of this result is complicated by the large number of 24 -μm upper limits in IC 348. These upper limits are actually higher (in K−[24]) than the detected sources; the simplest explanation is that higher sensitivity observations would yield K−[24] colours in the same region of the two-colour diagram as the detected sources (i.e. would place them in the inner hole region D). We cannot, of course, rule out the alternative possibility that they are actually much bluer in K−[24] than the inner hole sources (i.e. that they would lie on the draining locus). There is no obvious reason, however, why sources that are intrinsically blue in K−[24] should be systematically associated with large upper limits on the K−[24] colour. However, the only definitive statement that we can make here is that there is no evidence for any sources being close to the draining locus in this cluster, despite the large number of sources in the partially cleared region.
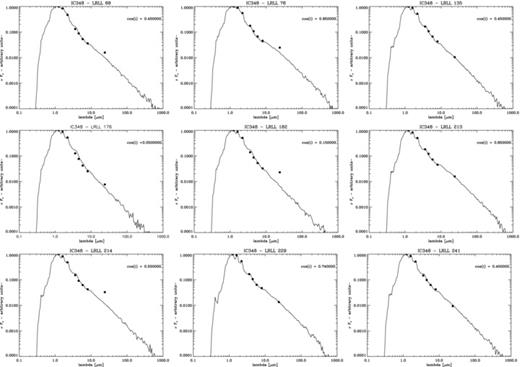
Dereddened SEDs of the weak excess sources identified by Muzerolle et al. (2010) in IC 348 compared to model SEDs for optically thick flat reprocessing discs. In each case the best-fitting inclination is indicated; such flat disc models are good fits in 5/9 cases. Of the remaining four sources, three (LLRL 68, 76 and 214) would require more flared disc structures whereas LLRL 182 is suggestive of a cleared inner hole.
![Dereddened SEDs for two sources in IC 348, identified as ‘homologously depleted’ by CK09, compared to model SEDs of flat optically thick discs with inner holes of [8] au (left-hand panels) and 20 au (right-hand panels).](https://oup.silverchair-cdn.com/oup/backfile/Content_public/Journal/mnras/410/1/10.1111_j.1365-2966.2010.17473.x/1/m_mnras0410-0671-f5.jpeg?Expires=1749873320&Signature=WaqffRFA292XZKRcWXGgUy261Yipg2Lqte4C9mft6QJTkVJIn34AMt8NuTXI0Yg6z~JsHfFXXUFt9~ZrnYsn7iGmThaa5S0vprx7gc2BSlw~gKJ8s1tjgYWajFNEeTW7-xlf0bF91QTERXrNtk3Z7vmBCp3OFVlOqYV03aqR-0XfnST715sUpWsEGWJPilvGkVxBU1YfK0d627leKhCRMUZa~tX4m2UxCXjrdf8s-AieBL4Jh3lB7gwNOOD9sDxSMmme59ez8657wA2gY7QOWwTaG9MjTq2m589z1DHmJeTpMIp1fgG9zTRtQsBSDxhS102LOSqMea6bHSBS8WEcYg__&Key-Pair-Id=APKAIE5G5CRDK6RD3PGA)
Dereddened SEDs for two sources in IC 348, identified as ‘homologously depleted’ by CK09, compared to model SEDs of flat optically thick discs with inner holes of [8] au (left-hand panels) and 20 au (right-hand panels).
3 THE STATISTICS OF DISC CLEARING IN IC 348 AND TAURUS
The discussion in Section 2.2 allowed us to divide the infrared two-colour plane into distinct regions; broadly speaking, the K−[8] colour alone is sufficient to determine whether a disc is in a partially cleared state, whereas, for systems in this condition, the 24 -μm flux is required in order to distinguish the mode of disc clearing (i.e. uniform draining versus inner hole growth). There are two regions, however, where the identification by the K−[8] colour alone is not completely unambiguous. First, there is an overlap in K−[8] colours (in the range of 0.8–1.2) between partially cleared discs and ultra-settled edge-on discs (i.e. region C in Fig. 3). Secondly, there is some uncertainty (of the order of a few tenths of a magnitude) in the red boundary of the K−[8] colour of pure stellar photospheres.
Bearing these caveats in mind, we can use the distribution of K−[8] colours in order to look at the statistics of the incidence of clearing discs. Luhman et al. (2010) presented such an analysis (in terms of the spectral slope between 2 and 8 μm) for a number of clusters and concluded that – for stars of a given spectral type – the distribution of spectral slopes among disc-bearing stars in IC 348 was indistinguishable from that in Taurus. Since Taurus is the original region in which the small number of transition objects was first noted, it would then follow that such objects are comparably rare in IC 348.
This conclusion is at first sight surprising when one compares Fig. 3 with the corresponding two-colour plot for stars in the same range of spectral type in Taurus, as there would, to the eye, appear to be a much more pronounced gap in the Taurus data (fig. 12 of Luhman et al.). It is, however, important to note that Luhman based his comparison between Taurus and IC 348 only on those sources that were detected at 24 μm; from Fig. 3, one sees that there are many upper limits at 24 μm in the IC 348 two-colour plot and that these upper limits are particularly numerous among sources that are blue in K−[8], i.e. among the sources undergoing disc clearing. Although the fraction of systems that are undetected at 24 μm is much lower in Taurus, it is again the case that those systems that are not detected at 24 μm tend to be those with blue K−[8] colours. The systematic omission of sources that have only upper limits at 24 μm will thus skew any comparison of the distribution of discs as a function of the K−[8] colour.
With this in mind, we re-analyse the distribution of K−[8] colours of the de-reddened SEDs of M3–M5 stars in IC 348 and Taurus.3 We include all sources (irrespective of whether they are detected at 24 μm) and have 83 such sources in Taurus (with α values taken from table 7 of Luhman et al.) and 144 sources in IC 348 with K−[8] values from the photometry sources listed in Section 2.
If we simply compare the distributions of the K−[8] colour in the two clusters with a Kolmogorov–Smirnoff (KS) test, we obtain the result that the two distributions are overwhelmingly different (KS probability of ∼10−4 of these data sets being drawn from the same population). This highly significant difference, however, simply reflects the fact that IC 348 contains many more systems that have completely cleared their discs. What we wish to test however is whether, within the population of objects that retain some form of discs, there is a higher fraction of partially cleared discs in the case of IC 348.
At this point, we come up against the problem of defining the red limit in the K−[8] colour for purely photospheric emission. The combination of photometric errors, the finite range of spectral types in our sub-sample and uncertainties in the empirical calibration of spectral type against the photospheric colour means that it is difficult to propose a robust criterion for the K−[8] colour of a discless system. The two-colour diagram of detected sources in Taurus illustrates this problem: even within the spectral type range from M3 to M5, there are objects with a K−[8] colour of around 0.5 with very different K−[24] colours, suggesting that objects close to this K−[8] colour are a mixture of photospheres and systems with discs. In order to avoid this ambiguity, we therefore restrict our comparison of K−[8] colour distributions to those objects that are redder in K−[8] than 0.7. In this way, we can be confident that all the objects in our sample (in each cluster) have some form of circumstellar emission; inevitably, in the process, we omit a few bluer objects that have some residual disc. But for our present purposes, all that matters is that we have samples in the two regions that contain all stars of a given spectral type with K−[8]> 0.7 and that this selection ensures that all the objects in our samples show some form of circumstellar emission (i.e. we are comparing disc systems – whether partially cleared or not – in both regions).
In Fig. 5 we plot cumulative distributions for the K−[8] colour for the two regions (with IC 348 being the red curve that attains a value of unity at lower K−[8]), assuming a cut-off in a K−[8] colour of 0.7 discussed above. This choice highlights the dearth of Taurus objects with K−[8] in the range of 0.7–1.2, i.e. the range of colours where discs are either partially cleared or ultra-settled [note that there are several partially cleared (inner hole sources) in Taurus but these have bluer K−[8] colours than those sources in Fig. 6, and we would not be able to identify these sources as such in the absence of 24 -μm data]. By contrast, around 30 per cent of disc bearing objects in IC 348 have spectral slopes in the colour range 0.7 < K−[8] < 1.2 in which discs are either partially cleared or ultra-settled. The KS probability of these distributions being the same is 10−5.
![Cumulative distribution of K−[8] colours for the M3–M5 stars in Taurus (black line) and IC 348 (red line), including only those sources which have K−[8] > 0.7 and where we can be confident that there is some form of circumstellar emission.](https://oup.silverchair-cdn.com/oup/backfile/Content_public/Journal/mnras/410/1/10.1111_j.1365-2966.2010.17473.x/1/m_mnras0410-0671-f6.jpeg?Expires=1749873320&Signature=tual-fnGHbWE4Vcm609p5Uhj6vWYNo6HycGvqLqrnAXZl6jcSVi8A0LNS9sQ9OEKhwUCeRIDt4TBkGhRIjBzN4YHmWW0FVA74Tuh9924Zikb7eCDwAqZ0PVR2t4nlZHePgNY936CZLrxS13zgKdkAstwAqJVo48x0YNw3aHFJhkbpMyIAFK47Ev0Dx3m9-ZZfaq4s6ZMr7LzI4qpViiQgdxYHZkLVwzUoON6bqNpYIWRFeC2RiEyN~EOpWrABwgL-JSF53~HbAyIjX6ZwGUUoujXL97yjynIhNUOL5bA3VoCwi1uBajwSyfqd6ZoO7-jvwOKsgx7i7mbCg-tpd3xkw__&Key-Pair-Id=APKAIE5G5CRDK6RD3PGA)
Cumulative distribution of K−[8] colours for the M3–M5 stars in Taurus (black line) and IC 348 (red line), including only those sources which have K−[8] > 0.7 and where we can be confident that there is some form of circumstellar emission.
We thus conclude that the distributions of K−[8] colours in IC 348 and in Taurus are very different once one includes all objects (regardless of whether they are detected at 24 μm). We can estimate the fraction of disc bearing systems that are partially cleared or ultra-settled by adding all the sources in the colour range 0.7 < K−[8] < 1.2 (regardless of whether they are detected at 24 μm or not) to all bluer objects with a measured excess at 24 μm. This yields a total of 2 + 6 in Taurus and 23 +[8] in IC 348, compared with a total number of disc bearing objects of 55 and [8]1 in the two clusters, respectively. This corresponds to a fraction of discs that are partially cleared of 11 per cent in Taurus and 38 per cent in IC 348. This is however a lower limit since it is possible that some fraction of the objects with photospheric K−[8] colours but with 24 -μm upper limits that are above photospheric levels (these objects numbering 21 in Taurus and nearly 70 in IC 348) could turn out to have residual outer discs.
4 CONCLUSIONS
Our modelling has allowed us to propose a classification scheme for late-type T Tauri stars based on their locations in the K−[8], K−[24] two-colour plane (Fig. 3). We highlight the fact that this diagram reveals a locus for discs that clear through uniform draining (i.e. reduction in surface density by a constant factor) which is quite distinct (much bluer in K−[24] for given K−[8]) than the region occupied by discs with cleared inner holes. This is because a uniformly draining disc becomes optically thin first at large radii and longer wavelengths. Fig. 3 also contains data for IC 348 where symbol type and colour illustrate the overlapping designations proposed by previous authors.
We find that a few of the anaemic discs of Lada et al. (2006) and most of the discs described as ‘weak excess’ by Muzerolle et al. (2010) are compatible with rather flat/settled optically thick dust discs. Their abundance in this cluster is therefore an indication of dust settling rather than disc clearing.
There are however a large number of sources (at least 38 per cent of systems with evidence for circumstellar emission in IC 348) with evidence for partial clearing of the disc. We have shown that (provided one does not omit sources that are undetected at 24 μm) the fraction of discs in a partially cleared state is at least a factor of 3–4 higher in IC 348 than in Taurus (for stars in the same range of spectral type); the difference in K−[8] colour distributions in the two clusters is highly statistically significant (KS probability of 10−5 of being drawn from the same distribution). IC 348 is apparently then a cluster with a more evolved disc population, consistent also with the fact that it contains a larger population of highly settled discs.
Fig. 3 also allows us to distinguish between different categories of partially cleared discs. All objects that are detected at 24 μm lie in the domain of the two-colour diagram corresponding to discs with cleared inner holes. It is unfortunate that, given the high nebula background emission in IC 348, there are many sources that are undetected at 24 μm and for which we cannot therefore assess whether they are inner hole sources or those undergoing uniform draining. The maximum possible fraction of partially cleared sources which could conceivably be uniform draining (on the extreme assumption that all undetected sources are uniform draining) is around a half. We conclude therefore that the dominant clearing channel in IC 348 is by inner hole creation. We also note that in regions where the sensitivity at 24 μm would allow sources to be detected on the draining locus (Taurus, η Cha, Chamaeleon, Upper Sco) and where there are collectively around 20 sources that are partially cleared, none is located on the draining locus. This reinforces our view that inside-out clearing is the dominant evolutionary path.
Finally, we stress that although we have shown that the fraction of disc bearing stars that show evidence of partial clearing is significantly higher in IC 348 than in Taurus (by a factor of 3–4), this does not imply that the clearing time-scale is necessarily longer; indeed, it would be surprising if the clearing time-scale did vary from region to region for stars of a given spectral type. A significant difference between IC 348 and Taurus is that in the former case the majority of stars have already lost their discs, and therefore we have been comparing the number of discs in transition with the minority of systems that still possess discs. This fits well with the age difference between IC 348 (4–5 Myr) and Taurus (1.5 Myr). If one instead compares the number of partially cleared discs with the total sample of M3–M5 stars in both regions, we obtain ratios of 31/144 = 21 per cent in IC 348 compared with 8/83 = 10 per cent in Taurus. Given the small numbers involved and the difficulties in categorizing individual marginal objects, especially given photometric uncertainties, it cannot be considered that this is a significant difference. We thus conclude – both in Taurus and in IC 348 – that a typical late-type T Tauri star spends a comparably small fraction of its life in a state of disc clearing (10–20 per cent). Our results thus confirm that disc clearing is rapid (a few times 105 yr) from the inside-out and further motivate the development of models that satisfy these criteria.
Note that we use the term ‘uniform draining’ for scenario (i); in essence, this is the same situation that is termed ‘homologously depletion’ by Currie & Kenyon (2009). We however use a separate term so that we can use the label ‘homologously depleted’ for those sources classified as such by Currie & Kenyon (2009): these do not necessarily lie on our model tracks for uniform draining.
The magenta line represents the evolution of a uniformly draining flared disc viewed at large inclination angle (cos i = 0.05) which appears in the plot only at the point where the optical extinction to the star has fallen to Av<10. Because this system is viewed almost edge-on, this point is only reached once the disc has drained to very low surface densities: adopting the same disc draining model as described above, this point is reached at very late times (∼10 Gyr), thus emphasizing yet more the necessity of some accelerated draining at late times. It is notable, leaving the time-scale issue aside, that even such an extreme disc evolves along the common draining locus once the central star becomes optically visible.
Luhman et al. list values of the spectral slope α, where

BE acknowledges support from an STFC Advanced Fellowship. We thank Nathan Mayne for helpful discussion with regards to relative age-dating of clusters.
REFERENCES
