


Abstract
Nova Oph 2009 (V2672 Oph) reached maximum brightness V= 11.35 on 2009 August 16.5. With observed t2(V) = 2.3 and t3(V) = 4.2 d decline times, it is one of the fastest known novae, being rivalled only by V1500 Cyg (1975) and V838 Her (1991) among classical novae, and U Sco among the recurrent ones. The line of sight to the nova passes within a few degrees of the Galactic Centre. The reddening of V2672 Oph is E(B−V) = 1.6 ± 0.1, and its distance d∼ 19 kpc places it on the other side of the Galactic Centre at a galactocentric distance larger than the solar one. The lack of an infrared counterpart for the progenitor excludes the donor star from being a cool giant like in RS Oph or T CrB. With close similarity to U Sco, V2672 Oph displayed a photometric plateau phase, a He/N spectrum classification, extreme expansion velocities and triple peaked emission-line profiles during advanced decline. The full width at zero intensity of Hα was 12 000 km s−1 at maximum, and declined linearly in time with a slope very similar to that observed in U Sco. The properties displayed by V2672 Oph lead us to infer a mass of its white dwarf close to the Chandrasekhar limit and a possible final fate as a Type Ia supernova. Morpho-kinematical modelling of the evolution of the Hα profile suggests that the overall structure of the ejecta is that of a prolate system with polar blobs and an equatorial ring. The density in the prolate system appeared to decline faster than that in the other components. V2672 Oph is seen pole-on, with an inclination of 0°± 6° and an expansion velocity of the polar blobs of 4800+900−800 km s−1. On the basis of its remarkable similarity to U Sco, we suspect this nova may be a recurrent. Given the southern declination, the faintness at maximum, the extremely rapid decline and its close proximity to the ecliptic, it is quite possible that previous outbursts of V2672 Oph have been missed.
1 INTRODUCTION
Nova Oph 2009 (V2672 Oph) was discovered by K. Itagaki on August 16.515 ut at mag 10.0 on unfiltered CCD images (cf. Nakano, Yamaoka & Kadota 2009), at position (J2000)  . This corresponds to Galactic coordinates l = 001.021, b=+02.535, thus V2672 Oph lies very close to the direction to the Galactic Centre.
Spectroscopic confirmation was obtained on August 17.6 ut by Ayani et al. (2009) and on August 17.8 ut by Munari et al. (2009). Both reported a very large velocity width for Hα and the paucity of other emission lines on a red and featureless continuum. Munari et al. (2009) noted the great strength of interstellar lines and diffuse interstellar bands, which indicated a large reddening and therefore accounted for the red slope of the continuum of the nova. Munari et al. (2009) also noted how the profile of the emission lines was highly structured, in the form of a broad trapezium with a sharper Gaussian on top. The trapezium had a velocity width of ∼11700 km s−1 at the base and ∼6900 km s−1 at the top, while the sharp Gaussian component had a full width at half-maximum (FWHM) of ∼1400 km s−1. They also noted how the colours, the rapid decline and the velocity of the ejecta suggested that V2672 Oph was an outburst occurring on a massive white dwarf, not dissimilar to the U Sco type of recurrent novae, and that a search in plate archives for missed previous outbursts could pay dividends.
A report on an early X-ray detection and following evolution of V2672 Oph was provided by Schwarz et al. (2009). Their August 17.948 observation with the Swift satellite detected the nova with both the X-Ray Telescope (XRT) and Ultraviolet/Optical Telescope (UVOT) instruments. Further observations on the following days found the nova to emit at a stable X-ray flux level, while rapidly declining at ultraviolet wavelengths. Schwarz et al. (2009) suggested that the early hard X-ray emission was likely due to shocks between the fast ejecta and a pre-existing circumstellar medium (as in the recurrent nova RS Oph – e.g. Bode et al. 2006) or intra-ejecta shocks (as in the very fast classical nova V838 Her; O'Brien, Lloyd & Bode 1994). Schwarz et al. (2009) also looked for past X-ray observations in the field, and concluded that V2672 Oph was not recorded as an X-ray source prior to the 2009 outburst. They also noted how the nova was not detected in gamma-rays by INTEGRAL/Imager on-board the INTEGRAL Satellite (IBIS) during Galactic bulge monitoring observations taken on 2009 August 20 and 23/24.
Krauss Hartman, Rupen & Mioduszewski (2009) reported their detection of radio emission from V2672 Oph during the first two weeks after optical maximum. The radio emission from most novae is dominated by thermal bremsstrahlung which is optically thick at early times, leading to a dependence of the flux on frequency as Fν∝ν+α, where α∼ 1 –2 at early times. They detected V2672 Oph at 8.46 GHz with the Very Large Array (VLA) on September 1.13, but obtained no detection at 22.46 GHz 2 d later, on September 3.18. Krauss Hartman et al. (2009) concluded that this was best explained by a synchrotron origin for the radio emission observed from V2672 Oph. To support this view, they noted that (i) the strong shocks in its ejecta, suggested by the hard X-ray emission, can also be the source for the relativistic electrons and strong magnetic fields needed to generate synchrotron radiation, and that (ii) the recurrent nova RS Oph shows strong radio synchrotron emission within days of the outburst (e.g. Padin, Davis & Bode 1985; O'Brien et al. 2006; Eyres et al. 2009).
The peculiarity and rarity of the phenomena displayed by V2672 Oph is evident from these early preliminary accounts. In this paper we report our optical observations that have allowed us to derive the photometric and spectroscopic evolution and the basic properties of V2672 Oph, and which are used to perform morpho-kinematical modelling of the emission-line profiles and hence disentangle the basic components of the expanding ejecta.
2 OBSERVATIONS
Photometric observations of V2672 Oph have been obtained with two instruments in collaboration with S. Dallaporta, A. Frigo, A. Siviero, S. Tomaselli, A. Maitan and S. Moretti of ANS Collaboration. The first is a 0.25-m Meade LX-200 Schmidt–Cassegrain telescope located in Cembra (Trento, Italy). It is equipped with an SBIG ST-8 CCD camera, 1530 × 1020 array, 9 μm pixels ≡ 0.74 arcsec pixel−1, with a field of view of 19 × 13 arcmin2. The B V RCIC filters are from Schuler. The other one is a 0.25-m f/6 Ritchey–Chretien robotic telescope, part of the GRAS network (GRAS15, Australia). It carries an SBIG ST-10XME CCD camera 2184 × 1472 array, 6.8 μm pixels ≡ 0.93 arcsec pixel−1, with a field of view of 34 × 23 arcmin2. The B V RCIC filters are again from Schuler. The calibration of photometric zero-points and colour equations have been carried out against the Landolt (1983, 1992, 2009) equatorial standards. The photometric data are presented in Table 1. The total error budget (dominated by the Poissonian noise, with only a minor contribution from the uncertainty of the transformation to the Landolt system of equatorial standards) does not exceed 0.035 mag for all points.
Our B V RCIC photometry of V2672 Oph. The first column is the ut date in 2009 August. The second column gives the heliocentric Julian day – 245 5000.
| Date | HJD | V | B−V | V−RC | V−IC | RC−IC |
| 17.473 | 60.9727 | 12.466 | 1.777 | 1.619 | 2.737 | 1.137 |
| 17.801 | 61.3014 | 12.722 | 1.772 | 1.596 | 2.699 | 1.075 |
| 18.499 | 61.9988 | 13.200 | 1.735 | 1.677 | 2.619 | 0.977 |
| 18.816 | 62.3162 | 13.320 | 1.770 | 1.694 | 2.542 | 0.906 |
| 20.820 | 64.3196 | 14.417 | 1.652 | 2.445 | 0.864 | |
| 22.834 | 66.3336 | 15.871 | 2.684 | |||
| 23.819 | 67.3193 | 15.839 | 1.600 | 2.417 | 0.849 | |
| 24.823 | 68.3231 | 15.923 | 1.421 | 2.215 | 0.819 | |
| 25.816 | 69.3160 | 16.342 | 1.529 | 2.351 | 0.846 |
Spectroscopic observations of V2672 Oph were obtained with two telescopes, in collaboration with P. Valisa, V. Luppi and P. Ochner of ANS Collaboration. A journal of the observations is given in Table 2. The 0.6-m telescope of the Schiaparelli observatory in Varese (Italy) is equipped with a multimode spectrograph (Echelle + single dispersion modes) and a SBIG ST10-XME CCD camera (2184 × 1472 array, 6.8 μm pixels). It was used to obtain low-resolution, wide wavelength range spectra. The Asiago 1.22-m telescope feeds light to a B&C spectrograph, equipped with a 1200 line mm−1 grating and ANDOR iDus 440A CCD camera (EEV 42-10BU back illuminated chip, 2048 × 512 pixels, 13.5 μm in size). It was used to obtain the higher resolution spectra around Hα. The spectra collected with both telescopes were calibrated into absolute fluxes by observations of several spectrophotometric standards, which were observed at airmasses close to those of V2672 Oph. The zero-points and slopes of the absolutely fluxed spectra were checked against the photometry of Table 1, by integrating the spectral flux through the B V RC photometric bands. The error on the fluxes of our spectra turned out not to exceed 9 per cent over the wavelength range covered.
Journal of the spectroscopic observations. The time in the third column is counted from maximum brightness on August 16.515 ut.
| Date | ut | Δt (d) | Expt (s) | Disp (Å pixel−1) | λ range (Å) | Tel. |
| August 17 | 19:52 | +1.31 | 1800 | 0.60 | 5575–6805 | 1.22-m |
| August 17 | 20:28 | +1.34 | 1500 | 2.12 | 4000–8625 | 0.6-m |
| August 18 | 20:31 | +2.34 | 1200 | 0.60 | 5575–6805 | 1.22-m |
| August 19 | 20:28 | +3.34 | 2400 | 0.60 | 5590–6810 | 1.22-m |
| August 19 | 20:56 | +3.36 | 1800 | 2.12 | 4010–8650 | 0.6-m |
| August 20 | 20:11 | +4.33 | 1800 | 4.24 | 4010–8650 | 0.6-m |
| August 21 | 19:52 | +5.31 | 1800 | 0.60 | 5540–6775 | 1.22-m |
| August 24 | 20:11 | +8.33 | 3600 | 0.60 | 5525–6760 | 1.22-m |
3 PHOTOMETRIC EVOLUTION
The photometric evolution of V2672 Oph is presented in Fig. 1. The light and colour curves of Fig. 1 were obtained by combining our data in Table 1 with other sources as follows.
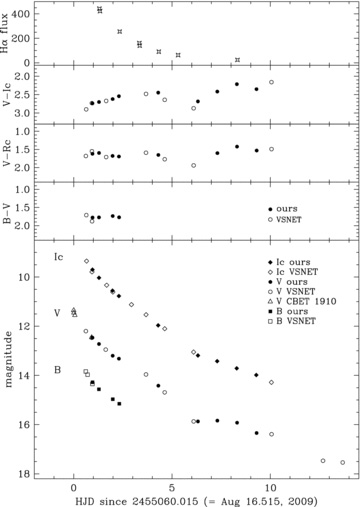
Photometric evolution of V2672 Oph. The integrated Hα flux in the top panel is in units of 10−13 erg cm−2 s−1 Å−1.
The unfiltered CCD photometry obtained around the time of discovery by various Japanese observers and reported by Nakano et al. (2009) was scaled to V band by adding +1.35 mag. The Japanese amateurs usually calibrate their unfiltered photometry against the RC values of field stars taken from the USNO-B catalogue. As illustrated in Table 1 and Fig. 1, V−RC displayed by V2672 Oph has remained fairly stable over the initial photometric evolution. Thus the application of the same shift to all data by Nakano et al. (2009) seems reasonable. The amount of the shift has been derived by comparison with simultaneous V-band values from Table 1.
Members of the VSNET1 Japanese amateur organisation performed some CCD filter photometry. This photometry is usually not corrected for colour equations and linked to non-specified calibration stars. Given the very red colours of V2672 Oph, this introduces large shifts. By comparison with the photometry in Table 1, we found the following correction to VSNET data: B=BVSNET+ 0.31, V=VVSNET+ 0.29, RC=RVSNET+ 0.10 and IC=IVSNET+ 0.05. We have applied these to the VSNET data and plotted them in Fig. 1.
3.1 Maximum and early decline
V2672 Oph was probably discovered quite close to maximum brightness. The earliest observations given by Nakano et al. (2009) report the nova at V = 11.35, 11.45 and 11.55 on August 16.515, 16.526 and 16.576, respectively. This would correspond to an extremely fast decline of 3.3 mag in 1 d, something that U Sco (the fastest known recurrent nova; Schaefer 2010) displays only during the first hours past true maximum, before slowing down to a decline time t2(V) ≈ 2.0 d (Munari, Dallaporta & Castellani 2010a). A patrol observation on August 14.142 (2.373 d before discovery; Nakano et al. 2009) recorded the nova fainter than V = 14.0 limiting magnitude. In the rest of this paper, we will assume that the time of discovery, August 16.515, coincides with the time of maximum optical brightness.
After declining past t3(V), V2672 Oph displayed an inflection in its light curve, easily visible in Fig. 1, and far more pronounced in V than in IC. Around day +4.5, the nova started to decline faster than expected from smooth extrapolation of the preceding portion of the light curve. The maximum deviation was reached around day +5.8, when V2672 Oph became ΔV∼ 0.85 mag fainter and ΔV−IC∼ 0.6 mag redder than the smooth extrapolation of the light and colour curves of Fig. 1. By day +8 the inflection was over and V2672 Oph had returned to its smooth decline.
The nature of this inflection, which lasted for ∼3.5 d, is unknown. The only spectroscopic observation secured during this period is an Hα profile which is of no great help, it follows the line-profile evolution described later in this paper. Even if occurring around t3, when dusty novae start to condense grains in their ejecta, the interpretation of the inflection in terms of small-scale dust condensation in the ejecta of V2672 Oph conflicts with the fact the grains should have condensed, grown in size and diluted at a speed much faster than observed in dusty novae, to complete their photometric life cycle in just 3.5 d.
3.2 Reddening
The very red colours of V2672 Oph suggest a high reddening. This is confirmed by the intensity of the Na i D1, D2 interstellar lines and of the 5780, 5797, 5850, 6270 and 6614 Å diffuse interstellar bands (DIBs) recorded in our spectra (see later).
The Na i D1, D2 interstellar lines cannot be used because their very large equivalent width (EW) indicates they are largely oversaturated (cf. Munari & Zwitter 1997). They must be the result of the blend of several individual components, as it is reasonable to expect given the line-of-sight passing close to the Galactic Centre. Our spectra lack high enough resolution to resolve the individual components and thus to check if they are individually saturated or not.
The best measurable DIB for V2672 Oph is the one at 6614 Å (identified in Fig. 8). It appears superimposed against the very broad and strong Hα profile, which provides a good contrast background. The other DIBs are instead recorded on to a weak, and therefore more noisy continuum, which makes the measurement of their EWs rather uncertain. The EW of the 6614 Å DIB on the day +1.31 spectrum is 0.30 ± 0.02 Å. By comparison with the relation E(B−V) = 5.3 × EW(Å) calibrated by Munari (2010) between reddening and the EW of the 6614 Å DIB, a reddening E(B−V) ∼ 1.6 can be derived for V2672 Oph.
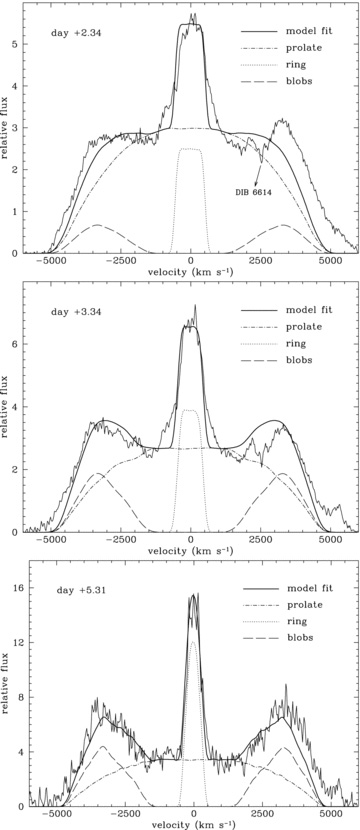
Early evolution of the Hα profile and fitting by model spectra (see Fig. 7 for further information).
van den Bergh & Younger (1987) derived a mean intrinsic colour (B−V)○=+0.23 ± 0.06 for novae at maximum, and (B−V)○=−0.02 ± 0.04 for novae at t2. V2672 Oph displayed B−V=+1.77 at t2, to which would correspond E(B−V) ∼ 1.79. The flat B−V evolution in Fig. 1 suggests that a similar B−V=+1.77 could hold for V2672 Oph also at maximum brightness, with a corresponding E(B−V) ∼ 1.54.
3.3 Distance and peculiar location in the Galaxy
Another peculiarity of V2672 Oph and its position is the z = 0.8 kpc height above the galactic plane. della Valle & Livio (1998) found that He/N novae, such as V2672 Oph (see Section 4), belong to the disc population of the Galaxy and are located at small heights above the Galactic plane. While V2672 Oph is undoubtedly away from the bulge, its height above the Galactic plane is difficult to reconcile with the z≤ 100 –200 pc found by della Valle & Livio (1998) for He/N novae. The proportion of He/N novae characterized by high z is becoming uncomfortably large in comparison with the della Valle & Livio (1998) scaleheight – other recent high-z examples being V2491 Cyg ( = Nova Cyg 2008 N.2) at z = 1.1 kpc (Munari et al. 2010b) and V477 Sct ( = Nova Sct 2005 N2), located at z = 0.6 kpc (Munari et al. 2006).
3.4 The plateau phase and comparison with U Sco
The light curves of V2672 Oph and U Sco (its 2010 outburst) are compared in Fig. 2. The match is remarkable, with the exception of the inflection displayed by V2672 Oph around day +5.8 and described in Section 3.1, which has no counterpart in U Sco.
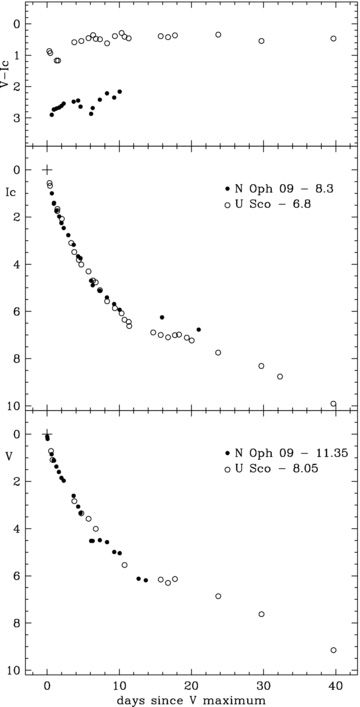
Comparison between the photometric evolutions of V2672 Oph and U Sco during its 2010 outburst (from Munari et al. 2010a). The V and IC light curves are scaled by the given quantities to coincide at their optical maxima (see text for details), marked by the cross point at (0,0).
The strict similarity extends also to later phases, when U Sco displayed a plateau phase. Hachisu et al. (2000, 2002) and Hachisu, Kato & Schaefer (2003) have postulated that a plateau is characteristic of recurrent novae, and in particular of the U Sco subclass of recurrent novae, a position shared by Schaefer (2010). Their idea is that the plateau is caused by the combination of a slightly irradiated companion star and a fully irradiated flared disc with a radius 1.4 times the Roche lobe size. At the time of the plateau, the outbursting white dwarf is experiencing stable nuclear burning and supersoft X-ray emission. The irradiation of the disc and the companion by a stable central engine leads to a fairly constant flux added to that steadily declining from the expanding ejecta. This leads to a flattening of the light curve (the plateau), which lasts until the time when the nuclear burning turns off.
The plateau phase of V2672 Oph is well seen in the IC light curve of Fig. 2. Unfortunately, the observations in the V band stopped due to the faintness of the nova right at the time when it was entering the plateau phase. There are just two observations defining the plateau of V2672 Oph, but they support a close similarity with the plateau of U Sco that lasted from day +12 to day +19. During that period U Sco was found to be – as predicted – a bright supersoft X-ray source (Osborne et al. 2010; Schlegel et al. 2010).
The plateau for V2672 Oph is ΔIC = 0.6 mag brighter than in U Sco as illustrated in Fig. 2, while the V-band panel seems to support instead a similar brightness level. We do not attach much significance to the ΔIC offset. It could be connected to differences in the irradiated discs and secondaries between V2672 Oph and U Sco.
The mass of the white dwarf of U Sco is believed to be very close to the Chandrasekhar limit (Kato & Hachisu 1989; Hachisu et al. 2000; Thoroughgood et al. 2001), and thus, if net mass is being added over time to the white dwarf, it is a prime candidate for explosion as a Type Ia supernova (SNIa). The great similarity of all observational parameters between U Sco and V2672 Oph leads us to infer an equally massive white dwarf also in the latter, and an additional candidate for a future Galactic SNIa.
3.5 The progenitor
The progenitor of V2672 Oph had no recorded optical or infrared counterpart in Two Micron All Sky Survey (2MASS) and SDSS. If the donor star is an M0 giant as in the recurrent nova RS Oph, and the parent population of V2672 Oph is the Galactic disc, then its observed infrared magnitude and colour should be Ks∼12.3 and J−Ks = 1.8, or Ks∼ 10.3 and J−Ks = 2.0 if the donor star is an M5 giant as in the other recurrent nova T CrB.
There are only three 2MASS sources within 13 arcsec of the astrometric position of V2672 Oph: 2MASS 17382110−2644114 lies 5.6 arcsec away and has Ks = 12.1 and J−Ks = 1.67; 2MASS 17382076−2644079 is 5.5 arcsec away with Ks = 10.3 and J−Ks = 1.69; 2MASS 17382052−2644184 lies at a distance of 5.2 arcsec and has Ks = 13.2 and J−Ks = 1.39. While the third source appears too blue, the first two could broadly agree with an M giant at the distance and reddening of V2672 Oph. Their positions, however, are not reconcilable with V2672 Oph. Nakano et al. (2009) lists five independent and accurate measurements for the astrometric position of the nova. If σ is the rms of these five measurements, then all these three 2MASS sources are more distant than 10σ from the mean astrometric position of the nova.
Hanes (1985) derived a G0V spectral type for the donor star in U Sco, shining in quiescence at K = 16.45, J−K = 0.43. Closely similar values were later measured by the 2MASS. Such a donor star for V2672 Oph would put it far below the detection thresholds of both 2MASS and SDSS.
We may thus conclude that the donor star in V2672 Oph is not a cool giant as in RS Oph and T CrB, but much more likely a dwarf as in recurrent novae of the U Sco type and in most classical novae. Its orbital period should therefore be of the order of days, and not months or years.
4 SPECTRAL EVOLUTION
Only a few spectral lines are usually recognizable on spectra of novae characterized by very large expansion velocities. This is caused by the large blending of individual lines that wash them out into the underlying continuum energy distribution. V2672 Oph is no exception to this rule as illustrated by its spectral evolution presented in Fig. 3. Only Hα and O i 8446 Å stand out prominently, while all other lines emerge only weakly from the underlying continuum. Table 3 reports the absolute fluxes for emission lines that we were able to recognize and measure with confidence.
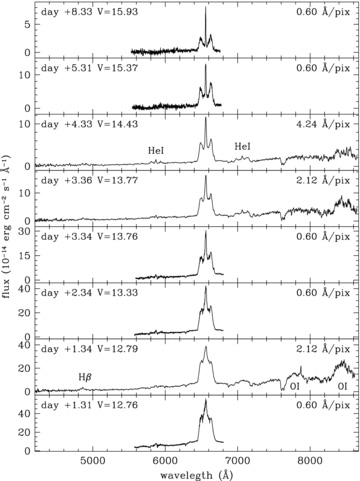
Spectroscopic evolution of V2672 Oph.
Integrated fluxes of emission lines (in units of 10−13 erg cm−2 s−1 Å−1).
| Day | Hγ | Hβ | N ii 5675 | He i 5876 | Hα | He i 7065 | O i 7774 | O i 8446 |
| +1.31 | 443 | |||||||
| +1.34 | 1.83 | 12.2 | 6.05 | 11.2 | 422 | 21.7 | 80 | 186 |
| +2.34 | 255 | |||||||
| +3.34 | 161 | |||||||
| +3.36 | 3.75 | 5.45 | 140 | 15.0 | 80 | |||
| +4.33 | 2.53 | 4.32 | 91 | 13.0 | 32 | |||
| +5.31 | 63 | |||||||
| +8.33 | 24 |
The spectra of V2672 Oph classify it among He/N novae, as is usually the case for fast novae. The general appearance of the V2672 Oph spectra is very similar to those of U Sco, once the reddenings of the two objects are matched, as illustrated in Figs 3 and 4.
Sample spectra from the 1999 outburst of U Sco to highlight the similarities with the spectroscopic evolution of V2672 Oph in Fig. 3. The U Sco spectra are from Munari et al. (1999), and their reddening has been set equal to E(B−V) = 1.6 of V2672 Oph.
The top panel of Fig. 1 compares the evolution of the integrated flux of Hα to the photometric one. The decline rate is identical to that of the V-band flux, while it is slower than for IC. This agrees with the V−IC evolution, which is directed toward bluer V−IC colours. The Hα contributes less than 10 per cent to the V-band flux (as proved by integration of the photometric transmission profile on the spectra as observed and with Hα clipped), and this prevents the equality of V band and Hα decline rates from turning into a circular argument. The decline of Hα flux gradually accelerated from F∝t−0.9 of early data points in Table 3 to F∝t−2.1 for the latest ones. This agrees with the expectation of F∝t−3 to characterize the latest evolutionary phases when the Hα emissivity settles on the dilution time-scale. The He i/Hα intensity ratio doubled from day +1.34 to day +4.33, as expected for an excitation increasing during decline from maximum and for case B, still higher than reddening suggests. The Hα/Hβ flux ratio remained constant at 35 between these two dates, a very high value affected by the large reddening to this nova.
The intensity of the O i 8446 Å emission line under normal recombination, optically thin conditions should be appreciably weaker than the O i 7772 line, 0.6 times its flux. On day +1.34 the reddening-corrected ratio was 1.63. The inversion in intensity between the two O i lines is usually associated with fluorescence pumped by absorption of hydrogen Lyman β photons, as first pointed out by Bowen (1947). For the Lyman β fluorescence to be effective, the optical depth in Hα should be large, presumably owing to the population of the n = 2 level by trapped Lyman α photons. The large optical depth in Hα is confirmed also by the F8446/FHα flux ratio that under optically thin, low-ionization conditions and typical nova chemical abundances should be quite low, of the order of ∼10−3 (Strittmatter et al. 1977). The reddening corrected ratios for days +1.34, +3.36 and +4.33 are, respectively, 0.14, 0.18 and 0.11, indicating a persisting large optical depth in Hα during the pre-plateau evolution of V2672 Oph.
A striking feature of V2672 Oph, and once again a matter of close similarity with U Sco, is the very large width of its emission lines and how it evolved with time. The temporal dependence of the full width at zero intensity (FWZI) of the Hα emission in V2672 Oph is shown in Fig. 5, where the EW for U Sco are taken from Munari et al. (1999). The temporal behaviour for the two novae is identical, with a linear decline of ∼250 km s−1 per day, and a starting value of 12 000 km s−1 for V2672 Oph, about 2000 km s−1 larger than in U Sco and 4000 km s−1 larger than in RS Oph (Munari et al. 2007). The FWZI depends mainly on the outermost ejecta, those ejected with the largest velocity. Compared with the inner ejecta, the outer ones experience a more rapid decline in electron density and a large dilution of the ionizing radiation from the central source. Consequently the emission of the faster moving ejecta declines faster than that of the inner ejecta, which results in a progressive reduction in the width of the emission lines.
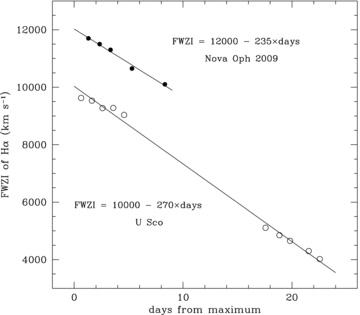
Comparison between the decline with time of the FWZI of Hα for V2672 Oph and U Sco.
5 ON THE PROBABLE NATURE OF V2672 Oph AS A RECURRENT NOVA
Such a strict photometric and spectroscopic similarity with U Sco leads us to speculate that V2672 Oph is itself a recurrent nova. However, only one outburst has been recorded for V2672 Oph, but it is highly probable that several others have been missed due to the following reasons: (1) V2672 Oph lies less than 4° away from the ecliptic, and thus suffers from periods of long seasonal invisibility due to the conjunction with the Sun. Furthermore, at every lunation it also suffers from the proximity to the Moon; (2) its δ=− 26°44′ southern declination means that it is only observable for a brief fraction of the year by northern latitudes where most observers have been historically concentrated; (3) the faint peak brightness attained by V2672 Oph (V∼ 11.35, B∼ 13.1) means that it would have remained outside the range of detection by patrol surveys until very recently, when the introduction of large format CCDs allowed coverage of significant areas of the sky with short focal length telescopes. In fact, V2672 Oph was discovered by K. Itagaki using a 0.21-m f/3 reflector, a light collector far more sensitive that the usual digital single-lens reflex (SLR) cameras used by Japanese amateurs to discover Galactic novae and (4) a decline time t2(V) = 2.3 d means that the nova would have returned below the threshold for discovery (V∼ 14) in just 3 d.
Given all these restrictions, it is indeed surprising that even this outburst of V2672 Oph has been discovered. The central region of the Galaxy has been imaged many times especially by amateurs looking for impressive pictures. It is quite possible that other outbursts of V2672 Oph lie undetected on such archive images, especially those imaging into red wavelengths. A devoted search is highly encouraged. It is less probable that an outburst could be discovered by inspection of historical plate archives. In fact, the B∼ 13.1 mag attained at maximum, places V2672 Oph below the limiting magnitude of most patrol plates collected worldwide in the past.
6 MORPHO-KINEMATICAL MODELLING OF THE Hα PROFILE
Using the morpho-kinematical code shape2 (version 3.56; Steffen & López 2006; Steffen et al. 2010) we have analysed and disentangled the three-dimensional geometry and kinematic structure of the early outburst spectra of V2672 Oph. shape was originally developed to model the complex structures of planetary nebulae and is based on computationally efficient mathematical representations of the visual world which allows for the construction of objects placed at any orientation in a cubic volume. shape has been developed so far for modelling optically thin environments, therefore, one must make the assumption that for what is observed the optical depth is low and that absorption has not altered greatly the shape of the profile.
The adopted model is based on previous studies of classical novae, which explored the structures of classical novae from resolved optical imaging and hydrodynamical modelling (e.g. Slavin, O'Brien & Dunlop 1995; Lloyd, O'Brien & Bode 1997).
6.1 Initial information
We performed Gaussian fitting using the iraf task specfit on days +2.34 through +8.33 after outburst. These allow us to decompose different Gaussian components of the Hα line and retrieve information such as the FWHM of likely components and their radial velocity displacements (Table 4). We note the presence of the DIB at 6614 Å (see Fig. 8 and Section 3.2), which is not considered during detailed modelling given its small EW.
Results of Gaussian fitting to observed spectra. Shown are the observation dates, including time since outburst, and individual components FWHM and radial velocity displacement in km s−1. Components 1 and 4 relate to the polar blobs, component 2 to the equatorial ring and component 3 to the prolate structure described in Section 6.2.
| Day | Component 1 | Component 2 | Component 3 | Component 4 | ||||
| FWHM | Radial | FWHM | Radial | FWHM | Radial | FWHM | Radial | |
| +2.34 | 2128 | −3422 | 982 | −177 | 3791 | −177 | 2258 | 3251 |
| +3.34 | 2152 | −3466 | 844 | −220 | 3717 | −220 | 2172 | 3116 |
| +5.31 | 2310 | −3425 | 528 | −225 | 3083 | −225 | 2319 | 3066 |
| +8.33 | 2283 | −3361 | 333 | −251 | 3598 | −251 | 2314 | 2994 |
The values derived in Table 4 are used to find the displacement of the system from the rest wavelength of the Hα line and to determine the size of the remnant using the values for the FWHM and radial velocity displacement of component 1.
The photocentric velocity of the Hα profiles in Figs 7 and 8 decreases from −19 km s−1 on day +2.34 to −146 km s−1 on day +8.33. Similarly, the velocity of the fitted equatorial ring and prolate component in Table 4 decreases from −177 to −251 km s−1. These velocities are probably unrelated to the systemic velocity of the nova. The systemic velocity would be such a small fraction (less than 2 per cent) of the huge width of Hα to make unrealistic any hope to detect it: velocity offsets are likely to appear for tiny deviations from perfect point symmetry of the Hα emissivity distribution within the ejecta. In addition, any absorption within the ejecta would decrease the flux received from the receding part, introducing a blueshift of the photometric barycentre of the line.
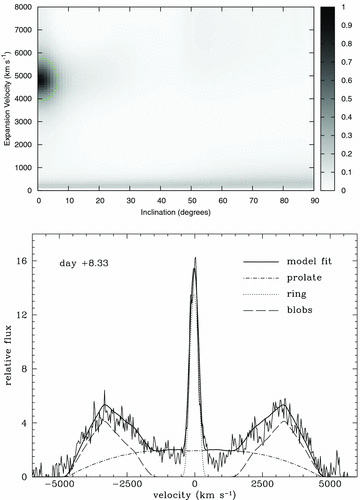
Top: image displaying results of a  fit comparing the observed spectrum with the model spectrum for different inclinations and velocities. The grey-scale represents the probability that the observed
  value is correct. Also shown is the 1σ level contour (dashed green line). Bottom: the observed spectrum for day +8.33 and the best-fitting model spectrum. The components of the model fit (prolate region, polar blobs and equatorial ring) are also shown.
6.2 Modelling
We used information in Table 4 to guide our initial modelling and e.g. constrain a physical size for the remnant. The derivation of the proposed structure of the system was aided from work being undertaken by the authors for V2491 Cyg (Ribeiro et al., in preparation). Here we explore a combination of structures with polar blobs and equatorial ring, prolate structure with equatorial rings, prolate structure with tropical rings (e.g. Hutchings 1972; Solf 1983; Slavin et al. 1995) and a structure similar to RS Ophiuchi as suggested by Ribeiro et al. (2009). The parameter space is sampled for inclinations from 0° to 90°, and velocities from 100 to 8000 km s−1. Our models of V2491 Cyg produced synthetic spectra for various combinations of parameters and this allowed us to compare the spectra observed here to initially place constraints on the overall structure.
We note that there is evidence of significant Hα optical depth at early time as derived in Section 4. The modelling of the V2672 Oph spectra thus initially focused on day +8.33 after outburst because at this time we assume that the Hα line is least optically thick. In fact, the symmetry of the line is compatible with being optically thin at this time. The assumed physical size of the object was taken only from component 1 in Table 4 because it is assumed that the blue side of the line suffers less self-absorption than the red.
Work by Slavin et al. (1995), and later updated in Bode (2002), of several novae suggested that the remnants could be classified into two broad groups defined by the speed class of the nova. Slavin et al. (1995) showed that the axial ratio (the ratio of the lengths of the major and minor axes of the nova shell) and the speed class (t3 time) were correlated. It was shown that novae with fast decline from maximum light demonstrate a lower degree of remnant shaping than slow novae and therefore we account for this when considering the overall geometry of our system. A ratio of 1.15 for the semimajor axes versus semiminor axis was taken as an estimate from the nova's speed class.
The suggested structure for the remnant was that of polar blobs and an equatorial ring with a low-density prolate structure surrounding these two. The low-density prolate structure is used to account for some of the lower velocities observed in the spectra. We sample the whole of parameter space for the inclination of the system from 0° to 90° (in 1° steps), where an inclination of 0° is for the material expanding along the semimajor axis being in the line of sight (Fig. 6). We also explored the velocity range available for nova explosions from 100 to 8000 km s−1 (in 100 km s−1 steps), assuming a Hubble-flow-like velocity field.
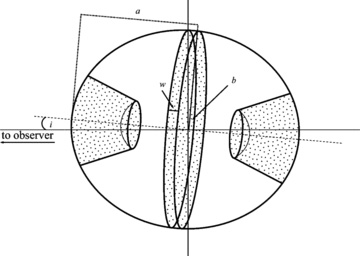
Two-dimensional representation of the three-dimensional expanding structure of the V2672 Oph remnant. The overall structure is that of a prolate system with polar blobs and an equatorial ring. The shaded areas represent areas of high density. The semimajor axis (a) is larger than the semiminor axis (b) by 15 per cent. The width of the ring is designated w. The inclination of the system (i) is defined as the angle between the line of sight to the observer and the semimajor axis.
6.3 Results
The observed spectrum and the model spectra for each of the inclinations and velocities were compared to find the best fit via a  test (Fig. 7, top). We derive the best-fitting inclination and maximum expansion velocity (at the poles) as 0°± 6° and 4800+900−800 km s−1, respectively (1σ confidence intervals).
Fig. 7 also shows the best-fitting model spectra and the contribution of each individual component to the overall model spectrum. Just taking a model with polar blobs and an equatorial ring did not match the overall line profile. The radial thickness of the polar blobs and equatorial ring were determined by the FWHM shown in Table 4. Even adjusting the densities in each component the model spectrum would not fully replicate the observed spectrum. We therefore introduced a filled prolate structure as an additional component (see Fig. 6). This would be associated with material ejected more isotropically than that in the ring or blobs. Furthermore, a filled structure can be reconciled with the assumption that at this stage the post-outburst wind phase and the ejection of the envelope are still ongoing (e.g. della Valle et al. 2002; Ribeiro et al., in preparation).
We then evolved the overall structure fitted on day +8.33 to earlier times assuming a linear expansion and keeping the inclination and expansion velocity constant. As demonstrated in Fig. 8, and Table 4, the observed spectrum shows the central component has higher velocities at earlier times, implying that some deceleration has occurred in this direction as the ejecta expanded.
We then modelled the earlier epoch data (Fig. 8) so that we keep the polar blobs and prolate structure expanding linearly but the ring width (w) was derived from the values in Table 4 for component 2 (with the ratio of the semimajor to semiminor axis kept always as 1.15). The results are shown in Fig. 8.
The assumption of a decelerating ring replicates the spectra well (Fig. 8). The fact that the ring shows a smooth flat top structure compared to the observed spectra is because we do not include small-scale structure in the model. There is also some higher velocity material associated with the wings of the central component that is not reproduced. Furthermore, to better replicate the line profiles it was required that we change the density ratios of the components with time (Table 5). What is evident from the ratio of the densities is that the prolate structure appears to reduce in density compared with the other structures while the blobs initially increase in density compared with the ring then this ratio reduces again at a later time.
Evolution of the implied density ratios for the different model components.
| Day | Blob/prolate | Blob/ring | Prolate/ring |
| +2.34 | 0.80 | 0.89 | 1.11 |
| +3.34 | 2.36 | 1.60 | 0.69 |
| +5.31 | 4.00 | 1.08 | 0.27 |
| +8.33 | 6.40 | 0.84 | 0.13 |
| Day | Blob/prolate | Blob/ring | Prolate/ring |
| +2.34 | 0.80 | 0.89 | 1.11 |
| +3.34 | 2.36 | 1.60 | 0.69 |
| +5.31 | 4.00 | 1.08 | 0.27 |
| +8.33 | 6.40 | 0.84 | 0.13 |
6.4 Discussion
We have constrained an overall structure, inclination and expansion velocity for the nebular remnant in V2672 Oph from modelling the Hα. The inclination and maximum expansion velocity have been derived as 0°± 6° and 4800+900−800 km s−1, respectively. The velocity derived is consistent with the FWZI at this time (Fig. 5). A structure with polar blobs and an equatorial ring sitting within a prolate morphology replicates the spectra well. In classical nova systems, however, a structure with polar blobs and an equatorial ring originates in systems with low ejecta expansion velocity associated with slow speed class (e.g. Lloyd et al. 1997).
The density variations in Table 5 indicate that the prolate structure quickly reduces in relative density. While for example, the blobs initially have lower density than the ring, this ratio then increases, possibly due to the interaction of the ring material with any pre-existing equatorial material, only to decrease again later. Some caution should be exercised here in over-interpretation of these results as more detailed models, incorporating changes in line optical depths and ionization structures are required.
7 CONCLUSIONS AND SUMMARY
We have presented tentative evidence that V2672 Oph is most likely a recurrent nova similar to U Sco. This is inferred by their similar photometric and spectroscopic evolution and by the equally very large expansion velocities. Both novae exhibit a very fast decline from maximum, a plateau phase and a He/N spectrum. The FWZI of the Hα line in V2672 Oph and U Sco declined linearly with a closely similar slope. At a distance of 19 kpc and a reddening E(B−V) + 1.6, the line of sight to V2672 Oph passes close to the Galactic Centre, crosses the whole bulge and ends at a galactocentric distance larger than that of the Sun. This is probably a record distance and position among known novae. The absence of a 2MASS counterpart suggests the progenitor is not a cool giant, as in RS Oph and T CrB, but much more likely a dwarf as in U Sco type of recurrent novae. Given the southern declination, the faintness at maximum, the extremely rapid decline and its close proximity to the ecliptic, it is quite possible that previous outbursts of V2672 Oph have been missed.
In terms of the morpho-kinematical modelling (a) if V2672 Oph is a recurrent nova the shaping mechanism may be different from that of classical novae. For example, Ribeiro et al. (2009) find RS Oph to have an axial ratio of 3.85 and compared to its fast decline from maximum, the relationship originally found by Slavin et al. (1995) breaks down. The same could be happening here, except that V2672 Oph has a main sequence or subgiant secondary so ejecta/wind interactions such as in RS Oph may not be important, (b) at this early time the formation of the remnant may still be taking place and at later times the remnant could appear more spherical. We note however that most of the shaping occurs in the first few hours in classical novae (Lloyd et al. 1997). This point to the need for better modelling of the evolution of classical novae and recurrent novae from the early to late times. Such work is however greatly aided if we can ultimately spatially resolve their remnants.
Available from http://bufadora.astrosen.unam.mx/shape/
The authors would like to thank W. Steffen and N. Koning for valuable discussions on the use of shape and adding special features to the code. We would like also to thank M. Darnley for useful discussions and the ANS Collaboration observers S. Dallaporta, A. Frigo, A. Siviero, P. Ochner, S. Moretti, A. Maitan, S. Tomaselli, P. Valisa and V. Luppi for providing part of the data discussed in this paper. The authors also would like to thank the anonymous referee for useful comments and Nick Almond for assistance in drawing Fig. 6. VARMR is funded by an STFC studentship.
REFERENCES
