


Abstract
We present a new model for the spectral evolution of pulsar wind nebulae (PWNe) inside supernova remnants (SNRs). The model couples the long-term dynamics of these systems, as derived in the 1D approximation, with a one-zone description (all quantities are assumed uniform in the nebula) of the spectral evolution of the emitting plasma. Our goal is to provide a simplified theoretical description that can be used as a tool to put constraints on unknown properties of PWN-SNR systems: a piece of work that is preliminary to any more accurate and sophisticated modelling. In this paper, we apply the newly developed model to a few objects of different ages and luminosities. We find that an injection spectrum in the form of a broken power law gives a satisfactory description of the emission for all the systems we consider. More surprisingly, we also find that the intrinsic spectral break turns out to be at a similar energy for all sources, in spite of the differences mentioned above. We discuss the implications of our findings on the workings of pulsar magnetospheres, pair multiplicity and on the particle acceleration mechanism(s) that might be at work at the pulsar wind termination shock.
1 INTRODUCTION
Pulsars (PSRs) are known to release most of their rotational energy in the form of a relativistic magnetized wind, whose particle component is mostly made of electron–positron pairs, with, possibly, a small number of ions, while the magnetic field is almost purely toroidal far away from the light cylinder (e.g. Goldreich & Julian 1969). The wind is initially confined by the slowly expanding supernova remnant (SNR), which leads to the formation of a termination shock (TS) at some distance from the PSR and of a bubble of relativistically hot fluid beyond it. This is the so-called pulsar wind nebula (PWN), which shines through synchrotron (SYN) and inverse-Compton (IC) emission from radio wavelengths up to gamma rays.
The typical energy that a PSR injects into the PWN during its entire lifetime is about 10−2 of the typical energy of the supernova (SN) explosion (1051 erg). Therefore, the presence of an energetic PSR has little effect on the global evolution of the SNR. In contrast, the evolution of the PWN strongly depends on its interaction with the SNR (see Section 3).
Modelling of the evolution and dynamical properties of PWN-SNR systems has improved considerably since the pioneering 1D analytical works by Rees & Gunn (1974) and Kennel & Coroniti (1984a). In recent years, the impressive advances in X-ray observations, due to Chandra and XMM–Newton, have led to a renewed interest in these objects. A major effort has been devoted to explaining the observed X-ray properties of the Crab nebula and other young systems through multidimensional time-dependent approaches to their dynamics (Del Zanna, Amato & Bucciantini 2004; Komissarov & Lyubarsky 2004; Del Zanna et al. 2006). Several authors (Blondin, Chevalier & Frierson 2001; van der Swaluw et al. 2001; Bucciantini et al. 2004b; de Jager, Ferreira & Djannati-Ataï 2008) have presented numerical evolutionary models, extended to advanced ages (typically up to ∼105 yr) and to the case of fast moving PSRs (van der Swaluw, Downes & Keegan 2004), but in fact fully multidimensional 3D and/or magnetohydrodynamics (MHD) models are still lacking in these cases. The reason for this is that detailed modelling of older systems is far more difficult and complex than for the young ones. To this one must add the fact that, with respect to a younger system, investigating older ones would require sampling a much larger parameter space. The latter are brighter, hence providing us with high-quality multifrequency data, and are often better constrained in terms of the most relevant physical quantities, such as age, distance and PSR energetics.
The overall evolution of old objects is much more complex than the smooth expansion appropriate to describe young systems. In general, even within the most simplistic approach, the long-term evolution of a PWN-SNR system depends on many parameters: the SN energy, the mass of the ejecta, their density structure, the density of the interstellar medium (ISM), the PSR luminosity and its spin-down history (Bucciantini et al. 2004b). A model for particle injection and spectral evolution must be added to all of this, if the aim is that of deriving information from direct comparison with observations. At present, multidimensional numerical simulations are not suitable to properly investigate the large parameter space that older systems may span.
The situation is actually delicate also for many young systems. Indeed, accurate multidimensional results, including emission maps to be directly compared with observations, have been so far presented only for the Crab Nebula. But this is a very special object, for which measurements are available throughout almost the entire electromagnetic spectrum, and almost all the aforementioned parameters are known, including the age and the PSR rotational history (initial spin frequency and braking index). For other young systems, such as 3C 58 or MSH 15−52, the quantity and quality of information available are much poorer than in the case of Crab and simplified evolutionary models are again the only possible tool for investigation, at least for a start.
Models for the evolution of the emission properties of PWNe have a long history, from the work by Pacini & Salvati (1973) to the most recent developments by de Jager et al. (2008) and Gelfand, Slane & Zhang (2009). These latter works have attempted at taking into account both the dynamics of PWN-SNR systems, as derived from accurate numerical simulations, and the spectral evolution of the particle distribution function. In particular, the work by Gelfand et al. (2009) is exemplary for showing the richness of behaviours that is found even within the one-zone treatment (where all quantities, from the dynamical ones, such as pressure and magnetic field, to the particle distribution function, are assumed to be uniform inside the nebula) and the degree of complexity that one can investigate using simple tools.
While constraining the unknown parameters is preliminary to detailed multidimensional modelling of the systems, which can only sample a much more limited range of parameters, the following question arises: how strong and reliable the results obtained with a one-zone approach are? The recent success of 2D models of PWNe at reproducing so many of the observed features has interesting consequences in this respect in that it lends support to the one-zone description over the 1D approximation. The latter inevitably leads to onion-like structures (Kennel & Coroniti 1984b), where particles injected at earlier times are located at larger radii, with a one-to-one correspondence between the properties of the particle distribution function and the distance from the central PSR. Comparison of multidimensional models with observations has shown that such ordered structure is not what is realized in PWNe, where an overall turbulent flow is injected at the TS and survives throughout most of the nebular extent (Camus et al. 2009). For the typical flow times, which are much smaller than the PWN age, this turbulent flow structure leads to efficient mixing, which is what a one-zone description is based on. This also finds some direct hints from observations where detailed data are available, as in the case of the Crab nebula: the remarkable homogeneity of the radio spectral index across the nebula and the extent of the X-ray emitting region which exceeds the predictions of any simple 1D flow model in the absence of particle diffusion far more efficient than the Bohm rate (Amato et al. 2000).
In the following we present a simplified evolutionary model, similar in spirit to the work by Gelfand et al. (2009). Our approach combines analytical results and numerical simulations for the description of the dynamics of the PWN-SNR system and the evolution of the particle distribution function within the PWN: the key features of the interaction between a PWN and the surrounding SNR are adequately reproduced during different evolutionary stages. The model is here applied to a few systems of various ages, both young and older ones with the aim of showing how this kind of modelling can help the extraction of information on the system properties from multiwavelength observations: we try to clarify how these properties depend on the different parameters, also discussing potential degeneracies and the observations that would best serve to disentangle them.
Special attention is devoted to the particularly interesting and difficult task of constraining the particle injection in PWNe. The relevance of this issue in terms of PSR physics and shock acceleration physics deserves a somewhat extended discussion, which will be the topic of Section 2.
The rest of the paper is organized as follows. Sections 3–5 describe, respectively, how the nebular evolution is implemented in our model, the scheme we adopt to follow the evolution of the particle distribution function and the emission model. In Section 6 we show the application of our model to several objects, and, finally, in Section 7 we discuss the implications of our findings.
2 PARTICLE INJECTION IN PWNe
 is the magnetospheric potential,
  is the spin-down luminosity, with I being the neutron star's moment of inertia (I45=I/1045 g cm2), Ω = 2π/P is the stellar angular velocity and P is the rotation period (P33=P/33 ms). The simplest estimates (Rees & Gunn 1974; Kennel & Coroniti 1984a) show that X-ray emitting PWNe (Kargaltsev & Pavlov 2008) with SYN cooling times of the X-ray emitting particles well less than the nebular ages have electron (and positron) injection rates much larger than shown in equation (1): values reported in the literature for the multiplicity
  are typically ∼104, based on analysis of the X-ray emission, a result consistent with theoretically derived pair creation rates for the young, high voltage PSRs which have been subjected to such analysis (e.g. Kennel & Coroniti 1984a; Hibschman & Arons 2001; Gaensler et al. 2002). Indeed, the fact that the inferred injection rates are this large is one of the major pillars of support for the theoretical conclusion that PSRs have substantial outflows of e±, this being the only known means through which such cool objects can have winds denser than the electrodynamic minimum.
Such high density flows with κ≫ 1 support the use of the force-free limit of MHD theory in modelling the torques on rotation-powered neutron stars (Spitkovsky 2006; Kalapotharakos & Contopoulos 2009). As already mentioned, MHD theory has been quite successful in modelling the multidimensional dynamics and appearance of young PWNe (Del Zanna et al. 2004, 2006; Komissarov & Lyubarsky 2004; Volpi et al. 2008). Such models confirm the early inference (Rees & Gunn 1974; Kennel & Coroniti 1984a) that the system behaves as if just upstream of the PSR wind TS, the plasma has low magnetization σw≡ (B2/8πγwn±m±c2) ≪ 1 (n± is the number density of pairs; the particle density is 2n±): typically, the average of σw in latitude with respect to the rotation axis is ∼0.02 for systems that show a jet–torus morphology (Del Zanna et al. 2004; Komissarov & Lyubarsky 2004). However, this analysis has been done in full only for the Crab nebula.
The nebular dynamics in the MHD model is insensitive to the specific value of the upstream 4-velocity uw=cβwγw, as long as γw≫ 1. By applying their 1D MHD model to the optical and harder photon emission in the Crab, Kennel & Coroniti (1984b) inferred γw≈ 106.5, with σw≈ 0.005. More modern models (Del Zanna et al. 2006; Volpi et al. 2008) require latitude-averaged σw to be somewhat larger (so that magnetic hoop stress can create the jet component of the torus–jet structure), while account of the high-energy SYN emission requires particle spectra at the TS with parameters similar to the 1D Kennel and Coroniti model: again γw∼ 106, although this is not explicitly stated since the distribution functions were not tied to the specifics of the MHD flow.
If the apparent low value of σw means that the wind just upstream of the TS is really weakly magnetized, σw and γw are closely tied to the pair multiplicity κ±=κ/2, since when σ≪ 1 the wind carries the rotational energy lost from the PSR in the kinetic energy of the flow,  . Since
  , and L=cΦ2, then γw=eΦ/2 m±c2κ±. In the case of the Crab nebula and PSR, Φ = 4 × 10¹⁶ V, while extant theoretical models of pair creation, from polar caps, slot gaps or outer gaps (Hibschman & Arons 2001; Cheng 2004; Hirotani 2008; Harding, private communication), all yield κ±∼ 104, for young PSRs with Φ > 1015 V. Thus, theory also says γw∼ 106– if one confines one's analysis to the high-frequency emission from PWNe, theory and observations appear to be in good accord.1
Using the X-ray emitting particles in PWNe, whose SYN cooling times are short, takes advantage of such PWNe being calorimeters for the contemporary particle injection rates, which gives the results some independence from the uncertainties of evolutionary models. However, radio and infrared (IR) emitting particles are much more numerous than the X-ray emitting ones, due to the rapid decline of SYN emissivity with declining particle energy (Kennel & Coroniti 1984b; Gallant et al. 2002). Models of the underlying PSR must be able to account for all the radiating relativistic particles found in the PWNe – the spectral continuity in several systems, demonstrated in the results described below, suggests that the lower energy particles are indeed injected by the PSR, rather than being accelerated out of the non-relativistic material often found embedded within PWNe. Thus, measuring the full relativistic particle content in PWNe is an important experimental input into modelling of PSRs, distinct from the modelling of the energy input into the nebulae. For the latter, the force-free model (Spitkovsky 2006; Kalapotharakos & Contopoulos 2009) provides the essential description, but unfortunately this is independent of the multiplicity, so long as κ≫ 1.
We study several young PWNe (Crab, 3C 58, B1509, Kes 75) for which the data can be used to reasonably constrain the pair injection rate – in principle, one would like to use nebulae with ages known, and reasonably complete (including near-IR and far-IR and millimetre) spectral energy distributions (SEDs) are required. We show that all these systems have spectral continuity from the radio through the IR to the X-ray bands, suggesting that a single source for the radiating particles is present in each system. We use these full SEDs to derive new estimates for the pair creation multiplicity. We discuss the constraints these results set on PSR pair production gap models – polar caps, slot gaps and outer gaps – concluding that no existing model adequately explains particle injection rates.
We also discuss alternate hypotheses that low-energy particles are picked up from thermal gas in the nebulae or are fossils left over from some unnamed acceleration process in the early history of the nebula (Atoyan & Aharonian 1996), or represent the effects of a second acceleration mechanism operating at low energy (Gallant et al. 2002), such as cyclotron acceleration stimulated by a heavy ion component of the wind (Hoshino et al. 1992; Amato & Arons 2006) or, more generally, any component with energy greater than m±c2γw. We use the spectral continuity to argue that such a two-component model is unlikely, implying that some additional piece of physics needs to be added to the shock acceleration model to account for these broken power laws, in addition to the extra physics needed to account for the total injection rate.
3 NEBULAR EVOLUTION
There are three phases of interest in the evolution of a PWN. In this section, we briefly describe them and explain how we model each of them.
We consider objects of a relatively young age (less than 40 000 yr) with the PSR still inside the SNR, and assume spherical symmetry, neglecting the PSR proper motion [see van der Swaluw et al. (2004) for a discussion of this point]. We also assume, in deriving the PWN evolution, that radiation losses of the particles are negligible. Given the weak dependence of the PWN radius on the PSR luminosity, and the fact that radiation losses only affect the particle energy content and not the magnetic energy content, we do expect this to be a good approximation. This allows us to use analytical formulae and substantially reduce the computational requirements.
3.1 SNR evolution
Once the evolution of the SNR is known, it can be used to constrain the evolution of the PWN.
3.2 Free-expansion phase
The free-expansion phase lasts as long as the radius of the PWN is smaller than the radius of the reverse shock computed using the Truelove & McKee model. Once the PWN reaches the reverse shock, the reverberation phase begins.
3.3 Reverberation phase
Once the PWN has reached the SNR reverse shock, it is in contact with the shock-heated ejecta. The pressure of the hot ejecta is higher than the pressure of the relativistic material inside the PWN. As a consequence, the PWN expansion halts, and the system starts contracting (van der Swaluw et al. 2001).
In 1D simulations (van der Swaluw et al. 2001), the reverberation phase is characterized by a series of compressions and expansions of the nebula, until the system relaxes to the Sedov–Taylor phase, which is finally established once the PWN reaches pressure equilibrium with the SNR. This behaviour, which resembles a damped oscillator, is an artefact of the 1D geometry. In a more realistic multidimensional regime (Blondin et al. 2001), the evolution of the PWN during the reverberation phase is subject to strong Rayleigh–Taylor (RT) instabilities and efficient mixing of the relativistic material with the SNR matter. From a dynamical point of view this mixing acts as a viscous term on the evolution of the nebula, and one might expect, instead of a series of oscillations, an almost complete relaxation to the Sedov–Taylor solution after the first compression.
Of course in the presence of mixing and the related clumpiness, the volume occupied by the relativistic plasma will not be directly related to the radial extent of the nebula. However, equation (7) will still hold if one interprets R(t) as an effective radius  related to the total volume of the relativistic plasma,
  , rather than as the radial extent of the nebula (which in general might be larger because of clumpiness). In one-zone models, this effective volume is also all that matters for computing particle adiabatic losses.
In our model the reverberation phase ends after the first compression, once the PWN pressure reaches the value of the Sedov solution for the SNR.
3.4 Sedov–Taylor phase
Once the pressure inside the PWN reaches the value proper of the Sedov solution corresponding to the SNR forward shock, the Sedov–Taylor phase begins. This usually happens at an age of ∼104 yr. By this time, because of spin-down, the PSR luminosity can in general be neglected in the evolution of the system. The speed of the forward shock, vfs, and the post-shock pressure are both given by the Truelove & McKee (1999) model. The pressure inside the SNR is then assumed to be equal to the central pressure of the Sedov solution Pout∼ 0.5 ρ0v2fs.
 is related to the total volume of the relativistic plasma rather than to the radial extent of the nebula.
One last comment is about the role of RT instabilities. While during the reverberation and Sedov–Taylor phase, reinterpretation of the radius appearing in equations (6)–(8) in terms of effective volume is necessary, during the initial free-expansion phase, RT and mixing are not as important: Bucciantini et al. (2004b) and Jun (1998) have shown that, in general, the radius derived from the 1D solution is at most 10–15 per cent smaller than the true radial extent of the nebula. We might then conclude that, at least for very young objects, the 1D radial model provides a reliable estimate both for the radial extent of the nebula and for the volume occupied by the relativistic fluid.
4 PARTICLE EVOLUTION
Once the evolution of the nebula is known, one can compute the evolution of the particle distribution function.
 is the particle injection rate per unit energy interval.
Given the very short SYN lifetime of the particles at the high-energy end of the spectrum, we use a Lagrangian scheme in energy space. The energy space is originally divided into energy bins whose extrema are given by Ei(t). These evolve according to equation (9). When a bin moves to energies lower than 50 keV, it is removed from the sample. New bins are continuously added at the high-energy end of the distribution function, as the old ones evolve to lower energies. The time-step is then dictated by the requirement of sufficient energy resolution in the high-energy portion of the spectrum.
In principle, the functional form of  can be arbitrarily chosen.
 and εm is the low-energy cut-off, usually found to be small compared to εc. The scale-free approximation implies that the ratios νe=εm/εv and μe=εc/εv, are constant in time. μe and νe are in principle free parameters of the model, and their value is obtained from a fit to the data. However, the condition εc≪εv translates into a requirement that μe≪ 1.

If the wind is characterized by a single value of the Lorentz factor, then  . However, the approximation of a single Lorentz factor might not be correct; in this case the ratio εm/εc cannot be a priori determined, but is found from requiring a fit to the entire spectrum. In particular, once an upper limit for εm is derived from fitting the low-frequency radio emission, this can be used to infer the particle number flux and to estimate the average Lorentz factor.


5 EMISSION
There are three channels of non-thermal emission in PWNe. From radio frequencies to MeV photon energies, the dominant emission process is SYN radiation by the accelerated electrons and positrons gyrating in the nebular magnetic field. At higher energies, there are two possible contributions: IC emission by the high-energy pairs and gamma-ray emission from neutral pion decay, following p–p scattering between accelerated and target protons.
Equation (19) has then to be integrated over the pair distribution function (see the previous section) in order to derive the total nebular SYN luminosity at a given frequency.
IC is computed using the full Klein–Nishina cross-section (Jones 1968; Blumenthal & Gould 1970) and assuming scattering over three main target photon fields: (1) CMB, modelled as a perfect blackbody, with a typical temperature of 2.75 K; (2) SYN emission from the PWN, consistently computed as described above; (3) ‘Galactic background’, which in principle includes both Galactic starlight and any local contribution in the optical–IR band. This third term is modelled as a suppressed blackbody: both the temperature (in the range of a few hundreds/thousands Kelvin) and the suppression factor (of the order of 10−10) are, in principle, free parameters that can be adjusted. The role of this contribution will be discussed in more detail when dealing with specific objects.

The total pion emissivity is then computed integrating over the total proton energy distribution. The density of target protons nt that enter equation (17) is the main unknown: if the protons are well confined within the PWN, then a reasonable assumption would be to use the swept-up ejecta mass; if they can leak out, then one should consider the total ejecta mass. A realistic model for proton diffusion in PWN-SNR systems is far beyond the scope of this paper: we keep nt as a free parameter and discuss the implications of its assumed value whenever relevant.
6 RESULTS
In this section we show the results obtained when applying our model to a few objects of different ages, both young and old. For each object, we will not attempt at obtaining the best possible fit of the data, which in our view would not be very significant given the intrinsic limitations of a one-zone model. In fact, our primary interest is to put some constraints on the unknown parameters and to clarify which observations would be more relevant to improve our understanding of these systems. At the same time, we will discuss the limitations of this approach and make clear which part of our results should be considered as really reliable.
6.1 The Crab Nebula
The Crab Nebula is the system for which we have the best constraints, regarding both the PSR injection properties and the luminosity at different wavelengths. Available data extend from low radio frequencies (Baldwin 1971; Baars 1972), through mm/IR (Mezger et al. 1986; Bandiera, Neri & Cesaroni 2002), optical/UV radiation (Hennessy et al. 1992; Veron-Cetty & Woltjer 1993), X-rays (Kuiper et al. 2001) and gamma rays from MeV to TeV energies (Aharonian et al. 2004; Albert et al. 2008; Abdo et al. 2010a). The source distance is estimated to be 2 kpc, and the nebular volume is 30 pc3 (Hester 2008), corresponding to a spherical radius of about 6 ly. This is the only system for which we know the exact age (950 yr). We also have a reliable estimate of the braking index (2.51 implying β = 2.33; Lyne, Pritchard & Graham-Smith 1993), which, when combined with the present luminosity L≃ 5 × 1038 erg s−1, allows us to derive an initial luminosity L(0) = 3.5 × 1039 erg s−1 and a characteristic spin-down time-scale τ≃ 730 yr.
Much more uncertain are the properties of the SNR which should be surrounding the nebula. Several attempts at detecting both the forward and the reverse shock have only provided upper limits. More information can be derived by studying the filamentary network surrounding the PWN and comparing the results with theoretical expectations based on hydrodynamical models of the interaction between the nebula and the surrounding ejecta (Hester et al. 1996; Jun 1998; Bucciantini et al. 2004b). The visible remnant contains at least 1–2 M⊙ of He-rich line-emitting gas and the PWN expands at a speed of about 1.5–2 × 10³ km s-1. Traditional models for the evolution of the Crab Nebula (Chevalier & Fransson 1992; van der Swaluw et al. 2001; Bucciantini et al. 2003; Del Zanna et al. 2004) have all assumed a flat density profile of the ejecta. Steeper ejecta (α≥ 1 in Table 1) give a mass in the filamentary network higher than what is observed. Assuming flat ejecta and a canonical SN energy of 1051 erg, in order to reproduce the proper size of the nebula a mass Mej = 9.5 M⊙ is needed, very close to the most recent estimate by MacAlpine & Satterfield (2008). The lack of any clearly detected SNR shell prevents any reliable estimate of the ISM density, and we simply assume a fiducial value of 0.1 cm−3.
Values of the parameters used in the modelling.
| Parameter | Symbol | Crab | 3C 58 | B1509−58 | Kes 75 |
| SN explosion energy (1051 erg) | ESN | 1 | 1 | 7 | 2.1 |
| Mass of the ejecta (M⊙) | Mej | 9.5 | 3.2 | 4.0 | 16.4 |
| ISM density (cm−3) | ρ0 | 0.1 | 0.01 | 0.001 | 2 |
| Ejecta density index | α | 0 | 1 | 1 | 0 |
| Initial PSR luminosity (1038 erg s−1) | L0 | 35 | 0.73 | 49 | 1.66 |
| Spin-down time (yr) | τ | 730 | 3280 | 114 | 226 |
| Braking index | β | 2.33 | 2 | 2.087 | 2.12 |
| Age (yr) | t | 950 | 2100 | 1570 | 650 |
| Fraction of L that goes into pairs | ηe | 0.8 | 0.75 | 0.7 | 0.95 |
| Low-energy injection index | γ1 | 1.5 | 1.2 | 1.2 | 1.7 |
| High-energy injection index | γ2 | 2.35 | 2.82 | 2.14 | 2.3 |
| Peak energy ratio | μe | 1.54 × 10⁻⁵ | 6.25 × 10⁻⁶ | 3.33 × 10⁻⁶ | 10−4 |
| Minimum energy ratio | νe | 1.1 × 10⁻⁸ | 8.7 × 10⁻⁸ | 2.8 × 10⁻⁸ | 2 × 10⁻⁷ |
| Break energy (eV) | εc | 4 × 10¹¹ | 5 × 10¹⁰ | 1.5 × 10¹⁰ | 4 × 10¹¹ |
| Fraction of magnetic energy | ηM | 0.11 | 0.5 | 0.53 | 0.005 |
| Fraction of L that goes into ions | ηp | 0 | 0 | 0 | 0 |
The PSR and SNR parameters are listed in Table 1, together with the parameters that describe the particle energy distribution at injection. The low-energy spectral index γ1 is fixed according to the radio data, while the high-energy index γ2 is chosen in order to minimize the X-ray residuals. We want to stress here that the X-ray emission is concentrated in the central region of the PWN and it is strongly affected by the details of the flow dynamics just downstream of the TS (Del Zanna et al. 2004, 2006). It is unrealistic to expect that a simplified one-zone model can provide an accurate description of the high-energy spectrum. A one-zone model can at most provide an indication of the best power-law index that can fit the data, but more realistic multidimensional models are necessary to address the emission properties in the X-ray band. Two features are interesting to notice: (1) γ2 is higher than the value of 2.23 typical of relativistic Fermi shock acceleration with isotropic scattering in the fluid frame and (2) there are indications that a single power law cannot reproduce the complete set of X-ray data points.
Several features are present at high energies, but it is not clear if they are intrinsic [a suggestion in this sense has been put forward by Volpi et al. (2008), where they present a multidimensional model of the emission that shows similar features], if they are simply due to calibration issues among different instruments or even for one instrument at different energies, or if they are due to temporal variability of the emission properties (Bucciantini 2008).
The present model can reproduce the SYN part of the spectrum within few per cent accuracy (greater discrepancies being present at high energies as discussed above). At present, our particle distribution function does not include any smooth high-energy cut-off, the reason being the very short lifetime of high-energy particles that prevents efficient numerical integration of their evolution. However, a good match with the data can be obtained by introducing a posteriori an exponential cut-off in the particle energy distribution. This reflects in a cut-off in the emission spectrum at a frequency of around ∼ 1022 Hz. Our model requires that 80 per cent of the PSR spin-down luminosity goes into accelerated pairs. This does not leave much energy to be carried by higher energy particles (i.e. ions; Amato et al. 2003). In principle, the presence of ions might have observable consequences in the TeV band; however, even assuming that the remaining 20 per cent of the spin-down energy is all carried by ions, their contribution to the gamma-ray emission turns out to be negligible. On the other hand, if the return current is made by a high-energy lepton beam (Arons, in preparation), there might be radiative consequences of this latter scenario that have not been investigated, however, again, they are not expected to give any appreciable contribution to gamma rays.
TeV emission is due to IC scattering by the pairs, for which the main target is the nebular SYN emission in this case. We estimate a magnetic field B≃ 200 μG, slightly lower than previous estimates (Aharonian et al. 2004; Hester 2008). Overall the broad-band spectrum is very well reproduced, with the largest discrepancies limited to the EGRET data points around 10 MeV. These points have large uncertainties and are likely affected by calibration issues (Abdo et al. 2009). Indeed, recent Fermi data (Abdo et al. 2010a) are consistent with our model curve (Fig. 1).
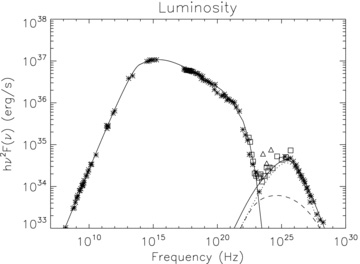
The Crab nebula integrated emission spectrum. Data points are from Baldwin (1971), Baars (1972), Mezger et al. (1986), Bandiera et al. (2002), Veron-Cetty & Woltjer (1993), Hennessy et al. (1992), Kuiper et al. (2001), Aharonian et al. (2004), Albert et al. (2008) and Abdo et al. (2010a) (triangles are EGRET points and squares are Fermi points). The solid line is the total luminosity, dashed line is the IC-CMB and dotted line is IC–SYN.
Baldwin (1971) has shown that the radio power-law spectrum of the Crab nebula extends down to the ionospheric cut-off at ∼30 MHz. One can use this piece of information to derive an upper limit on the minimum particle energy at injection. In order for the radio spectrum to extend to those energies as an uninterrupted power law, we need to assume εm/εc < 7 × 10⁻⁴. From equation (15), we then find for the wind Lorentz factor γw < 5 × 10⁴. This has to be compared with the typical Lorentz factor of the particles at εc, which is 7.4 × 10⁵, and with the minimum Lorentz factor of injected particles, which is <500. The estimated value of γw translates into a lower limit on the pair multiplicity of κ≳ 106.
Our model allows us to compute a posteriori the energy radiation losses. We do this in order to verify to what degree the adiabatic approximation for the evolution of the PWN radius is correct. For the Crab Nebula, we find that about half of the total energy injected into the nebula in the form of pairs has been lost via SYN emission. However, the dependence of the radius on the PSR luminosity L(t) is in general weak [scales as L(t)1/5 for constant luminosity], so we expect at most modification of the order of 20 per cent in the radial evolution and may be in the adiabatic losses. Such a value is well within the simplifications and the approximations of the model. In order to properly take into account radiation losses, one needs to abandon any analytic solution for the dynamics and solve the coupled system of equations for the dynamics and the emission simultaneously.
6.2 3C 58
3C 58 is another example of a young PWN, which shares many similarities with the Crab nebula. It has a typical non-thermal spectrum extending from radio to X-rays (Salter et al. 1989; Green & Scheuer 1992; Torii et al. 2000; Slane et al. 2004, 2008). It shows clear evidence of energy injection from the central pulsar PSR J0205+64 in the form of a jet–torus structure (Slane, Helfand & Murray 2002). Recent Spitzer measurements of the PWN IR luminosity have showed clear evidence for a possible injection break, as in the Crab (Slane et al. 2008). At a typical distance of 3.2 kpc (Chevalier 2005), its size is about 5 × 9 pc, equivalent to a volume of ∼140 pc3 (corresponding to a spherical radius of ∼3.3 pc). An association with SN 1181 has been proposed (Stephenson & Green 2002). However, recent measurements of the expansion of the filamentary structure surrounding the source (Bietenholz 2006; Rudie & Fesen 2007), interpreted with a simple model of the PWN-SNR system (van der Swaluw 2003; Chevalier 2005), have ruled out this possibility.
The PSR's present spin-down power is L≃ 2.7 × 1037 erg s−1, with a characteristic dipole age tc = 5390 yr (Murray et al. 2002). Neither the true age nor the PSR braking index is known, and this prevents any reliable determination of the initial spin-down power. However, it is possible to obtain some constraint from the information available on the expansion of the PWN and surrounding SNR. In particular, Bocchino et al. (2001) measured a mass in the filaments of ∼ 0.1 M⊙, and thermal emission corresponding to a typical velocity of the swept-up shell of ejecta VSH∼ 340 km s−1. Assuming that the filamentary structure corresponds to the swept-up shell of ejecta (in analogy with the case of the Crab Nebula), we can use our model for the system evolution and obtain an estimate of both the system age and the PSR braking index depending on the density profile of the ejecta.
In Table 2, we present a set of models derived for different values of the unknown braking index (3 and 2.5) and for different density profiles of the ejecta. In all the different models, the swept-up mass and the nebular volume are consistent with extant measures. The shock speed varies slightly, but is in all cases consistent with measurements, within the approximation of a spherical model. We again assume a canonical SN explosion energy of 1051 erg. As in the case of Crab the lack of any clearly detected SNR shell prevents any reliable estimate of the ISM density, and we simply assumed a fiducial value of 0.1 cm−3.
Values of the parameters corresponding to different models for 3C 58.
| β | α | t (yr) | Mej (M⊙) | VSH (km s−1) |
| 2 | 0 | 2000 | 5.4 | 270 |
| 2 | 1 | 2100 | 3.2 | 305 |
| 2 | 2 | 2250 | 1.2 | 355 |
| 2.33 | 0 | 2050 | 5.5 | 270 |
| 2.33 | 1 | 2180 | 3.3 | 307 |
| 2.33 | 2 | 2350 | 1.3 | 360 |
| β | α | t (yr) | Mej (M⊙) | VSH (km s−1) |
| 2 | 0 | 2000 | 5.4 | 270 |
| 2 | 1 | 2100 | 3.2 | 305 |
| 2 | 2 | 2250 | 1.2 | 355 |
| 2.33 | 0 | 2050 | 5.5 | 270 |
| 2.33 | 1 | 2180 | 3.3 | 307 |
| 2.33 | 2 | 2350 | 1.3 | 360 |
By looking at Table 2, one immediately realizes that the inferred age is not very sensitive to either the braking index or the assumed ejecta structure. The reason for this is that in all cases the age is much less than the characteristic age, and the PSR spin-down power in the past was not much larger than the present value. It is interesting to note that in all models the shock speed tends to be higher for steeper ejecta, favouring the case r−2. However this would result in a very small mass of the ejecta, inconsistent both with estimates based on the observed filamentary knots (∼8 M⊙; Rudie & Fesen 2007) and with stellar evolutionary models.
It is our opinion that cases with a density profile which is either flat or r−1 are more likely, even if they are associated with a lower shock speed: this is because steeper ejecta lead to unreasonably small ejecta masses. In all cases, the age estimated for the system rules out any association with SN 1181. However the filamentary structure, which we have interpreted as mostly due to swept-up ejecta, is rather complex and with various velocity components (Rudie & Fesen 2007), so that it cannot be ruled out that part of this filamentary network might be associated with the 1181 event.
The question that naturally arises is whether spectral fitting allows us to discriminate between the models listed in Table 2. Unfortunately, the answer is negative: fits to the observations lead to similar results in terms of the required injection parameters for all of these models. The reason is that all of them correspond to similar underlying ages, similar integrated spin-down power (i.e. total injected energy) and the same size (same adiabatic losses). The parameters reported in Table 1 correspond to the case of ejecta with α = 1 and braking index 3. Spectral fitting is shown in Fig. 2. Very similar values of the parameters are found also for a braking index of 2.5 (β = 2.33).

3C 58. Data points are radio from Salter et al. (1989) and Green & Scheuer (1992), X-ray from Slane et al. (2004) and IR from Slane et al. (2008) (diamonds are IRAS and Spitzer points). The solid line is the total luminosity, dashed line is the IC-CMB and dash-dotted line is IC–SYN.
If we compare the particle spectrum at injection with that of Crab, we find that the spectral index is now flatter at low energies and steeper at high energies. Again, the required pair injection efficiency is very high ∼80 per cent and the ratio μe∼ 8.3 × 10⁻⁵ is only a factor of 2 lower than for Crab. The inferred magnetic field is 43 μG, higher than other recent estimates (Slane et al. 2008). The ratio of the magnetic energy to the total energy is ∼0.5: this is quite high and leads to a value for ηe+ηM > 1 which apparently violates the total energetics. The discrepancy is however ∼30 per cent, and we consider it to be within the approximations of our model (particularly critical in this respect are the simplifications related to the assumption of spherical geometry) and the uncertainties of the data (especially the estimated distance, and hence volume). Models with ηe+ηM = 1 always underpredict the radio emission, independently of the value chosen for ηM.
Within the present model, we consider our estimates of ηe and ηM rather solid: attempts at fitting the data assuming a lower magnetization and a higher particle content result in underproduction of the radio emission, while larger magnetization leads to the break frequency moving below 1011 Hz, in contrast to observations. One final remark we want to make about ηM is that the idea of a relatively high magnetization in this PWN is also supported by its substantial elongation, created by hoop stresses of the toroidal magnetic field (Begelman & Li 1992).
The existence of radio measurements down to 100 MHz allows us to derive also in this case a lower limit on the pair multiplicity: we find that γw < 3 × 10⁴ to be compared with the typical Lorentz factor of the particles at εc, which is 1.2 × 10⁵, and with the minimum Lorentz factor of injected particles, which is <1600. This implies κ > 5 × 10⁵. All the latter values are very close to the corresponding estimates for Crab.
6.3 MSH 15−52
The system formed by the pulsar PSR B1509−58 and the SNR MSH 15−52 is striking for its relatively large size compared with its presumed age. Its distance is estimated to be 5.2 ± 1.4 kpc (Gaensler et al. 1999). Assuming the central value as a fiducial distance (which we will do in the following), the SNR radius turns out to be ∼ 83 × 1018 cm. PSR B1509−58 is a young PSR. Its current spin-down power is 1.8 × 1037 erg s−1, with a characteristic dipole age of 1550 yr (Kaspi et al. 1994; Livingstone et al. 2006). This is one of the very few PSRs for which the braking index is known: β = 2.087. Unfortunately, our ignorance of the true age of the system still prevents knowledge of the initial spin-down power, L0: this can only be determined as a function of the assumed age, t. A maximum possible age of the system can be estimated from the braking index and the characteristic dipole age, and the result is t < 1690 yr. For such an age, the size of the SNR implies a high ESN/Mej ratio, typical of SN Ib/c (Gaensler et al. 1999; Mazzali, Iwamoto & Nomoto 2000; Iwamoto et al. 2000; Tsvetkov 2002; Mazzali et al. 2003; Tanaka et al. 2009). The size of the PWN is poorly constrained because of the high radio foreground from the SNR. Spectral modelling (Du Plessis et al. 1995; Chevalier 2005; Nakamori et al. 2008), however, suggests that the cooling frequency lies just below the Chandra band (see also the present discussion), which is also in agreement with the size of the nebula at TeV energies being comparable with the Chandra size. If cooling starts being important at frequencies no lower than the X-rays, then one can estimate the size of the PWN from Chandra images: the result is a PWN radius of ∼ 17 × 1018 cm, for the assumed distance.
Knowing the braking index, and assuming an age (t) and an ejecta density profile (α), we can use our model to determine which values of ESN and Mej return the assumed radius for both the PWN and SNR. The only other parameter that enters this calculation is the local density of the ISM. We assume ρ0 = 0.001 cm-3: a higher density would hint at even higher values of ESN/Mej and in any case does not allow to match both radii; a lower value marginally affects the results because the system turns out to be in the ejecta-dominated phase anyway.
If one accepts the hypothesis that B1509−58 was born in an SN Ib/c explosion, then one can further constrain the model requiring that the mass of the ejecta be in the range of 4–10 M⊙ and the kinetic energy released be in the range of 5–20 × 1051 erg. In Table 3, we report the different age ranges. Flat ejecta tend to favour slightly younger systems. In spite of the relatively small differences between the ages reported in Table 3, spectral modelling can prove a useful tool to discriminate between different scenarios for this source. In the case of 3C 58 the inferred ages for all models were much smaller than the characteristic dipole age, so the injection properties of the PSR were almost the same, and it was not possible to discriminate using the SED. On the contrary, for B1509, the inferred ages are close to the characteristic dipole age, and different models correspond to different spin-down histories and different integrated injection energies. In such a situation the SED, and in particular the radio data, can be used to rule out some of the models allowed by the dynamics.
Different age ranges for models for B1509−58.
| β | α | t (yr) Size limit | t (yr) SED limit | μe |
| 2.087 | 0 | 1350–1500 | 1470–1500 | 1.2 × 10⁻⁶ |
| 2.087 | 1 | 1570–1630 | 1570–1630 | 2 - 4 × 10⁻⁶ |
| β | α | t (yr) Size limit | t (yr) SED limit | μe |
| 2.087 | 0 | 1350–1500 | 1470–1500 | 1.2 × 10⁻⁶ |
| 2.087 | 1 | 1570–1630 | 1570–1630 | 2 - 4 × 10⁻⁶ |
Observations cover the radio GHz band (Gaensler et al. 1999), although the quality of the data in this band is not very high, X-rays from Chandra to INTEGRAL (Gaensler et al. 2002; DeLaney et al. 2006; Forot et al. 2006), Fermi in the MeV–GeV range (Abdo et al. 2010b), Cangaroo-II and HESS in the TeV (Aharonian et al. 2005; Nakamori et al. 2008). Only models with L0 > 1039 erg s−1 can reproduce the radio, while lower values of L0 do not satisfy the energetic requirements. Table 3 shows the limits imposed on the model by SED fitting. Flat ejecta correspond to a very narrow range of possible ages and a value of μe∼ 1.2 × 10⁻⁶ smaller than what is found for both the Crab Nebula and 3C 58. Vice versa, ejecta with α = 1 correspond to spin-down properties and multiplicity that are closer to what is found in Crab and 3C 58. Compared with these two sources, we find a slightly harder high-energy spectrum at injection γ2∼ 2.1–2.16. However, this is consistent with the hard spectrum observed in the MeV–GeV range by Fermi (Abdo et al. 2010b). Indeed, the photon index derived from X-ray observations (Gaensler et al. 2002; DeLaney et al. 2006) of the inner region is ∼ 1.4–1.6 and is much smaller than the previously used value of ∼2.7 which seems inconsistent with both observations and energetics (Nakamori et al. 2008). Moreover, the injection break is located between 5 and 50 GHz, at a significantly lower frequency than what was assumed in previous models (Nakamori et al. 2008).
Steeper ejecta give larger values of μe, as reported in Table 3. All possible models require a high acceleration efficiency, ηe∼ 0.7, and a strong magnetic field, ηM∼ 0.53, implying B > 20 μG. Again, as in the case of 3C 58, there is an energetic problem, but as in the previous case, this system is strongly magnetized, as also suggested by the presence of a strong X-ray jet [see Del Zanna et al. (2004) for a discussion of the dependence of the jet strength on the magnetization].
The lowest frequency radio point allows us to constrain the value of νe, as it was done in Crab and 3C 58. We find that even for α = 1, the average wind Lorentz factor is γw < 104, quite small compared with other systems. This translates into a lower limit on multiplicity, which has to be greater than ∼ 2–3 × 10⁵.
Fig. 3 shows the spectrum derived from the model presented in Table 1. From spectral fitting it is clear that the Lorentz factor corresponding to εc has to be smaller than 5 × 10⁴ (μe has to be smaller than 4 × 10⁻⁶), otherwise it is not possible to reproduce the correct slope and intensity in the radio band (the injection break shifts below 1GHz). As a result ηM must be larger than 0.3, and the magnetic field cannot be smaller than 15 μG. Only by measuring the PWN emission in the range of 1010–1012 Hz would it be possible to discriminate among various models and put better constraints on the multiplicity.
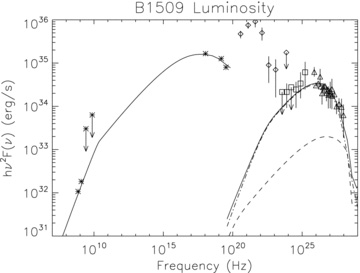
B1509−58; MSH 15−52. Data points are radio from Gaensler et al. (1999), X-ray from Gaensler et al. (2002), DeLaney et al. (2006) and Forot et al. (2006), and gamma ray from Nakamori et al. (2008), Aharonian et al. (2005), Kuiper et al. (1999) and Abdo et al. (2010b) (diamonds are EGRET points, squares are Fermi points and triangles are COMPTEL/HESS points). The solid line is the total luminosity, dashed line is the IC-CMB and dash–dotted line is the IC on the enhanced local IR background at 400 K.
As it has already been noted (Aharonian et al. 2005) it is not possible to reproduce the observed gamma-ray emission in the TeV range, either with IC on the CMB or with the average Galactic background. The contribution from IC–SYN is negligible. Various models have been presented to account for such discrepancy.
One suggestion is that of a lower value of the magnetic field in the nebula, which would lead to infer a higher particle content and consequently enhance the gamma over X-ray ratio (Aharonian et al. 2005). However, within this model this does not seem to be a viable solution: in order to increase the particle content up to the value required to fit the gamma rays as IC on the standard Galactic background, we would have to violate the energy fixed by the spin-down history by a factor of ∼5.
Another proposal is that of a possible contribution to the TeV flux of πo decay, in the presence of relativistic hadrons (Nakamori et al. 2008). It was however immediately realized that this would need so much energy to be put in protons as to require millisecond magnetar conditions at birth for the PSR, which seems unlikely judging from the present PSR-SNR properties. In addition, the swept-up ejecta do not provide a sufficient target density of thermal protons.
The third possibility is that the local photon background, in particular the IR, could be much higher than the average galactic value. Indeed, the SNR itself could be the origin of this excess (Du Plessis et al. 1995; Nakamori et al. 2008). The fit presented in Fig. 3 assumes for the local IR background a blackbody with a temperature of ∼400 K suppressed by a factor of 3 × 10⁻⁷, which corresponds to an energy density about five to seven times higher than the average galactic background. The suggestion by Helfand (2007) that the correlation between the SNR detected by HESS and H ii regions might be due to enhancements in the local photon background is interesting in this regard.
6.4 Kes 75
The SNR Kes 75 (G29.7−0.3) is a shell-type remnant which hosts at its centre a young PWN powered by pulsar PSR J1846−0258. This is a 324-ms PSR, with a characteristic dipole age of 723 yr, a spin-down luminosity of 8.3 × 1036 erg s−1 and a measured value of the braking index β = 2.65, which provides an upper limit for the age of the system of ∼880 yr (Livingstone et al. 2006).
The estimated distance of the system suffers from large uncertainties. The first estimates pointed to a distance of 19–21 kpc (Becker & Helfand 1984). However, it was immediately realized that such a large value implied very peculiar conditions for the SN explosion (Helfand, Collins & Gotthelf 2003; Morton et al. 2007) and the ISM, together with an extremely high SYN efficiency of the PWN. Recent studies have revised the distance to a much smaller value, in the range of 5–7 kpc (Eisenhauer et al. 2005; Leahy & Tian 2008). We will assume a distance of 6 kpc in all our models.
Assuming a distance of 6 kpc, the radii of the PWN and of the SNR are, respectively, R = 1.8 and Rsnr = 9.24 ly. The velocity of the forward SN shock is vfs = 3700 km s−1 (Helfand et al. 2006) as estimated via the Si X-ray line. This places an upper limit on the age of the system t < Rsnr/vfs∼ 800 yr. Various attempts have been made to measure the ejecta mass and the SN energy; however, the bulk of the SNR emission comes mainly from two regions of the SNR shell, and this tends to bias all estimates. In general, very high masses are inferred for both the swept-up ISM and the SN ejecta (Becker & Helfand 1984; Morton et al. 2007; Leahy & Tian 2008), hard to reconcile with theoretical expectations for an SN Ib/c and standard evolutionary models. It must be stressed, however, that mass estimates are very sensitive to the assumed volume of the emission region, which is not well known.
Proceeding as for previous cases, we will first attempt to constrain the possible SNR-PWN parameters through models for the dynamical evolution of the system. Given an assumed age t and an ejecta profile α, there is only one set of values of ESN, Mej and ρ0 that gives the correct size of both the PWN and the SNR and the correct forward shock speed. Further constraints on the parameter space come from the properties of SN Ib/c which limit Mej in the range 5 M⊙≲Mej≲ 16 M⊙. Cases with α≥ 1 are acceptable only for a system older than 700 yr and are in general unlikely because they require a very low SN energy, ESN≲ 0.3 × 1051 erg. Cases with flat ejecta are admissible for a larger range in age from 450 to 650 yr. The typical SN energy does not seem to depend on the age and is ESN∼ 2 × 1051 erg; younger systems require lower values of Mej, and larger values of ρ0, as shown in Table 4. Cases with marginally steep ejecta, α = 0.5, suggest a larger age, a less energetic explosion, ESN∼ 0.6 × 1051 erg, and lower ISM density.
Different age ranges for models for Kes 75.
| α | t (yr) | Mej (M⊙) | ρ0 (cm−3) |
| 0 | 450 | 4.8 | 4 |
| 0 | 550 | 8.0 | 3 |
| 0 | 650 | 16.4 | 2 |
| 0.5 | 600 | 4.6 | 0.8 |
| 0.5 | 700 | 10.7 | 0.5 |
| α | t (yr) | Mej (M⊙) | ρ0 (cm−3) |
| 0 | 450 | 4.8 | 4 |
| 0 | 550 | 8.0 | 3 |
| 0 | 650 | 16.4 | 2 |
| 0.5 | 600 | 4.6 | 0.8 |
| 0.5 | 700 | 10.7 | 0.5 |
The question arises again whether it is possible to discriminate among the different parameter sets for the dynamics based on the SED. Unfortunately, this is not the case: as it was already realized earlier (Chevalier 2004), Kes 75 is a particle-dominated system by large (more than 90 per cent of the PSR spin-down power seems to be converted into accelerated particles; see below), so the differences in particle content due to the different energetics of the various models can be easily compensated by small changes in the magnetization to give the same SYN emission.
However, fitting the model to the multiband emission spectrum is non-trivial. The radio emission spectrum implies a low-energy particle spectral index at injection γ1 = 1.7 (Becker & Helfand 1984; Salter et al. 1989; Bock & Gaensler 2005). The average photon index in the Chandra band is 1.9 while deep X-ray images have shown that the photon index in the vicinity of the PSR is ∼1.8 (Blanton & Helfand 1996; Collins, Gotthelf & Helfand 2002; Helfand et al. 2003; Ng et al. 2008).
Evidence for a possible spectral break below 100 GHz was presented by Bock & Gaensler (2005), but these data seem to be inconsistent with previous measurements (Salter et al. 1989) and a single power law cannot be ruled out.
Indeed in our model an injection break below 100 GHz would require a very hard high-energy injection, inconsistent with spectral information at X-ray frequencies. IR data do not provide good constraints (Morton et al. 2007). INTEGRAL data above 15 keV show a particularly hard spectrum, not fully consistent with an expected cooling break in the Chandra band (Terrier et al. 2004), but the PSR might contribute to the flux above 40 keV and be responsible for the excess emission at high energies.
If the X-ray emission in the Chandra band corresponds to freshly injected high-energy particles, one must infer γ2 > 2.6. However, we found that it is not possible to fit the overall SED when adopting such a soft high-energy injection. The reason is simple: given that the average spectral index is close to the one measured at the injection, the SYN break frequency must be above the Chandra band, but this implies a magnetic field B≲ 10 μG. Even assuming ηe = 1, with this small field all the models under-produce the radio emission by at least a factor of 5. We find that it is possible to fit the SYN spectrum, including the average slope in the X-rays, only if 2.2 ≤γ2≤ 2.4.
As to the other parameters, we note the following: the value of ηM depends on age, with younger systems (t∼ 450 yr) requiring a field B∼ 30 μG and older ones (t∼ 650 yr) requiring B∼ 20 μG, but it does not depend on γ2; the value of μe depends on γ2, ranging from 2.5 × 10⁻⁴ for γ2 = 2.4 to 2.5 × 10⁻⁵ for γ2 = 2.2, but it is independent of age. All the models require a very high injection efficiency ηe∼ 1, to reproduce the INTEGRAL points. In Fig. 4, we show the spectrum derived according to the model in Table 1.
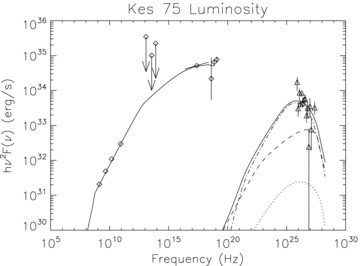
Kes 75; SNR G29.7-0.3. Data points are radio and IR from Becker & Helfand (1984), Salter et al. (1989) and Bock & Gaensler (2005), X-ray from Collins et al. (2002) and Terrier et al. (2004), and gamma ray from Terrier et al. (2008) and Djannati-Ataĭ et al. (2008). The solid line is the total luminosity, dashed line is the IC-CMB, dash–dotted line is the IC on the enhanced local IR background at 1000 K and dotted line is the IC–SYN.
The Lorentz factor corresponding to εc ranges between 2 × 10⁵ and 1.5 × 10⁶, very close to the values derived in Crab. The one corresponding to the model of Fig. 4 is 7 × 10⁵. The minimum Lorentz factor is lower than ∼ 5 × 10⁴, and the average Lorentz factor is ∼ 7 × 10⁴, with an associated multiplicity that has to be greater than 105.
Kes 75 has been detected in gamma rays by HESS (Djannati-Ataĭ et al. 2008; Terrier et al. 2008). The particles responsible for TeV gamma-ray emission, in a purely leptonic model, are the ones emitting SYN radiation in the Chandra band. However the photon index in the TeV range is found to be ∼2.3, far steeper than the average X-ray photon index of 1.9. IC scattering on local SYN radiation gives a negligible contribution of TeV gamma rays. Despite this being a young system, PSR J1846−0258 has a low spin-down luminosity, which results in a particle content about 2 orders of magnitude lower than in Crab and a correspondingly lower energy density of the SYN photon field. IC scattering on CMB photons is about 50 times stronger. However, even this contribution is about a factor of 10 below the observed flux. In addition, scattering on the CMB is expected to occur in the Thompson regime and cannot account for the steepening of the spectral index in gamma rays. A suggestion that has been made is that this steeper spectrum hints at a much warmer radiation background, for which IC should take place in the Klein–Nishina regime. This requirement places the average blackbody temperature of the seed background photons in the range of 1000–2000 K.
With a blackbody spectrum at 1000 K, suppressed by a factor of 5 × 10⁻⁹, it is possible to reproduce the correct gamma-ray luminosity. This contribution corresponds to a local enhancement of the IR background which is only a factor of a few above the Galactic average. Interestingly, as in the case of B1509, Kes 75 is also surrounded by a bright SNR shell, which might be responsible for the enhancement.
The question arises if the TeV gamma rays can be explained by a hadronic component, and in particular by πo decay. Given the very low magnetization, inferred from the SYN spectrum, it can be shown that only weak constraints can be put on ηp; in particular, one can obtain a good fit of the radio and Chandra X-ray data, using ηe∼ 0.5 (which however underpredicts INTEGRAL data) and a slightly higher nebular field, without violating the energetics. However even by assuming that half of the spin-down energy goes into protons, in order to have a significant contribution to the emission in the 10-TeV range, at least 10 M⊙ of target thermal protons are needed. This is far in excess of the swept-up ejecta mass of ∼ 0.1 M⊙, even if it is consistent with the total ejecta mass (in this case, one needs to assume that protons escape from the PWN and interact with the SNR). The main problem in this case is to properly reproduce the observed TeV spectrum. If we assume that its origin is purely hadronic, we predict a peak at 1028 Hz instead of 1026 Hz as is observed. This shift is due to our choice of injection energy for the protons, which is tied to γw. Fermi observations should be able to distinguish between a leptonic and a hadronic model, by constraining the emission below 1 TeV. To properly investigate whether πo decay is a viable possibility of explaining the gamma-ray data, one would need a model for the diffusion of protons outside the nebula, which at the moment we do not have. The simplest possible estimate of the diffusion time of protons outside the nebula, and in the ejecta, gives values that are about an order of magnitude larger than the age of the nebula.
6.5 Old objects
In this section, we discuss two relatively old objects. The code has been developed for the investigation of systems also beyond the free-expansion phase. However the late dynamics, especially if the PSR kick velocity is important, can be quite complex. In addition, old systems are usually very poorly constrained from the observational point of view. The age is generally known only as an order of magnitude estimate, and quite often either the central PSR is not observed (as in the case of G327.1 and IC 443) or the SNR is not observed.
The following discussion highlights the difficulties that one has to face when trying to model sources for which both the quantity and the quality of the data are really poor.
6.5.1 W44
The SNR W44 is known to contain an old PWN, associated with pulsar PSR B1843+01. This is a 267-ms PSR, with a characteristic dipole age of 20 380 yr and a spin-down luminosity of 4.3 × 1035 erg s−1 (Wolszczan Cordes & Dewey 1991). The value of the braking index is not known, while the distance of the PSR is estimated to be 3.1 kpc (Wolszczan Cordes & Dewey 1991).
The SNR W44 (3C 392) has an elongated shape with axes of 25 × 11 arcmin2. Its distance is estimated from H i absorption to be 2.6 kpc, corresponding to a typical SNR radius of 11–13 pc (Cox et al. 1999). The small discrepancy between the estimated distance to the PSR and to the SNR is within the uncertainties, and the association is considered a secure one. The nebula is thought to be a transition object from the spherical shape of young systems to later bow-shock-like morphologies (van der Swaluw et al. 2004). The central pressure is estimated from X-ray observations to be ∼ 1.4 × 10⁹ dyn cm−2 (Cox et al. 1999). Modelling the SNR (Cox et al. 1999; Shelton et al. 1999) leads to the following estimates for the relevant dynamical parameters: ESN = 1051 erg, Mej = 5 M⊙, ρ0∼ 6 cm−3; for the expansion velocity of the SNR, H i emission gives vfs∼ 150 km s−1 (Koo & Heiles 1995). However, all existing models assume the spin-down time of the PSR as the age of the nebula; in addition, the quoted value of vfs is inferred from an H i emitting ring structure which does not trace exactly the SNR, and estimates can be as high as 330 km s−1 (Koo & Heiles 1995).
The PWN is observed in radio (Frail et al. 1996; Giacani et al. 1997) with a typical luminosity of 200 mJy. It has a distinctive cometary shape with the PSR located at the tip of a protruding finger of emission. It is assumed that the PSR has been displaced by its proper motion with respect to the core of the radio emission. X-rays have been detected with both Chandra and XMM–Newton from the head of the cometary nebula, and the flux is measured to be ∼ 2.7 × 10⁻¹³ erg cm-2 s−1 in the 2–10 keV band (Petre, Kuntz & Shelton 2002; Harrus et al. 2006). The radio emission is about twice as extended as the X-rays, which has been interpreted as due to effective cooling in the nebula, for which, however, there is no indication from the spatial behaviour of the spectral index: this is found to be ∼ 2.2 ± 0.3 with no appreciable variations with the distance from the PSR (Harrus et al. 2006). No IR or gamma-ray emission is detected.
The PWN is quite weak compared to the PSR spin-down energy and also appears to be quite small in size. At the distance of the SNR, a typical value for the volume is ∼0.5 pc3, corresponding to a radius of ∼1.5 ly. It is interesting to note that spectral models of the PWN have often assumed a much smaller age of <5000 yr (Petre et al. 2002), which clearly contradicts SNR models. However such models are usually developed assuming that the spectrum is similar to that in the Crab Nebula, which we think is unjustified.
The major problem in modelling this system, as was already recognized by Petre et al. (2002), is the relatively low radio luminosity compared to the integrated PSR spin-down power. This suggests a much younger system: in particular, we find that a braking index close to 2 and an age of about 10 000–15 000 yr are required to reproduce the observed radio emission. The average magnetic field must be well below equipartition (ηM has to be <0.002, corresponding to a nebular field below 10 μG) in order to avoid overproducing the radio emission.
This small value gains some support from the lack of spectral steepening with distance, which suggests that cooling is not important. Indeed, the difference in size between the radio and X-ray nebula could be explained by the presence of a much stronger magnetic field in the head of the nebula than in the body, resulting in the suppression of X-ray emission in the latter. In Table 5, we list the values of the parameters used to produce the curve in Fig. 5. The value we find for the central pressure is ∼ 1.6 × 10⁹, in agreement with X-ray observations, but the expansion speed is found to be higher, vfs∼ 300 km s−1, as a consequence of the younger assumed age.
| Obj. | t | ESN | Mej | ρ0 | α | L0 | τ | β | γ1 | γ2 | ηe |
| W44 | 15000 | 1 | 5 | 3 | 0 | 0.018 | 22 000 | 2.82 | 1.3 | 2.55 | 0.85 |
| K2/3 | 8000 | 1 | 8 | 0.2 | 0 | 0.34 | 13 750 | 2.66 | 1.2 | 2.82 | 0.95 |
| Obj. | t | ESN | Mej | ρ0 | α | L0 | τ | β | γ1 | γ2 | ηe |
| W44 | 15000 | 1 | 5 | 3 | 0 | 0.018 | 22 000 | 2.82 | 1.3 | 2.55 | 0.85 |
| K2/3 | 8000 | 1 | 8 | 0.2 | 0 | 0.34 | 13 750 | 2.66 | 1.2 | 2.82 | 0.95 |
| Obj. | t | ESN | Mej | ρ0 | α | L0 | τ | β | γ1 | γ2 | ηe |
| W44 | 15000 | 1 | 5 | 3 | 0 | 0.018 | 22 000 | 2.82 | 1.3 | 2.55 | 0.85 |
| K2/3 | 8000 | 1 | 8 | 0.2 | 0 | 0.34 | 13 750 | 2.66 | 1.2 | 2.82 | 0.95 |
| Obj. | t | ESN | Mej | ρ0 | α | L0 | τ | β | γ1 | γ2 | ηe |
| W44 | 15000 | 1 | 5 | 3 | 0 | 0.018 | 22 000 | 2.82 | 1.3 | 2.55 | 0.85 |
| K2/3 | 8000 | 1 | 8 | 0.2 | 0 | 0.34 | 13 750 | 2.66 | 1.2 | 2.82 | 0.95 |
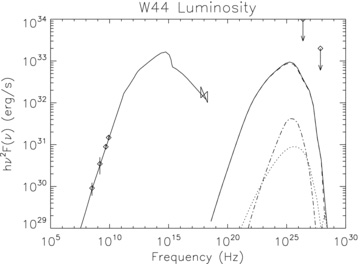
W44. Data points are radio from Frail et al. (1996) and Giacani et al. (1997), X-ray from Petre et al. (2002) and Harrus et al. (2006), upper limits on gamma ray from Aharonian et al. (2002) and Abdo et al. (2009). The solid line is the total luminosity, dashed line is the IC-CMB, dash–dotted line is the IC on the local IR background (same as for Crab nebula) and dotted line is IC–SYN.
It is evident that the quantity and quality of existing data (only four measurements are found in the literature) do not allow us to constrain the PWN model as much as it is possible for younger systems. However, by repeating the same analysis we did in the previous section, we find that the parameter μe in the model is 8 × 10⁻³, which corresponds to a Lorentz factor at εc equal to 2 × 10⁵, while the average wind Lorentz factor is found to be γw≲ 104, corresponding to a multiplicity κ≳ 105.
One thing to note is that the spectrum barely extends to X-ray frequencies. As pointed out above, this is due to the low value of the magnetization we adopt. If the magnetization in the head is higher, as could be expected due to compression in the bow shock, this might enhance the X-ray emission.
Another striking feature is the bump at around 1015 Hz: this is a typical feature of post-reverberation systems. During the reverberation phase, there is a typical energy at which SYN losses are balanced by adiabatic compression gains. Particles tend to accumulate at this energy.
6.5.2 K2/3 Kookaburra
The ‘Kookaburra’ is a complex of compact and extended radio/X-ray and gamma-ray sources. Diffuse X-ray emission and point-like sources have been detected by ASCA (Roberts et al. 1999; Roberts, Romani & Johnston 2001), XMM–Newton and Chandra (Ng Roberts & Romani 2005). We are here interested in the north-east wing of the complex, where at radio and X-ray frequencies a nebula is found, hosting a young and energetic pulsar, PSR J1420−6048. The PSR location is also coincident with TeV gamma-ray emission detected by HESS (Aharonian et al. 2006).
PSR J1420−6048 is a 68.2-ms PSR, with a characteristic dipole age of 13 050 yr and a spin-down luminosity of 1037 erg s−1 (D'Amico et al. 2001). The braking index is not known. The distance of the PSR is estimated to be 5.5 ± 0.8 kpc (Aharonian et al. 2006).
Identifying the PWN associated with PSR J1420−6048 is, however, rather problematic. The wing-like structure hosting the PSR is usually referred to as K2. In coincidence with the PSR an enhancement of radio emission, usually referred to as K3, is also observed. K2 has an extent of ∼ 15 × 10 arcmin2, a total flux at 20 cm of ∼1 Jy and a spectral index of 0.2 ± 0.2, while K3 has an extent of about 3 arcmin, a total excess flux at 20 cm of ∼20 mJy and a spectral index of 0.4 ± 0.5 (Roberts et al. 1999). No IR detection has been reported.
X-rays have been detected by ASCA in the 2–10 keV band, with an extent of about 7 arcmin, an integrated flux of 4.8 × 10⁻¹² erg cm-2 s−1 and a spectral index of 1.4 (Roberts et al. 2001). A much more compact (0.5 arcmin) but extended source has been detected by Chandra around the PSR, with a total flux, extrapolated to the 2–10 keV band, of 1.3 ± 0.14 × 10⁻¹² erg cm-2 s−1 and with a spectral index of 2.3 ± 0.9 (Ng Roberts & Romani 2005).
Gamma rays were first detected by EGRET (Thompson et al. 1996) and more recently by HESS (Aharonian et al. 2006). The total HESS luminosity in the 0.4–20 TeV band is 5.1 × 1034 erg s−1, for the assumed distance, and the spectral index is found to be ∼2.2. The 2σ angular extension of the gamma-ray emission (∼7 arcmin) implies a nebular size of ∼11 pc.
One immediately realizes that these data are somewhat confusing. We think that the standard interpretation, according to which the small K3 region is the PWN while the K2 region is the SNR (Roberts et al. 2001), seems unlikely. Indeed, within the framework of our model, this assumption leads to unphysical values for the SN energy and ejecta mass and to overpredict the radio emission.
The larger extent of the ASCA source, compared to the Chandra one, goes against the expectation that the nebular size should shrink at higher frequencies. The spectral index of the TeV emission (interpreted as IC-CMB) is consistent with the steeper Chandra spectrum, but not with the flat ASCA one.
Even the radio data are not conclusive: if one assumes that the PWN contributes also to the K2 emission, rather than just to K3, the radio emission changes by about 2 orders of magnitude. Indeed, as for W44, we will present here just a simple model fit to the data.
The major difficulty in accounting for what is observed relates to the low efficiency in both X-rays and radio, together with the ratio Lγ/LX > 1, which is suggestive of a large nebular content of low-energy particles. A decent fit to the data can only be achieved if one assumes a relatively young system, with a steep high-energy spectrum (similar to 3C 58) and a weak magnetization (comparable with that in Kes 75). Fig. 6 shows the result of the model corresponding to the parameters in Table 5. The nebular radius is found to be ∼5 pc in agreement with the HESS size. The magnetic field is inferred to be ∼ 5 μG. To get the steeper Chandra spectrum, one needs to assume a cooling break around 1016 Hz. This is also necessary in order to reproduce the correct TeV spectrum. As already suggested by Aharonian et al. (2006), in the TeV range the IC-CMB dominates over the IC on the standard galactic background. Indeed, our model underpredicts the TeV emission by a factor of 4–5. The local photon background must be higher if the observed TeV flux has to be explained as IC emission: the TeV flux shown in Fig. 6 was obtained by assuming an IR background in the form of a blackbody at 200 K, with a photon density about a factor of 4–5 higher than the standard galactic background.
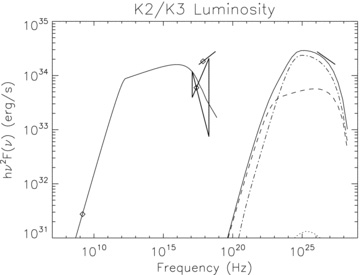
K3/2 Kookaburra. Data points are radio from Roberts et al. (1999), X-ray from Roberts et al. (2001), and gamma ray from Ng Roberts & Romani (2005) and Aharonian et al. (2006). The solid line is the total luminosity, dashed line is the IC-CMB, dash–dotted line is the IC on the local IR background (assumed as a blackbody at 200 K) and dotted line is IC–SYN.
The parameter μe in the model is found to be 5 × 10⁻⁵, which corresponds to a Lorentz factor at εc equal to 2 × 10⁵, while the average wind Lorentz factor is γw≲ 104, corresponding to a multiplicity κ≳ 105.
7 DISCUSSION AND IMPLICATIONS
Let us briefly review here our findings and what general conclusions can be drawn from the results of our attempt at modelling different objects, both young and old.
7.1 Summary of the results
First, it is remarkable that our one-zone model, despite its simplifications, has worked surprisingly well for the observed SEDs in all the cases we considered. This is already an interesting result, since the assumption of efficient mixing that is at its base is likely a poor approximation at high energies (in the X-ray band), where the flow pattern and the magnetic field structure in the inner nebula are expected to play a dominant role.
The agreement between the model fit and the data is extremely good in the case of Crab, where the unknown parameters are reduced to a minimum (essentially the SNR properties). Our model seems to work rather well for young systems in general, but the quality of the data and the limited spectral coverage lead to larger uncertainties. In the case of strongly magnetized sources, such as 3C 58 and the nebula associated with PSR B1509, we find that in order to reproduce the data our model requires an energy input in the PWN which exceeds the PSR release by 20–30 per cent, judging from the current spin-down power. This conclusion does not seem to be affected by uncertainties in the distance to the sources: moving them closer to (further from) us would decrease (increase) the estimated brightness, but at the same time it would make them smaller and younger (larger and older), leaving the discrepancy between the radiated and accumulated energy almost unaltered. We think it likely that this discrepancy is due to the simplifying assumptions of the one-zone model, which become progressively more important at large magnetizations. In particular, as also shown by recent multidimensional simulations (Volpi et al. 2008), the radio and X-ray emitting particles might sample different magnetic fields. At the same time, it is worth keeping in mind that the estimate of the PSR spin-down power is based on the assumed canonical moment of inertia for neutron stars: I = 1045 g cm2. A 20 per cent discrepancy in two systems is compatible with present uncertainties.
Our model seems to constrain with good accuracy the value of εc. It is not possible to vary the value of εc by more than a factor of a few and still reproduce the radio and X-ray data, without violating the overall energy by more than an order of magnitude. At the same time, our model allows us to derive, for each object, an upper limit on the wind Lorentz factor and a lower limit on the pair multiplicity. The limits we put on γw and κ are strictly valid only if the wind has a unique Lorentz factor and the energy scales εm and εc respect the assumed scaling with time, proportional to the PSR voltage. It is not easy to predict how a possible latitude dependence of the wind Lorentz factor, such as that included in axisymmetric models of PWNe (e.g. Del Zanna et al. 2004), or a different dependence on time of the energy scales would affect our conclusions.
7.2 Implications for the wind composition
A controversial issue in the study of PWNe, and more broadly PSR winds, is the possible presence of ions or high-energy particles. Given that a direct signature of their presence in the wind is not available, all efforts have focused on the search for possible observables in the PWNe that could be indicative of their presence. Let us briefly recall why ions where invoked in the first place, what is the present status of those arguments and what the present work tells us about their contribution to the PWN emission.
The idea that a particle population with a larger Larmor radius (ions or leptons in the return current) could be carrying most of the wind energy was made attractive by the following three main reasons: these particles could help solve the problem of particle acceleration at the PSR wind TS; they could explain the wisps variability in the Crab nebula; finally, in the case of ions, they could solve the discrepancy between the predictions of 1D MHD models and the gamma-ray flux observed from Crab.
As far as particle acceleration is concerned, at a relativistic pair shock, efficient diffusive shock acceleration is shown to be possible only if the shock magnetization is extremely low (Spitkovsky 2008). The 2D MHD models of PWNe (Del Zanna et al. 2006; Camus et al. 2009) use a simple model of field reversal across the equator where a current sheet occurs, such that the appropriate conditions for acceleration would be realized only in a small sector of the PSR wind TS, with no more than a few per cent of the total wind energy flux flowing through it. On the other hand, complete dissipation of the ‘striped’ component of a PSR's wind (Coroniti 1990) would create a weakly magnetized current sheet occupying the full rotational latitude sector |λ| < i, i = angle between the rotation axis and the direction of the PSR's magnetic moment. Then the fraction of the energy flow carried in the current sheet would be sin i, which can be quite large. The truth would be between these extremes. One, however, needs to remember that the presence of a jet puts a lower limit on the average magnetization, and full dissipation of a large striped wind zone might fail to produce the observed structures.
On the other hand, the presence of an energetically significant ion component in the PSR wind is found to lead to efficient acceleration of the pairs (Hoshino et al. 1992; Amato & Arons 2006). This effect is the consequence of the large Larmor radius of the ions, whose gyration introduces long wavelength turbulence through cyclotron instability. The same result could come from the presence of high-energy leptons, accelerated as a consequence of runaway dynamics in the equatorial current layer (Arons, in preparation).
As to the wisps' variability, Spitkovsky & Arons (2004) showed that this could be explained as the result of compression waves associated with the high-energy current carriers' (ions, in their case) gyration in the shock region; in order to reproduce the observed brightness contrast, one would again need the current carriers (the ‘beam’) to be energetically significant: γbeammbeam/γwm± > 2 κ±. An alternate explanation of the wisp variability, which does without the kinetic effects of the high-energy particles' beam, has been recently provided by Camus et al. (2009), who have shown that it can also be recovered within the framework of pure MHD, due to global instabilities of the TS.
One final consideration concerns the possible detection of signatures of high-energy protons from gamma rays. Modelling of the TeV emission from the Crab Nebula, based on the 1D Kennel & Coroniti flow (Atoyan & Aharonian 1996), was shown to underpredict the observed flux by a factor of ∼5, leading them to suggest a possible contribution from the decay of neutral pions produced in nuclear collisions of relativistic protons. More recently, the presence of relativistic protons as the source of high-energy gamma-ray emission was also suggested in the Vela PWN (Horns et al. 2006). In the case of Vela, however, a later determination of the density of the thermal protons (that would serve as a target for nuclear collisions) resulted in too low a value and led to substantial questioning of the initial claim (LaMassa, Slane & de Jager 2008). At the same time, Volpi et al. (2008) showed that within a multidimensional model for the flow structure in Crab, the estimated IC-TeV emission is easily overproduced, for the same parameters that allow one to better fit the lower energy SYN emission. This suggests that the results are indeed strongly model-dependent and that the discrepancies are likely due to problems with the originally adopted MHD model.
This is also the conclusion we reach in this work. We can reproduce the TeV emission from the Crab and find results in agreement with Fermi observations without any need for a proton contribution. In the case of both B1509 and 3C 58, our pair+magnetic field energetic is already exceeding the estimated PSR energy input by 20 per cent, and fitting the gamma rays through π0 decay requires that protons alone carry far more energy than the nebula is currently estimated to store. Finally, in the case of Kes 75, in order to ascribe the excess TeV emission to protons, one needs to assume that protons can effectively diffuse out of the nebula and experience the whole ejecta mass as a target.
We also find that, as one can easily see from Table 1, given the already high value of the quantity ηe+ηM, there is little energy (∼20 per cent at most) left to be carried by any other higher energy component. We can thus conclude that modelling of the SED and of the PWN–SNR evolution suggests that, if ions are present, they contribute a negligible fraction of the energy in the nebula. There is still the unsolved problem of particle acceleration, which neither this work nor the MHD simulations can address. A definitive answer would probably require a merging of models for shock acceleration and MHD models for the global evolution of the PWN.
7.3 Interpretation of spectral breaks
Our study has reinforced a long-standing puzzle: the electron (and positron) accelerator at work in PWNe knows how to create a spectrum convex in energy space, well represented by a broken power law. As was advanced by Kennel & Coroniti (1984b), the spectral steepening observed between optical/soft X-ray energies and the harder (ɛ > 10 keV) spectrum is well understood as the effect of SYN energy losses, with the pre-cooled spectrum being a power law  from Table 1. The steepening between mid-IR and optical, when observed, requires energy space structure in the accelerator (an ‘intrinsic break’). The high-energy spectrum can be attributed to diffusive acceleration at the TS, at least qualitatively – Fermi acceleration in relativistically very low σ shocks in the test particle limit yields a spectrum N (E) ∝E−2.2 (Keshet & Waxman 2005). The radio spectrum requires a much harder distribution of the lower energy particles,
  .
.
The standard model (Kennel & Coroniti 1984a,b), developed to account for the radiation from Crab at near-IR and shorter wavelengths, assigns the conversion of the PSR wind energy in the particle spectra that emit the observed SYN radiation to diffusive Fermi acceleration at the wind TS. Diffusive shock acceleration, with isotropic particle scattering in the upstream and downstream flow frames, always shows particle spectra with a Maxwellian at low energy, plus a power-law supra-thermal tail at high energy, with the temperature of the Maxwellian set by the shock jump conditions (except when the acceleration of the tail is very efficient). These properties are well exhibited by particle-in-cell (PIC) simulations of relativistic shocks in unmagnetizede± plasma or, if magnetized, in upstream quasi-parallel flow geometry (Spitkovsky 2008; Spitkovsky & Sironi 2009). Our models identify the transition between the soft, high-energy spectrum and the hard, low-energy spectrum as being at the energy εc, typically 105 - 106m±c2 (see Table 1). In the Kennel & Coroniti (1984b) model, this energy was identified as the lower cut-off of the shock-accelerated power law and as the ‘temperature’≈γwm±c2 of the flow downstream of the TS, thus giving rise to the belief that PSR winds have an upstream flow Lorentz factor γw∼ 106. The question of how a transverse relativistic shock with significant magnetization (σw > 10−3) can efficiently accelerate a non-thermal particle spectrum remains unanswered – existing PIC simulations suggest that the required large amplitude turbulence does not form.
The Kennel and Coroniti model and its descendants deliberately neglected the radio emission from the Crab Nebula (and, by extension, other PWNe). The large (by number) population of particles with E < εc suggests γw to be much smaller, if the radio and mid-IR to far-IR emitting particles come from the PSR. The fact that the PSRs are the most likely source of the low-energy particles in each of the nebulae gains support from the existence of the radio ‘wisp’ features in the Crab (Bietenholz et al. 2004) closely associated with the similar time variable structures seen in optical and X-ray imaging, as well as similar structure seen in 3C 58 (Bietenholz 2006) – these structures are clearly coincident with the TS. Then, in the regions of the flow populated by the large particle flux feeding the low-energy population, γw∼ 104 or smaller.
The low-energy particle spectrum is definitely not a single temperature relativistic Maxwellian, with T∼εc. Since the TS is not spherical, becoming more oblique in higher rotational latitude regions (Del Zanna et al. 2004; Komissarov & Lyubarsky 2004), the post-shock temperature declines with increasing latitude, suggesting the possibility that the low-energy particles enter in the polar regions of the outflow. However, replicating the observed spectrum as the envelope of a sequence of Maxwellians requires a factor of ∼100 variation in temperature, which requires most of the mass flux to be nearest to the rotation poles. There is no sign of pole to equator asymmetry in the radio emission near the PSRs, except for the radio wisp features in the Crab, which are components of the immediate post-shock flow, as judged from the optical and harder photon emission. In addition, PSR pair production models show no sign of such strong polar enhancements of the mass flux. However we cannot rule out that mixing and effects related to integration along the line of sight might prevent the detection of the implied variations, even if these will have to be highly efficient.
In any case, let us assume in the following that also the low-energy particle spectrum results from some acceleration process, rather than from the convolution of different thermal distributions, and let us speculate on the nature of such a process.
Turbulence and associated Fermi II acceleration in and around the TS is one appealing possibility. The ‘wisp’ motion, observed from the radio through X-rays [see Hester (2008) for a comprehensive review], has recently been interpreted as the result of the strongly variable TS structure found in high-resolution MHD simulations of the Crab nebula (Camus et al. 2009). The shock instability implied is a TS variant of the standing accretion shock instability, with outer scale variable velocity δv∼v∼ 0.6c and length-scale δr∼r∼ 0.5–1 light-year. The magnetized motions observed in the simulations (which do well in replicating the time variable spatial structure observed in the nebular ‘wisps’) can act as an accelerator through the Fermi II process (Kardashev 1962; Stawarz & Petrosian 2008), creating electron and positron spectra N(E) =N0(E/E0)−s.
 , where ε=Taccel/Tescape. These models include an analogue of scattering from large amplitude magnetic inhomogeneities (Fermi's original model), in the case where the wave energy spectrum scales in proportion to k−2, with k being the wavenumber. This case is germane to acceleration due to pair interaction with large-scale moving magnetic fluctuations: the acceleration time-scale for interaction with large-scale moving ‘eddies’ is
Turning this idea into a full physical model may require extending the MHD models to 3D. All models to date have been 2D, axisymmetric, with an exclusively toroidal magnetic field. Particles then cannot scatter radially, in order to sample adjacent moving eddies, but are confined to toroidal flux tubes, which move in and out in radius around average positions in the outflow (and inflow, at higher latitudes) in the turbulent region. It is possible that magnetic pumping in these flux tubes might substitute for particle scattering in quasi-isotropic turbulence as an acceleration mechanism (e.g. Melrose 1969; Kuijpers et al. 1997). However, polarization studies have already demonstrated that there are substantial poloidal magnetic fields in PWNe inner regions, at least in the Crab. The TS instability identified by Camus et al. (2009) is not likely to be restricted to 2D – perhaps the assumption of quasi-isotropic turbulence, with forcing scale ∼Rshock, is the most natural starting point for further pursuit of this idea.
It is clear that a key point for the model to succeed is that the proposed turbulently accelerated spectrum at low energy merges smoothly into the shock-accelerated spectrum at high energy. Since the macroscopic turbulence is closely associated with the shock, a smooth merger is at least thinkable. In this context, the meaning of εc changes completely with respect to the Kennel and Coroniti interpretation: this should not be identified with the post-shock temperature (which according to the present model is about an order of magnitude lower), but rather with the energy above which the low-energy accelerator (Fermi II in the turbulent flow, in the suggestion made here) fades out and relativistic diffusive shock acceleration (DSA) takes over.
7.4 How do we move forward?
Multi-D high-resolution MHD and PIC simulations of the TS region separating the freely expanding wind from the subsonically expanding nebulae will shed light on the possibly turbulent flow and on whether that turbulence can act as the low-energy accelerator discussed previously. A useful first step would be to couple the diffusion–advection equation in energy space with the MHD calculations. Observationally, IR measures of the young PWNe, using the Herschel space telescope (Pilbratt 2009) as well as near-IR instruments on the ground and in space, will greatly improve our understanding of the physics behind the broken power laws in energy space inferred here for the injected particle distributions. These instruments will have more than sufficient angular resolution to resolve the PWNe, thus emphasizing the need for multidimensional models to quantitatively interpret the observations.
For all the objects studied, the plasma injection rates, here inferred from the evolutionary models, not simply taken from the average over the nebular lifetimes, exceed 105 times the Goldreich–Julian rate (Table 6). Such high rates can be understood only as the result of pair creation within the PSRs' magnetospheres; given the spectral continuity in the SEDs, models that rely on the radio and far-IR emitting particles, which dominate the injection rates, being accelerated from the thermal plasma in and around the nebulae, are less likely than injection from the PSRs. Our results support and extend a long-held suspicion (Gallant et al. 2002), previously based only on analysis of the Crab nebula, that the particle loss rates from young, high voltage PSRs are substantially in excess of the inferences of particle outflow from all known magnetospheric pair creation models. The answer may lie in intrinsic time dependence of pair creation within PSR polar caps (e.g. Timokhin 2009) or in the so far unexplored outer magnetosphere accelerators associated with the boundary layer return currents separating the closed and open field lines (Arons 2009). Fermi gamma-ray observations are and will be useful in constraining magnetospheric pair creation models.
Summary of the inferred lower limits on multiplicity.
| Crab | 3C 58 | MSH 15−52 | Kes 75 | W44 | K2/K3 |
| 106 | 5 × 10⁵ | 3 × 10⁵ | 105 | 105 | 105 |
| Crab | 3C 58 | MSH 15−52 | Kes 75 | W44 | K2/K3 |
| 106 | 5 × 10⁵ | 3 × 10⁵ | 105 | 105 | 105 |
Summary of the inferred lower limits on multiplicity.
| Crab | 3C 58 | MSH 15−52 | Kes 75 | W44 | K2/K3 |
| 106 | 5 × 10⁵ | 3 × 10⁵ | 105 | 105 | 105 |
| Crab | 3C 58 | MSH 15−52 | Kes 75 | W44 | K2/K3 |
| 106 | 5 × 10⁵ | 3 × 10⁵ | 105 | 105 | 105 |
We neglect a possible component of heavy ions in the wind's composition (Gallant & Arons 1994; Spitkovsky & Arons 2004): this subject will be discussed later on.
NB was in part supported by NASA through Hubble Fellowship grant HST-HF-01193.01-A, awarded by the Space Telescope Science Institute, which is operated by the Association of Universities for Research in Astronomy, Inc., for NASA, under contract NAS 5-26555; and from NORDITA. JA acknowledges the support of the US National Science Foundation (AST-0507813), the NASA Astrophysics Theory Program (NNG06108G) and the taxpayers of California.
REFERENCES
