


Abstract
From a combination of Multi-Element Radio-Linked Interferometer Network (MERLIN) and global Very Long Baseline Interferometry (VLBI) observations of the starburst galaxy M82, images of 36 discrete sources at resolutions ranging from ∼3 to ∼80 mas at 1.7 GHz are presented. Of these 36 sources, 32 are identified as supernova remnants, two are H ii regions and three remain unclassified. Sizes, flux densities and radio brightnesses are given for all of the detected sources. Additionally, global VLBI only data from this project are used to image four of the most compact radio sources. These data provide a fifth epoch of VLBI observations of these sources, covering a 19-yr time-line. In particular, the continued expansion of one of the youngest supernova remnants, 43.31+59.3, is discussed. The deceleration parameter is a power-law index used to represent the time evolution of the size of a supernova remnant. For the source 43.31+59.3, a lower limit to the deceleration parameter is calculated to be 0.53 ± 0.06, based on a lower limit of the age of this source.
1 INTRODUCTION
Supernovae and supernova remnants (SNR) are a significant by-product of the intense star formation found in starburst galaxies. As such, they play an important role in galaxy evolution and the feedback of material into the interstellar medium (ISM), and collectively via energy deposition into the ISM can drive massive superwinds as can be found in nearby galaxies such as M82 (Ohyama et al. 2002). Individual SNR are interesting in their own right and have been the subject of intense study for decades (e.g. Bartel & Bietenholz 2003; Marcaide et al. 2009). However, a population of SNR within a galaxy can provide information on the statistical properties of SNR evolution within the ISM, as well as provide insight into the star formation history of the galaxy via independent tracers of the supernova and star formation rates.
Detailed investigations of SNR within the Galaxy are hindered both by the difficulty in determining accurate distances and by the fact that all known Galactic SNR are over 150 years old (Green et al. 2008). The use of radio interferometry allows high-resolution observations of a starburst region and reveals sources that are otherwise obscured by the high levels of gas and dust associated with the star formation. In addition, such studies are free from selection effects as all of the SNR are at essentially the same distance and are observed with the same angular resolution and brightness sensitivity.
For these reasons, a number of starburst galaxies have been well studied using radio interferometric techniques, for example the southern hemisphere starburst galaxy, NGC 253 (e.g. Lenc & Tingay 2006) and the more distant intense starburst of Arp 220 (e.g. Parra et al. 2007). However, as one of closest starburst galaxies, M82 (∼3.2 Mpc, Burbidge, Burbidge & Rubin 1964) presents a unique opportunity for a more detailed investigation of a young population of SNR.
The first detailed radio observations of M82 began in the 1970s (Hargrave 1974; Kronberg & Wilkinson 1975) with the discovery of several compact sources within the central kpc. Subsequent observations (Unger et al. 1984; Kronberg, Biermann & Schwab 1985; Huang et al. 1994) have shown these to be part of a population of SNRs and H ii regions now approaching 100 identified sources. Multi-Element Radio-Linked Interferometer Network (MERLIN) observations of M82 have revealed the parsec-scale, shell-like structures of a large portion of these sources (Muxlow et al. 1994; Fenech et al. 2008) at 5 GHz, although detailed observations at lower frequencies have been limited by the achievable resolutions and brightness temperature sensitivities of available interferometers.
High angular resolution observations using the European VLBI (Very Long Baseline Interferometry) Network (EVN), at a frequency of 1.7 GHz, began in 1997 utilizing previous 1.4 GHz observations from 1986, in order to observe and monitor the five most compact sources within M82. This began a now established global VLBI monitoring programme of these compact sources. The fifth epoch of this programme is presented here, extending the timeline of these observations to 19 yr. However, these purely VLBI observations lack the surface brightness sensitivity to image all but the most compact objects. To remedy this in this work we present results from the first combined, simultaneous MERLIN and global VLBI observations of M82, which have enabled high surface brightness imaging at mas resolutions of the wider population of SNR and H ii regions.
We present the results of these combined observations in this paper. The detected population of sources is discussed in Section 3.1. The most compact sources are discussed individually as observed in the global VLBI only observations along with a detailed investigation of the possible deceleration of 43.31+59.2 in Section 4.3.1. Section 5 discusses the SNR environment in M82 and a summary is provided in Section 6.
2 OBSERVATIONS AND IMAGE PROCESSING
This paper includes observations of M82 at 1.7 GHz using both MERLIN and global VLBI as well as archival global VLBI and EVN observations in 1986, 1997, 1998 and 2001.
2.1 New observations
Observations of M82 were performed with seven telescopes of the MERLIN array on the 2005 March 3, at a frequency of 1.7 GHz. Global VLBI observations were made simultaneously at the same frequency and included the use of 10 telescopes of the Very Long Baseline Array (VLBA) in the USA as well as Westerbork, Medecina, Noto and Effelsberg antennas from the EVN. The global VLBI data also incorporated information from two MERLIN telescopes; the 76-m Lovell and 32-m Cambridge telescopes. The observations were made over a period of 18 h with both the MERLIN and global VLBI arrays switching between M82 and the same phase calibration source J0958+65; this facilitates the combination of the two separate data sets.
2.1.1 Global VLBI
The global VLBI data cover a range in frequency of 1.6595–1.6755 GHz, split over 128 channels, each 250 KHz in width. The data were correlated at Joint Institute for VLBI in Europe (JIVE) centred on the position of the most compact radio source 41.95+57.5. All subsequent data reduction and imaging was performed using the NRAO's aips software. Amplitude calibration was performed using the system temperature and gain information provided for each telescope. The final delays, fringe rates and antenna gains were found for the calibration sources J0958+65 and J0927+39 and then applied to the target source, M82.
2.1.2 MERLIN
The MERLIN data were reduced using the MERLIN pipeline, utilizing observations of the calibration source, 3C84 to set the flux density scale and the point source calibrator J0927+39 to perform a bandpass calibration. These MERLIN observations were reduced using standard routines to apply phase reference solutions from the phase calibrator J0958+65 to M82. Both the global VLBI and MERLIN observations were made using spectral channels to facilitate wide-field imaging; the channel setup used in each case is described in Table 1.
Observing information for the 1.7 GHz observations made on 2005 March 3.
| Array | MERLIN | Global VLBI |
| Central frequency (GHz) | 1.6646 | 1.6675 |
| Total bandwidth (MHz) | 8 | 16 |
| Number of channels | 32 | 128 |
| Bandwidth per channel (KHz) | 250 | 125 |
| Array | MERLIN | Global VLBI |
| Central frequency (GHz) | 1.6646 | 1.6675 |
| Total bandwidth (MHz) | 8 | 16 |
| Number of channels | 32 | 128 |
| Bandwidth per channel (KHz) | 250 | 125 |
2.1.3 Combination
Following the separate calibration some preparation was required to enable combination. This included the splitting of the two data sets into their individual spectral channels which were then recombined to ensure the frequencies of the data sets matched (within 0.1 per cent), whilst not averaging the channels to enable wide-field imaging with the global VLBI data. This process avoids introducing the effects of bandwidth smearing. The flux density scales were then checked using the LT-CM baseline, common to both the MERLIN and global VLBI data, for observations of the calibration sources. A small positional correction of the global VLBI data was performed to ensure coincidence with the reference position of the MERLIN data. Following this correction, the two data sets were coincident to within ≲0.10 mas. The data sets were then combined using the aips task dbcon.
2.2 Archive VLBI and EVN observations
Four previously published data sets have been included in the analysis presented here. EVN observations from 1986 and 1997 initially published in Pedlar et al. (1999) and global VLBI observations from 1998 and 2001 published in McDonald et al. (2001) and Beswick et al. (2006). The telescopes included in each of these observations are listed in Table 2 as well as those from the most recent epoch. Full details of the reduction procedures used for each of these data sets are described in the literature. The 1997, 1998 and 2001 observations all utilized very similar techniques for the observational and data reduction processes. The 1986 observations differed slightly in that the observing frequency used was 1.4 GHz and the flux density scale was based on the total flux density of 41.95+57.5, at the epoch of these observations.
A summary of the EVN and global VLBI observations of M82.
| Epoch | Date | Array | Frequency (GHz) | Reference |
| 1 | 1986 Dec. 11 (1986.95) | Ef, Jb, Wb, Mc | 1.4 | Pedlar et al. (1999) |
| 2 | 1997 Jun. 02 (1997.42) | Ef, Jb, Mc, Nt, On, Wb, Cm, Tr | 1.7 | Pedlar et al. (1999) |
| 3 | 1998 Nov. 28 (1998.91) | VLBA, Y1, Ro, Go, Ef, Jb, Mc, Nt, On, Wb, Tr | 1.7 | McDonald et al. (2001) |
| 4 | 2001 Feb. 23 (2001.15) | VLBA, Y1, Ro, Ef, Jb, Mc, Nt, On, Wb, Tr | 1.7 | Beswick et al. (2006) |
| 5 | 2005 Mar. 03 (2005.17) | VLBA, Jb, Ef, Cm, Wb, Nt, Mc + MERLIN | 1.7 | This paper |
2.3 Imaging
Following combination, the MERLIN+global data were imaged using the aips task imagr and deconvolved with the Högbom cleaning algorithm (Högbom 1974). In order to image each source in the most suitable way, a number of resolutions were used. Initially, a beam size of 50 mas was used together with a cellsize of 10 mas and a robustness weighting of 0. The whole of the central 700 pc of M82 was imaged in this way using ten 1024 × 1024 fields. These 50 mas field images have a  rms noise level of ∼310 μJy beam−1 and a brightness temperature sensitivity level of ∼5900 K. Images with resolutions between 25 and 50 mas (in 5 mas steps) as well as 60, 70 and 80 mas using a Gaussian taper to give the required resolution were also produced. The final parameters used to produce the images presented in Section 3 are listed in Table 3.
The beam size and corresponding noise levels of the MERLIN and global VLBI combined images used to produce the contour plots of the individual sources at 1.7 GHz.
| Resolution (mas) | rms noise level (μJy beam−1) |
| 25 | 27.0 |
| 30 | 28.0 |
| 35 | 29.6 |
| 40 | 32.5 |
| 50 | 31.1 |
| Resolution (mas) | rms noise level (μJy beam−1) |
| 25 | 27.0 |
| 30 | 28.0 |
| 35 | 29.6 |
| 40 | 32.5 |
| 50 | 31.1 |
The observational setup for this experiment has been chosen to provide a well-sampled, evenly spaced spatial frequency coverage with minimal gaps (see Fig. 1), achieved in this case using a large number of telescopes to perform a full imaging track of a circumpolar source. This limits any image fidelity or brightness sensitivity issues as a result of an incomplete aperture coverage and represents the state-of-the-art in long baseline array observations. Multiple resolutions were used to provide the best image of each source and ensure that the Gaussian tapering applied did not result in any significant change in the observed source structures over the resolutions sampled.
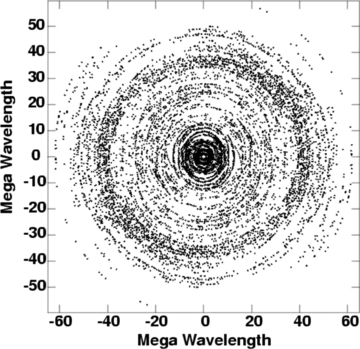
The spatial frequency coverage of the combined MERLIN and global VLBI observations at 1.7 GHz. The plot shows every 500th visibility following the splitting of the data into individual spectral channels and subsequent combination.
A MERLIN only image has been used to measure the flux density values presented in Table 5. This naturally weighted 4096 × 2048 image has a restoring beam of 130 mas and a cellsize of 30 mas, a contour image of which is shown in Fig. 2. The rms noise over source-free areas of this MERLIN-only image is ∼55 μJy beam−1.
Flux densities and deconvolved sizes of the sources detected in the global VLBI+MERLIN data set. The names of each source are a combination of their B1950 Right Ascension seconds and Declination arcsec, offset from 09h51m 00s and +69°54′00″, following the convention of Kronberg et al. (1985). The J2000 Right Ascension and Declination are as measured in the combined data and are offset from 09h55m00s and +69°40′00″. The flux densities are measured from the MERLIN-only data. Errors are shown in brackets where appropriate.
| Name | RA | Dec. | Diameter | Peak flux density | Total flux density | |
| (J2000) | (J2000) | (mas) | (pc) | (mJy beam−1) | (mJy) | |
| 38.76+53.5 | 47.53 | 39.94 | 69(9) × 46(7) | 1.1 × 0.7 | 0.36 (0.03) | 0.52 (0.08) |
| 39.10+57.3 | 47.88 | 43.72 | 229 | 3.5 | 3.63 (0.05) | 5.74 (0.10) |
| 39.28+54.1 | 48.04 | 40.59 | 164 | 2.5 | 0.27 (0.06) | 0.40 (0.11) |
| 39.40+56.2 | 48.16 | 43.00 | 197 × 63 | 3.1 × 1.0 | 0.36 (0.05) | 0.65 (0.09) |
| 39.47+55.4 | 48.26 | 41.91 | 251 × 53 | 3.9 × 0.8 | 0.29 (0.07) | 0.56 (0.13) |
| 39.64+53.3 | 48.40 | 39.82 | 177 × 93 | 2.7 × 1.4 | 0.27 (0.03) | 0.41 (0.05) |
| 40.32+55.2 | 49.06 | 41.53 | 81(7) × 50(5) | 1.3 × 0.8 | 0.79 (0.06) | 0.95 (0.11) |
| 40.61+56.3 | 49.37 | 42.44 | 250 | 3.9 | 0.39 (0.06) | 0.64 (0.09) |
| 40.68+55.1 | 49.42 | 41.43 | 182 | 2.8 | 6.48 (0.06) | 11.33 (0.17) |
| 41.30+59.6 | 50.05 | 45.92 | 65 | 1.0 | 3.39 (0.06) | 3.64 (0.11) |
| 41.95+57.5 | 50.69 | 43.76 | 28.5(0.1) × 21.7(0.1) | 0.4 × 0.3 | 36.19 (0.08) | 38.25 (0.21) |
| 42.66+51.6 | 51.39 | 47.80 | 207 | 3.2 | 0.93 (0.04) | 1.83 (0.08) |
| 42.67+55.6 | 51.39 | 41.80 | 99 | 1.5 | 0.73 (0.05) | 0.97 (0.09) |
| 42.67+56.3 | 51.40 | 42.63 | 132(13) × 61(7) | 2.0 × 0.9 | 0.92 (0.04) | 1.08 (0.07) |
| 42.80+61.2 | 51.55 | 47.54 | 71 × 40 | 1.1 × 0.6 | 0.87 (0.05) | 0.90 (0.06) |
| 43.18+58.2 | 51.91 | 44.57 | 107 | 1.7 | 6.90 (0.07) | 8.39 (0.14) |
| 43.31+59.2 | 52.03 | 45.42 | 53.6(0.3) × 44.1(0.2) | 0.8 × 0.7 | 22.66 (0.16) | 23.55 (0.35) |
| 43.72+62.0 | 52.45 | 48.80 | 208 × 56 | 3.2 × 0.9 | 1.08 (0.05) | 1.65 (0.09) |
| 44.01+59.6 | 52.73 | 45.78 | 56.7(0.6) × 46.6(0.5) | 0.9 × 0.7 | 11.43 (0.06) | 12.32 (0.12) |
| 44.28+59.3 | 52.99 | 45.49 | 156 | 2.4 | 2.12 (0.05) | 2.84 (0.09) |
| 44.34+57.8 | 53.05 | 43.94 | 118(13) × 51(6) | 1.8 × 0.8 | 0.65 (0.06) | 0.66 (0.10) |
| 44.40+61.8 | 53.15 | 48.04 | 235 | 3.6 | 1.14 (0.06) | 2.25 (0.13) |
| 44.51+58.2 | 53.23 | 44.36 | 234 | 3.6 | 0.95 (0.05) | 1.53 (0.10) |
| 44.89+61.2 | 53.61 | 47.36 | 223 × 54 | 3.5 × 0.8 | 1.24 (0.05) | 1.97 (0.11) |
| 45.17+61.2 | 53.88 | 47.43 | 74 × 56 | 1.1 × 0.9 | 14.23 (0.07) | 17.60 (0.16) |
| 45.24+65.2 | 53.96 | 51.29 | 223 | 3.4 | 1.31 (0.06) | 1.59 (0.10) |
| 45.39+60.3 | 54.07 | 46.50 | 172 × 49 | 2.7 × 0.8 | 0.88 (0.06) | 1.73 (0.13) |
| 45.42+64.7 | 54.13 | 53.58 | 201 | 3.1 | 1.24 (0.05) | 1.54 (0.09) |
| 45.48+64.7 | 54.22 | 50.94 | 116 × 55 | 1.8 × 0.9 | 0.92 (0.06) | 1.04 (0.08) |
| 45.75+65.3 | 54.46 | 51.43 | 222(10) | 3.4 | 2.30 (0.08) | 3.35 (0.16) |
| 45.79+64.0 | 54.50 | 50.20 | 100(13) × 47(8) | 1.6 × 0.7 | 0.27 (0.03) | 0.31 (0.05) |
| 45.88+69.7 | 54.60 | 55.75 | 405 × 183 | 6.3 × 2.8 | 0.57 (0.07) | 1.08 (0.14) |
| 45.89+63.9 | 54.60 | 49.98 | 118 × 30 | 1.8 × 0.5 | 2.12 (0.01) | 2.37 (0.01) |
| 46.52+63.9 | 55.22 | 50.01 | 172 × 139 | 2.7 × 2.2 | 2.00 (0.05) | 2.60 (0.09) |
| 46.56+73.8 | 55.26 | 59.91 | 135 × 47 | 2.1 × 0.7 | 1.26 (0.07) | 1.40 (0.12) |
| 46.70+67.1 | 55.41 | 53.17 | 260 | 4.0 | 1.22 (0.06) | 2.18 (0.14) |
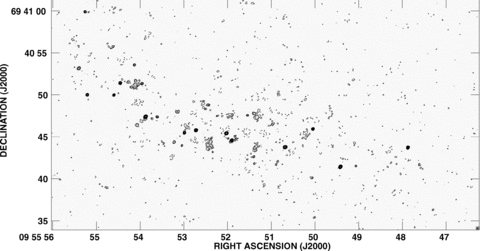
A MERLIN 1.7 GHz contour image of M82 from the observations presented here, restored with a 130 mas beam, which is plotted in the bottom right-hand corner. The contours are plotted at −1, 1, 2, 4, 6, 8, 10, 12, 14, 16, 18, 20, 25, 30, 35, 40 × 250 μ Jy beam−1.
The global VLBI (not including MERLIN) data sets were imaged using imagr, applying an appropriate taper, to produce 512 × 512 images, centred on 41.95+57.5, 43.18+58.3, 43.31+59.2, 44.01+59.6 and 45.17+61.2, restored with a 15 mas circular beam. This enabled effective comparison with the original EVN data set images with a matched angular resolution. Images were also produced using only the global VLBI epochs, with a cellsize of 1 mas and a robustness weighting of 0 at suitable resolutions for each source. The source 41.95+57.5 was imaged using a circular 3.3 mas beam and 43.31+59.2 was imaged with a circular beamsize of 4 mas. The remaining three sources (43.18+58.3, 44.01+59.6 and 45.17+61.2) were imaged using resolutions of 8 and 10 mas.
3 SOURCE STRUCTURES AT 1.7 GHz
Contour and grey-scale images of the individual sources made from the combined MERLIN+global VLBI data are presented in Fig. 3. Several shell or partial-shell structures can be clearly identified. The global VLBI and EVN images of the most compact sources can be found in Section 4, where the sources are discussed individually.
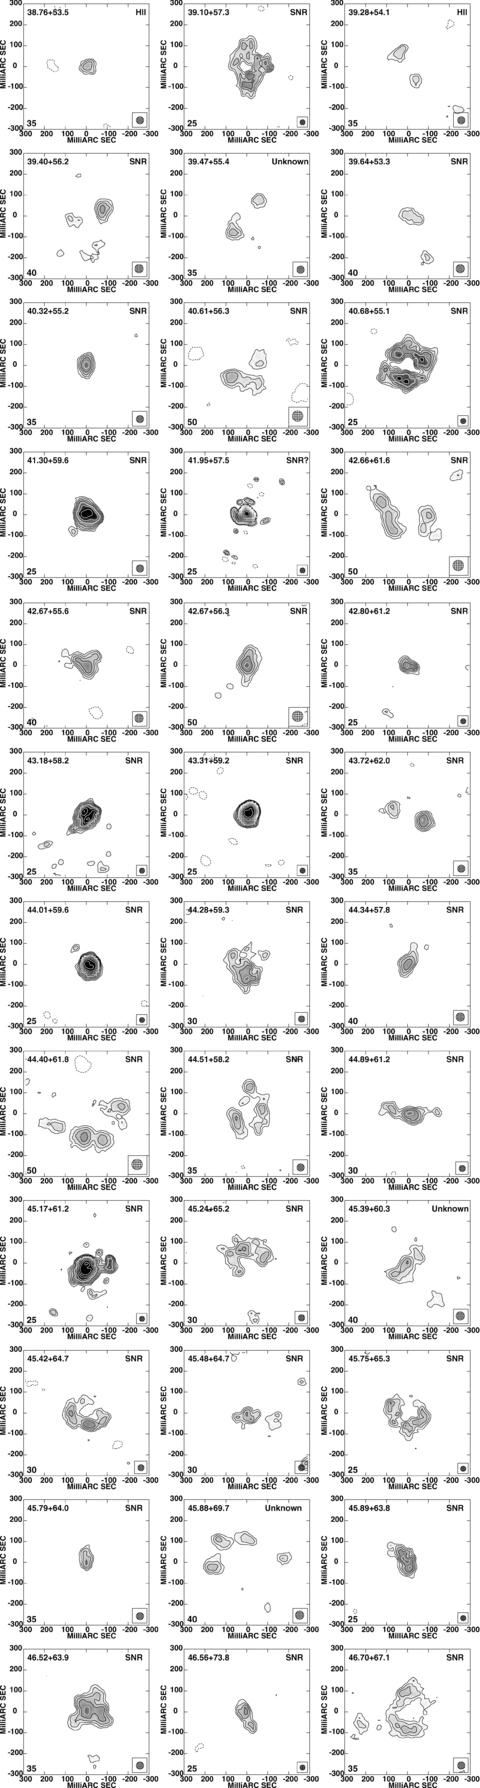
Grey-scale and contour images of the individual sources produced from the combined MERLIN+global VLBI data. The grey-scale ranges from 130 to 600 μJy beam−1 and the contours are plotted at −1, 1, 1.414, 2, 2.828, 4, 5.656, 8, 11.282 × 3 σ noise level (see Table 3). The beam size is listed numerically in units of milliarcseconds in the bottom left-hand corner and graphically in the bottom right-hand corner of each image. The source 41.95+57.5 has a grey-scale ranging from 200 to 800 μJy beam−1 and contour levels plotted at multiples of 0.2 mJy bm−1.
Sources have been included with peak flux density of ≥5σ in both the MERLIN only image and the combined 50 mas resolution images, which corresponds to ≥275 μJy beam−1 and ≥150 μJy beam−1, respectively, providing a sample of 36 sources.
The source sizes have been measured in accordance with the observed source structure. The single peaked sources have been measured using Gaussian fitting to find the full width at half maximum. The obvious shell-structured sources with a peak flux density (in the combined images) of >300 μJy beam−1 have been measured using radial profiles averaged in azimuth and measured to 50 per cent of the peak. The weaker, more extended sources (peak flux density >250 μJy beam−1) have been measured using the flux density profiles produced by drawing slices across the source. The values quoted are average diameters or a major-by-minor axis, wherever appropriate. An example of the measured sizes of two sources using all of the described methods is shown in Table 4. This illustrates that the methods used provide approximately equivalent measures of the source size, whilst utilizing the most appropriate procedures for a given source structure.
An example of two sources whose diameters have been measured using all methods for comparison. The errors, included in parentheses, represent those quoted from the fitting procedure, and those estimated from the measurements of the radial profile.
| Source | Resolution (mas) | Deconvolved diameter (mas) | ||
| Gaussian fit (average) | Radial profile | Flux density slices | ||
| 44.01+59.6 | 50 | 50.8(0.3) | 47(2) | 50 |
| 41.30+59.6 | 50 | 78(2) | 77(2) | 75 |
| Source | Resolution (mas) | Deconvolved diameter (mas) | ||
| Gaussian fit (average) | Radial profile | Flux density slices | ||
| 44.01+59.6 | 50 | 50.8(0.3) | 47(2) | 50 |
| 41.30+59.6 | 50 | 78(2) | 77(2) | 75 |
The contour images in Fig. 3 are centred on the Right Ascension and Declination position listed in Table 5 as measured from the combined data. The flux density measurements and the deconvolved sizes for each source are also presented in this table. The integrated flux density was measured over an area matching the 3σ size of the source in the MERLIN only image and a suitable subtraction made to account for the background emission in the vicinity of the source.
3.1 The source population
A total of 36 sources have been detected in these combined observations, 31 of which are previously identified SNRs with diameters ranging from 0.4 to 4.0 pc and a mean size of 2.1 pc (identifications taken from catalogues in Wills et al. 1997; Allen 1999; McDonald et al. 2002; Rodriguez-Rico et al. 2004). The remaining five sources consist of two H ii regions and three as yet unidentified sources. The two detected H ii regions are 38.76+53.5 and 39.28+54.1, originally identified by McDonald et al. (2002) with brightness temperatures ∼1100 K. These are shown in the histogram of source sizes in Fig. 4. The distribution of the spectral index of the known SNR and Hii regions within M82 as a function of brightness temperature was studied by McDonald et al. (2002), who showed the distribution to be distinctly bi-modal and hence the study of the spectra can be used as an indication of the nature of the source. The unknown sources from this data set are currently lacking sufficient spectral information to distinguish them fully as either H ii regions or SNR. The source 45.39+60.3 does have a three-point spectral energy distribution (SED) published in Allen (1999) suggesting that it has a flat spectrum and is therefore an H ii region, though the brightness temperature measured here (∼5 × 10⁴ K) is larger than expected for an H ii region and thus there classification remains ambiguous. Allen (1999) also detected the source 39.47+55.4 at 3.6 and 6 cm, which combined with the flux density of 0.56 ± 0.13 mJy presented here would suggest a flat spectrum for this source. The flux density and size measured imply a brightness temperature of ∼104 K, consistent with that of an H ii region. The remaining unknown source is detected for the first time in these observations and shows what could be interpreted as knots of radio emission within a shell structure, making it a strong SNR candidate. This is a faint source with a large (∼5 pc) diameter and a steep spectrum expected of a SNR would make it difficult to detect in higher frequency observations, providing a possible explanation for its prior non-detection.
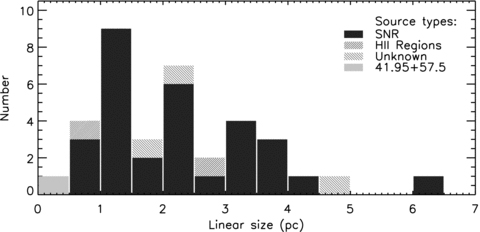
A histogram showing the observed diameters of the SNR, H ii regions and the unknown sources at 1.7 GHz.
4 THE COMPACT SOURCES
The more compact sources within M82 will now be discussed in view of their observed properties at milliarcsec resolutions using the global VLBI and previous EVN observations
4.1 41.95+57.5
This source is the most compact and, until recently, the brightest source within M82. It was first discovered in 1968 (Bash 1968). The EVN observations from 1986 and 1997 do not completely resolve the elongated structure of this source and its unusual morphology is only clearly seen in the higher resolution global VLBI epochs. This source is somewhat atypical and does not possess the shell morphology seen in other SNRs, showing a distinctly double-lobed structure. In addition, it has a measured expansion velocity of 1500 ± 400 km s−1 (Beswick et al. 2006), lower than typically expected for a SNR. It is possible that combined with the large and persistent flux density decay of ∼8.5 per cent yr−1, this source may represent the remnant of a gamma-ray burst (Muxlow et al. 2005; Fenech 2007). The full discussion of the nature of this source is deferred to a later paper.
4.2 43.18+58.3
This source, along with 44.01+59.6 and 45.17+61.2, was only marginally detected in the first epoch of EVN observations and by 1997 showed three weak peaks of emission in 15 mas resolution images (Pedlar et al. 1999). There has been no subsequent detection of this SNR in these very high resolution studies. However, this source can be clearly seen in the combined 1.7 GHz observations (see Fig. 3), which reveals a distinct shell-like structure with three peaks of emission and a radius of ∼53 mas. Comparison of two epochs of MERLIN 5 GHz observations has shown this source to be expanding at 10 500 ± 3000 km s−1 (Fenech et al. 2008).
4.3 43.31+59.2
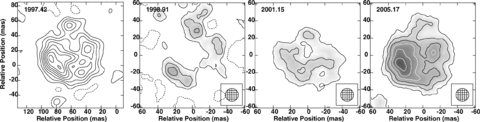
This SNR was first observed in images of M82 in 1972 (Kronberg & Wilkinson 1975), though has remained unresolved in MERLIN and VLA studies of the galaxy. However, the EVN and global VLBI observations discussed here completely resolve this source, showing a well-defined, almost complete shell structure (see Fig. 5). This source is an excellent example of a shell-like SNR and provides an ideal opportunity to study the evolution of a relatively young, rapidly evolving remnant. This will be discussed in detail in the following section.
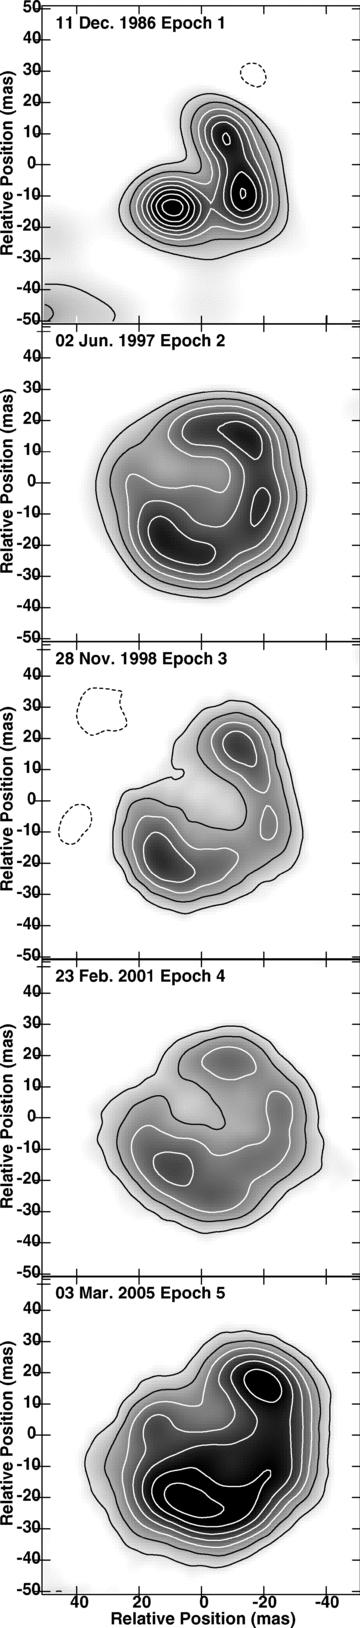
Contour and grey-scale images of the SNR 43.31+59.2 from all five epochs of 1.4 GHz (first epoch only) and 1.7 GHz observations. Each image is restored with a 15 mas beam. Contours are plotted at −1, 1, 2, 3, 4, 5, 6, 7, 8, 9, 10 × 0.35 mJy beam−1 for the EVN observations and ×0.2 mJy beam−1. The grey-scale is linear ranging from 0.1 to 2.2 mJy beam−1 for the EVN epochs and from 0.1 to 1.2 mJy beam−1 for the global VLBI epochs.
4.3.1 The expansion of 43.31+59.2
In order to determine the size and therefore expansion of 43.31+59.2, the aips task iring was used to measure radial profiles (averaged in azimuth) of the source at each of the five epochs using the 15 mas resolution images. The centre of the source was determined as the point equidistant from the positions of the peaks of radio emission in each image, which were measured using Gaussian fitting. Radial profiles were then measured from each pixel in 1 mas separations, in a 9 × 9 grid centred on this point. As discussed in detail in Beswick et al. (2006), this process was performed in order to assess the robustness of the use of the radial profiles to measure the shell radius when offset from the centre. The radial flux density profiles produced from the annuli at the central point are shown in Fig. 6 and the sizes measured from the peak and 50 per cent of the peak, in each case, are listed in Table 6. This process was also performed using the higher resolution 4 mas images for only the global VLBI epochs, shown in Fig. 7. The errors listed in Table 6 represent the 1σ deviation of the sizes as measured from all of the radial profiles in the grid. As can be seen in Table 6, measured values of the radius-at-peak of these profiles is systematically slightly larger when measured from the 4 mas resolution image than the 15 mas image. This effect results from the smoothing of the data and hence the increased contribution of fainter more diffuse emission filling the SNR shell (see fig. 7 of Beswick et al. 2006). This effect is minimized if the size at 50 per cent of the peak is used. It should be noted that this has no systematic effect on the expansion velocities found using similarly derived size measurements between epochs. The evolution of the small-scale structure visible at full global VLBI resolutions makes identifying common knots of radio emission between epochs difficult. As a consequence, it has not been possible to perform Gaussian fitting to the four knots of radio emission initially identified by McDonald et al. (2001) to follow their expansion.
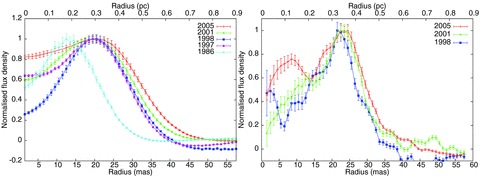
Azimuthally averaged radial profiles of 43.31+59.2 at all epochs from 15 mas resolution images as well as from the global VLBI epochs at 4 mas resolution. The error bars are 1σ errors on the measured flux density around the annulus at a specific radius as derived by iring for each 1 mas increment in radius. It should be noted that these points are not independent as their separation is less than the beamsize.
Measured radii of the SNR 43.31+59.2 from the 15 and 4 mas resolution images, derived using the integrated radial profiles shown in Fig. 6.
| Epoch | 4 mas resolution | 15 mas resolution | ||||
| Radius at peak | Radius at peak | Radius at 50% of peak | ||||
| (mas) | (pc) | (mas) | (pc) | (mas) | (pc) | |
| 1 | – | – | 13.2 ± 1.0 | 0.205 ± 0.016 | 22.0 ± 0.9 | 0.343 ± 0.014 |
| 2 | – | – | 19.2 ± 0.6 | 0.300 ± 0.009 | 29.5 ± 0.8 | 0.457 ± 0.012 |
| 3 | 21.5 ± 0.3 | 0.333 ± 0.005 | 19.5 ± 0.9 | 0.302 ± 0.014 | 30.1 ± 0.9 | 0.467 ± 0.014 |
| 4 | 22.5 ± 0.3 | 0.349 ± 0.005 | 20.0 ± 0.8 | 0.310 ± 0.012 | 31.4 ± 0.8 | 0.487 ± 0.012 |
| 5 | 24.5 ± 0.4 | 0.380 ± 0.006 | 20.8 ± 0.9 | 0.322 ± 0.014 | 33.5 ± 0.9 | 0.519 ± 0.014 |
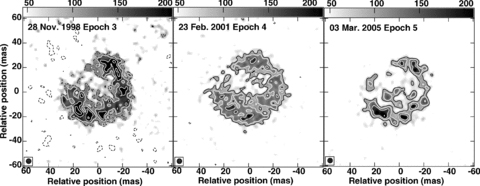
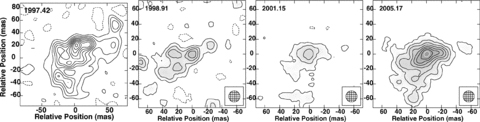
Contour and grey-scale images of the SNR 43.31+59.2 from the global VLBI epochs, restored with a 4 mas beam. The images have been contoured with multiples of −1, 1, 1.414, 2, 2.828, 4 and 5.657 × 0.1 mJy beam−1 for the 1998 epoch and × 0.08 mJy beam−1 for the other two epochs.
As can be seen in the contour images and from the information in Table 6, the radio shell of 43.31+59.2 visibly expands between the first and subsequent epochs. The azimuthally averaged radial profiles from the higher angular resolution (4 mas) images have increased in peak radius from 22.5 to 24.5 mas between 2001 and 2005, corresponding to an angular expansion rate of 0.50 ± 0.12 mas yr−1. This results in an expansion velocity of 7600 ± 1800 km s−1. Determining the expansion from the peak of the lower resolution (15 mas) radial profiles is more difficult but, using the measurements at 50 per cent of the peak, also shows a marginally significant expansion for the latest two epochs, consistent with measurements made on the higher (4 mas) resolution images. This is in good agreement with previous measurements from EVN (e.g. 9850 ± 1500 km s−1 from Pedlar et al. 1999) and global VLBI epochs, as well as the measurement from MERLIN 5 GHz observations (Fenech et al. 2008).
4.3.2 Possible deceleration

The size measurements for the SNR shell of 43.31+59.2 can be used to determine if it is still freely expanding or has begun to decelerate. Fig. 8 shows the sizes from Table 6 and a number of possible deceleration parameters fitted to the data. The SNR was first detected in observations of M82 made in 1972 (Kronberg & Wilkinson 1975), providing a lower limit to the age of this source. Incorporating this source age limit with the fit to the observed shell size provides a lower limit to the deceleration parameter of 0.53 ± 0.06. As can be seen from Fig. 8, it is still very difficult to distinguish between the possible values and hence whether the SNR has actually begun to decelerate. Therefore, assuming the source to be in free expansion gives an approximate birth date of ∼ 1952, giving an upper limit to the age of 53 yr in 2005.

The expansion of the source 43.31+59.2, showing the measured sizes from each epoch and the deceleration parameter fits to the data.
Although in agreement with previous measurements, the velocities calculated from the latest epochs are slightly lower than previously observed, and it is therefore necessary to investigate the possibility that the radio-shell has begun to decelerate. Fig. 9 shows the expansion velocities measured from the iring profiles between 1986 and each subsequent epoch at 15 mas resolution. The velocities measured between each epoch at 4 mas are also shown. The shaded region represents the expected trend of the velocity from a radio shell determined by the deceleration parameter calculated from the size measurements (including errors). Though inconclusive at this stage, this plot does suggest that the SNR may be decelerating.
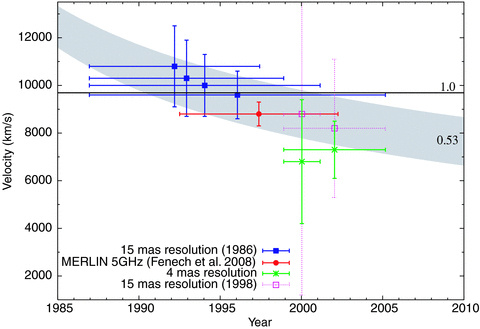
Expansion velocities for the SNR 43.31+59.2. The vertical bar shows the error on the velocity measurement and the horizontal bar represents the time range between the size measurements used. Velocities from all available epochs have been included as well as the measurement from MERLIN 5 GHz observations (Fenech et al. 2008). The shaded region represents the trend in velocity determined by a deceleration parameter of 0.53 ± 0.06. Velocities from 15 mas measurements between 1986 and each subsequent epoch have been plotted. The 15 mas equivalent velocities to those from the 4 mas sizes have also been included for direct comparison, these are from measurements between 1998 and each subsequent epoch.
4.4 44.01+59.6
This source was detected in the second epoch of EVN observations from 1997, and further investigated in 1998 and 2001; however the latter detections were close to the noise level and could not be used to perform a reliable test for any expansion between the epochs of observations. Fig. 10 shows the source 44.01+59.6 from the 1997 EVN observations (Pedlar et al. 1999) and the subsequent global VLBI observations in 1998, 2001 and 2005. The latest global VLBI image in particular shows very similar structure to the EVN image from 1997 and should now be able to be used to investigate any expansion between these two epochs. A relatively low expansion velocity of 2700 ± 650 km s−1 was measured for this source using MERLIN 5 GHz observations. The only lower measured velocity for an SNR in M82 is that of the peculiar source 41.95+57.5. These and future global VLBI studies of this source will enable a more detailed analysis.
Contour and grey-scale images of the source 44.01+59.6 from the three global VLBI epochs, restored with a 15 mas beam. Contours are plotted at −1, 1, 2, 3, 4, 5, 6, 7, 8, 9, 10 × 0.1 mJy beam−1.
4.5 45.17+61.2
This source has a more complex structure (see Fig. 11) than an obvious shell-like morphology of, for example, the SNR 43.31+59.2 (see Fig. 5). The elongation of this source has led to its identification as a possible partial shell of a larger SNR, and assuming this to be the case, monitoring of the position of the peak of emission at 5 GHz has led to an expansion velocity of ∼6000 km s−1 (Fenech et al. 2008). The use of self-calibration in the data reduction degrades the absolute astrometry making the calculation of the expansion in this way using the global VLBI data difficult. However, these EVN/global VLBI observations allow a more detailed study of the internal structure of this source, which has clearly evolved between 1997 and 2005, though its overall morphology is still consistent with a partial shell interpretation.
Grey-scale and contour image of 45.17+65.3 from the EVN (1997) and global VLBI epochs, restored with a 15 mas beam.
5 THE PROPERTIES OF THE ISM IN M82
5.1 Ionized gas
SNR characteristically exhibit a steep spectrum following the power law S∝να, where α is the spectral index. Hence, the SNR previously observed at 5 GHz (Muxlow et al. 1994; McDonald et al. 2002; Fenech et al. 2008) (and those below the detection threshold) are expected to be brighter at 1.7 GHz. See Table 7 for a comparison of sources detected in these observations and those presented in Fenech et al. (2008) at 5 GHz. However, not all of the known SNR detected at higher frequencies at similar resolutions have been observed in these data. As the noise levels of the images presented here are greater than for some of the previously published data at higher frequencies, there is an inherent selection effect towards the brighter sources, hence fewer of the fainter SNR and H ii regions are detected.
A comparison of the number of sources detected in these 1.7 GHz and the 5 GHz MERLIN observations presented in Fenech et al. (2008).
| Source | 1.7 GHz | 5 GHz |
| SNR | 31 | 37 |
| H ii regions | 2 | 13 |
| Unknown | 3 | 4 |
| Total | 36 | 55 |
| Shell structures | ∼20 | ∼28 |
| Source | 1.7 GHz | 5 GHz |
| SNR | 31 | 37 |
| H ii regions | 2 | 13 |
| Unknown | 3 | 4 |
| Total | 36 | 55 |
| Shell structures | ∼20 | ∼28 |
In addition to the known thermal H ii regions, extensive regions of molecular and ionized gas have been identified within the central kpc of M82 from the 92 GHz continuum studies by Carlstrom & Kronberg (1991), where the emission is dominated by free–free emission, as well as via radio recombination line (RRL) observations [e.g. the 1.7 and 5 GHz RRLs in Seaquist, Bell & Bignell (1985), as well as those presented by Rodriguez-Rico et al. (2004)]. Low-frequency observations of M82 (Noglik 1996; Wills et al. 1997) have shown the presence of significant free–free absorption by ionized gas. The most striking example of this is the large ‘hole’ observed at 408 and 327 MHz, roughly centred on the source 41.95+57.5 and approximately 100 pc in diameter. Wills et al. (1997) attribute this to free–free absorption from a large H ii region ionized by a cluster of early-type stars.
Analysis of the SEDs has been performed for a number of the sources within M82 such as those by Wills et al. (1997); McDonald et al. (2001); Allen & Kronberg (1998); Allen (1999) and Tsai et al. (2009). These are used to distinguish the flat spectrum H ii regions from the steep spectrum SNR. Such studies also include modelling of the free–free absorption seen for individual sources providing an estimate of the amount of ionized gas along the line of sight via the emission measure.
The spectrum of a number of sources shows low-frequency turnovers, in the case of SNR suggesting free–free absorption, indicating that some of the SNR are located either within or even behind the ionized gas. A total of nine of the known SNR within M82 show a turnover in their spectrum at frequencies greater than 1.7 GHz, eight of which have been detected in these observations and have reduced flux densities consistent with this picture. Whilst not detected in these observations, the SNR 43.81+62.8 has been detected at a number of frequencies and was suggested to have a turnover frequency of ∼2–3 GHz by Wills et al. (1997) via a spectral analysis incorporating observations from 0.408, 5 and 8.3 GHz (Wills et al. 1997; Kronberg et al. 1985; Huang et al. 1994). However, later observations reported in Allen (1999) at similar frequencies suggest the flux density of this source to have increased. In addition, MERLIN observations at 1.4 GHz in 1995 (Wills, Pedlar & Muxlow 1998) give a flux density of 2.1 ± 0.8 mJy, compared to an upper limit of 0.2 mJy beam−1 in these observations. It is therefore difficult to attribute the lack of detection of this SNR to free–free absorption alone, as it may well be a result of its apparent variability.
There are 20 previously identified H ii regions in M82, all but two of which have been shown to be or become optically thick above 1.7 GHz (see Wills et al. 1997; McDonald et al. 2001; Rodriguez-Rico et al. 2004). As a result, only two of the H ii regions expected to be in the optically thick regime have been detected in the combined 1.7 GHz observations, the remainder having predicted flux densities below the image noise level. The H ii regions 45.63+66.9 and 43.21+61.3 identified by Rodriguez-Rico et al. (2004) have a spectral index of ∼−0.04 between 8.3 and 43 GHz. The lack of detection here would suggest that these sources also become optically thick at a frequency greater than 1.7 GHz. The low-resolution image produced from the MERLIN-only data has a 1σ brightness temperature sensitivity limit of ∼1500 K. There is emission at the 2–3σ level in this MERLIN-only image for two of the H ii regions expected to be optically thick, though they are undetected in the MERLIN+global VLBI images. This would suggest that the low brightness temperature sensitivity of the combined data may also be a contributing factor to the lack of detection of some of the H ii regions.
5.2 Supernova remnants and the star formation rate in M82
It is possible to use these observations to make an independent estimate of the supernova and star formation rates in M82, enabling a comparative measurement to those performed elsewhere, both from radio and from other wavelength observations.
The simplest method of calculating the supernova rate using SNR in M82 is by comparison to the Galactic Remnant Cassiopeia A, which has a known age of ∼325 yr (age in 2004; Fesen et al. 2006). Assuming that the observed SNR in M82 which are more luminous than Cassiopeia A are therefore younger, the supernova rate can be calculated as the number of SNR divided by the age of Cassiopeia A. Taking a flux density for Cassiopeia A of 1894 Jy (extrapolated from the 1 GHz value using a spectral index of α=−0.77) from Green (2004) (observation date 1999), this provides 12 M82 SNR and a resulting supernova rate of νSN= 0.04 yr−1. This is lower than that measured from MERLIN 5 GHz observations (∼0.07 yr−1 from Fenech et al. 2008), though this is likely to be a result of free–free absorption causing low-frequency turnovers in the SNR spectrum (see Section 5.1).
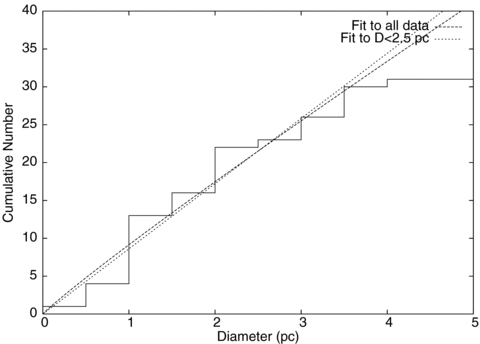
The cumulative distribution of SNR at 1.7 GHz in M82 as a function of diameter, showing the linear and power-law fits to the data for D<2.5 pc.
Assuming a Miller–Scalo (Miller & Scalo 1979) initial-mass function (represented by a power law with a constant slope given by −2.3), these supernova rates can be used to estimate the star formation rate for M82, giving SFR (M≥ M⊙) ∼ 1.25–2.25 M⊙ yr−1. This is in good agreement with the ∼2 M⊙ yr−1 measurements at other radio wavelengths as well as using FIR, UV and Hα (e.g. Young et al. 1996; Bell & Kennicutt 2001).
5.3 The SNR environment
The ISM within M82 is believed to be more extreme than in the Milky Way, with pressures of 107 cm−3 K observed within the central star-forming region (Smith et al. 2006). Theoretical studies of M82, such as those of Chevalier & Fransson (2001), assume such ISM pressures, along with densities of ∼103 cm−3 to predict expansion velocities for the observed SNR of ∼500 km s−1, which is in stark contrast to those observed, in particular for the SNR 43.31+58.2 (Muxlow et al. 2005; Beswick et al. 2006; Fenech et al. 2008, this paper).
If the SNR are assumed to be situated within the ionized gas with temperatures of ∼104 K, ambient gas densities of ∼103 cm−3 are required to provide the level of pressure observed. Chevalier & Fransson (2001) alternatively assume that the majority of SNR are evolving into the interclump medium of molecular clouds, citing the association of strong CO emission with the observed radio emission as a good indication of this. However, Weiß et al. (2001) conclude that most of the CO emission from the central regions of M82 arises from a warm, low-density interclump medium with kinetic temperatures of ∼150 K and densities ∼103 cm−3 in agreement with previous studies such as Mao et al. (2000). More recent investigations using formaldehyde line transitions to independently constrain the properties of the dense molecular gas (e.g. Mühle, Seaquist & Henkel 2007, 2009) find kinetic gas temperatures of ∼200 K and densities of ∼7 × 103 cm−3 in strong agreement with the CO studies. Such temperatures and gas densities imply pressures of ∼105–106 cm−3 K, between one and two orders of magnitude lower than those assumed by Chevalier & Fransson (2001).
Following the free expansion phase, a SNR is expected to enter the Sedov phase of its evolution when the mass of swept-up material becomes equivalent to the mass of the ejecta. For an SNR, this is expected to occur whilst interacting with a constant-density ISM, at a radius rs≃ 4.1 × (Mej/n0)1/3 pc, where Mej is the ejecta mass in units of 10 M⊙ and n0 is the ISM density in cm−3. In the case of 43.31+59.2, this stage of evolution has not yet been reached (as shown in Section 4.3.1), hence an upper limit to the surrounding density can be set of ≤250 cm−3, for an ejecta mass of 5 M⊙. This would suggest that for the required pressures, 43.31+59.2 is not likely to be situated within the ionized gas, a conclusion supported by the lack of low-frequency turnover observed in its spectra (Wills et al. 1997; Tsai et al. 2009).
5.3.1 A wind-blown bubble?
It has previously been suggested that the low-density environment that 43.31+59.2 appears to be experiencing may be a result of a wind-blown bubble from the mass loss of the progenitor star (Beswick et al. 2006).
The SNR in M82 are expected to be the result of core-collapse supernova events of massive progenitors (typically >8 M⊙). Most stars with masses >11 M⊙ will become red supergiants (RSG) in their final stages of evolution and are believed to be the progenitors of the majority of core-collapse supernovae. Such stars (typically OB stars) undergo mass-loss during their main-sequence phase with expected terminal velocities of ≲3000 km s−1 and rates of 10−6 to 10−5 (e.g. Vink, de Koter & Lamers 2000; Müller & Vink 2008). The subsequent mass-loss during the RSG phase is expected to be slower and more dense, with typical mass-loss rates of ∼10−5 to 10−4 M⊙ yr−1 and wind velocities of <100 km s−1 (e.g. Schaller et al. 1992; Dwarkadas 2005). Hence prior to the eventual supernova explosion, there will be a complex circumstellar environment consisting of stellar-wind material from various evolutionary stages as well as potentially a collapsed H ii region.
Modelling of the pre-supernova circumstellar environment for RSGs indicates that there will be a region of RSG wind close to the progenitor with a density profile given by  , reaching distances of a few parsec (van Marle, Langer & García-Segura 2004; Dwarkadas 2005; Perez-Rendon, Garcia-Segura & Langer 2009). This will be followed by a lower, roughly constant density region, created by the fast main-sequence wind driving a shocked shell into the surrounding medium. This is the wind-blown bubble and reaches distances of a few tens of parsec from the progenitor star (see e.g. van Marle et al. 2004, 2006; Dwarkadas 2005; Perez-Rendon et al. 2009, and references therein).
Given the sizes of the respective regions and the measured radius of <1 pc for 43.31+59.2, this would imply that this source would still be expanding into the remaining RSG wind. However, the density gradient would produce a variable flux density, which is not observed. Kronberg et al. (2000) showed the flux density of 43.31+59.2 and 23 other SNR to be stable over a 10-yr period.
The majority of these models assume an interstellar environment more typical of the Galaxy than for a starburst such as M82 and it is therefore possible that the increased pressures found in M82 will have a stronger effect on the development of any wind-blown bubble surrounding the progenitor star (e.g. van Marle et al. 2006). The most likely outcome of which would be a reduced propagation of the various stages of mass-loss into any surrounding H ii region and the ISM. Hence, it is possible that for the case of 43.31+59.2, the expanding remnant has already entered the lower-density environment of a wind-blown bubble, from which it is yet to emerge.
The ISM within M82 is clearly very complex and whilst this possibility may be argued for a number of other SNR, it may well be a scenario that will not fit all. For example, 44.01+59.6 is comparable in size to 43.31+59.2, though has a measured expansion velocity significantly lower, at ∼2700 km s−1 (Fenech et al. 2008), suggesting it is experiencing a higher density environment. A similar point can be made for 41.95+57.5, if it is assumed that it does in fact represent a comparable SNR scenario.
Conversely, sources such as 43.18+58.2 have been shown to be expanding at ∼10 500 km s−1. This is close to that of the newly discovered radio supernova SN2008iz, which has an average expansion over the first year of ∼11 000 km s−1 (assuming a distance to M82 of 3.6 Mpc) (Brunthaler et al. 2009a,b). This would imply 43.18+58.2 may still be in free-expansion at a size of ∼2 pc, even though its spectra show a low-frequency turnover, suggesting it could be situated within or behind the dense ionized gas. However, Brunthaler et al. (2010) more recently suggest that the expansion velocity of SN2008iz is closer to ∼23000 km s−1
6 CONCLUSIONS
The relatively young SNR in M82, such as 43.31+59.2, are believed to have ages measured in decades, situating them between the young radio supernovae such as SN 1979c, and the more evolved SNR within our own Galaxy (e.g. Cass A) which are a few hundred years old. Hence, detailed studies of the SNR in M82 are vital to our understanding of the evolution of SNR in general and, in particular, to their early stages of development. The latest global VLBI observations of M82 presented here have been used to monitor the expansion of the young SNR 43.31+59.2 over a 19-yr timeline and show the detailed structure of the sources 44.01+59.6 and 45.17+61.2 and 41.95+57.5.
The expansion velocity of the SNR 43.31+59.2 measured between 2001 and 2005 is 7600 ± 1800 km s−1. This confirms the high expansion velocity of this SNR measured using previous epochs by Pedlar et al. (1999), McDonald et al. (2001) and Beswick et al. (2006).
Size measurements at each epoch have been used to study the possible deceleration of 43.31+59.2. Including the 1972 observation of Kronberg & Wilkinson (1975), a lower limit to the deceleration parameter of 0.53 ± 0.06 can be fitted to these measurements.
The SNR 44.01+59.6 has been imaged at each of the global VLBI epochs at 15 mas resolution. The latest epoch shows a very similar structure to that originally observed by Pedlar et al. (1999) in 1997.
The structure of the source 45.17+61.2 has been revealed using the global VLBI 2005 observations confirming its elongated structure.
In addition, the first combined 1.7 GHz global VLBI and MERLIN observations of M82 have provided detailed images of the individual sources within M82 at this frequency. This has shown many of the SNR to have clear shell or partial shell structures.
A total of 32 SNR have been detected in these observations with sizes ranging from 0.4 to 4.0 pc, with a mean diameter of 2.1 pc as well as two of the known H ii regions.
A possible previously unknown SNR (45.88+69.7) has been detected, with a potential ring-like structure and diameter of ∼5 pc.
The supernova rate has been estimated from these combined observations using several methods which result in measurements of νSN∼ 0.04–0.09. Use of these supernova rates to calculate the SFR for M82 gives values of SFR (M≥ 5 M⊙) ∼ 1.25–2.25 M⊙ yr−1 in agreement with measurements from other wavelengths.
MERLIN is a national facility operated by The University of Manchester on behalf of the Science and Technology Facilities Council (STFC). The VLBA is operated by the National Radio Astronomy Observatory which is a facility of the National Science Foundation operated under cooperative agreement by Associated Universities Inc. The EVN is a joint facility of the European, Chinese, South African and other radio astronomy institutes funded by their national research councils. parseltongue was developed in the context of the ALBUS project, which has benefited from research funding from the European Community's sixth Framework Programme under RadioNet R113CT 2003 5058187. We would like to thank the anonymous referee for the many helpful comments and suggestions that have helped improve this paper.
REFERENCES
