


Abstract
We present the first in a series of papers discussing the thermodynamic properties of M87 and the central regions of the Virgo Cluster in unprecedented detail. Using a deep Chandra exposure (574 ks), we present high-resolution thermodynamic maps created from the spectra of ∼16 000 independent regions, each with ∼1000 net counts. The excellent spatial resolution of the thermodynamic maps reveals the dramatic and complex temperature, pressure, entropy and metallicity structure of the system. The ‘X-ray arms’, driven outwards from M87 by the central active galactic nuclei (AGN), are prominent in the brightness, temperature and entropy maps. Excluding the ‘X-ray arms’, the diffuse cluster gas at a given radius is strikingly isothermal. This suggests either that the ambient cluster gas, beyond the arms, remains relatively undisturbed by AGN uplift or that conduction in the intracluster medium (ICM) is efficient along azimuthal directions, as expected under action of the heat-flux-driven buoyancy instability (HBI). We confirm the presence of a thick (∼40 arcsec or ∼3 kpc) ring of high-pressure gas at a radius of ∼180 arcsec (∼14 kpc) from the central AGN. We verify that this feature is associated with a classical shock front, with an average Mach number M= 1.25. Another, younger shock-like feature is observed at a radius of ∼40 arcsec (∼3 kpc) surrounding the central AGN, with an estimated Mach number M≳ 1.2. As shown previously, if repeated shocks occur every ∼10 Myr, as suggested by these observations, then AGN-driven weak shocks could produce enough energy to offset radiative cooling of the ICM. A high significance enhancement of Fe abundance is observed at radii 350–400 arcsec (27–31 kpc). This ridge is likely formed in the wake of the rising bubbles filled with radio-emitting plasma that drag cool, metal-rich gas out of the central galaxy. We estimate that at least ∼1.0 × 10⁶ solar masses of Fe has been lifted and deposited at a radius of 350–400 arcsec; approximately the same mass of Fe is measured in the X-ray bright arms, suggesting that a single generation of buoyant radio bubbles may be responsible for the observed Fe excess at 350–400 arcsec.
1 INTRODUCTION
The Virgo Cluster is the second brightest, extragalactic, extended X-ray source in the 0.1–2.4 keV ROSAT band, and the closest galaxy cluster (16.1 Mpc; Tonry et al. 2001). The central galaxy of the Virgo Cluster, M87, hosts an active galactic nucleus (AGN) that exhibits compelling evidence for complex interactions with the surrounding cluster gas (e.g. Böhringer et al. 1995; Young, Wilson & Mundell 2002; Forman et al. 2005, 2007). M87 is, therefore, an excellent object with which to study AGN-driven processes (i.e. AGN feedback) that affect the centres of galaxies and galaxy clusters.
The relatively cool, dense gas at the centres of many galaxy clusters emits copiously at X-ray wavelengths. In the absence of a significant heat source, this gas would be expected to cool quickly and promote significant star formation, at rates an order of magnitude larger than observed (see Peterson & Fabian 2006 for a review). The energy required to offset this cooling is widely believed to come predominantly from the central AGN, though the exact process or processes by which this occurs remains unclear (see e.g. McNamara & Nulsen 2007). AGN inflate bubbles of relativistic radio plasma, which displace the X-ray emitting gas, forming clear cavities. This process is expected to provide a significant source of heating and turbulence (Churazov et al. 2001; see also e.g. Brüggen & Kaiser 2002; Kaiser 2003; Brüggen 2003; De Young 2003; Ruszkowski, Brüggen & Begelman 2004a,b; Heinz & Churazov 2005). Sound waves and internal waves generated by cavity inflation also provide a mechanism to heat the intracluster medium (ICM). These waves have been observed in both the Perseus and Centaurus clusters (e.g. Fabian et al. 2003, 2006; Sanders & Fabian 2007, 2008). AGN-induced shock activity is a further promising avenue to heat the ICM. Clear indications of AGN-induced shocks are seen in several nearby galaxies and clusters; the best examples being Hydra A, Virgo and Perseus clusters (e.g. Fabian et al. 2003, 2006; Nulsen et al. 2005a; Forman et al. 2005, 2007; Simionescu et al. 2009). AGN-induced shocks in clusters are typically weak; Hercules A hosts the strongest observed AGN-driven shock in a cluster with a Mach number M∼ 1.65 (Nulsen et al. 2005b). These outbursts can also be very energetic; MS 0735+7421 boasts the highest observed energy with ∼6 × 1061 erg associated with its shock (Gitti et al. 2007). In galaxies and galaxy groups, these shocks can be much stronger with Mach numbers as high as M∼ 8 as observed in Centaurus A (Kraft et al. 2003; Croston et al. 2009). In M87, Forman et al. (2005) identified shock fronts associated with an AGN outburst ∼1–2 × 10⁷ years ago. They argued that shocks may be the most significant mechanism of heating the cool ICM near the core by the AGN. Forman et al. (2007) also measure temperature and density jumps that are consistent with a weak shock with Mach number M∼ 1.2. However, important uncertainties remain. For example, significant temperature jumps are not seen across all putative shock fronts (e.g. Graham, Fabian & Sanders 2008). Additionally, the observed pressure features are sometimes several kpc thick (Fabian et al. 2006), complicating our understanding of how these processes work.
In M87, two X-ray bright ‘arms’, discovered by Feigelson et al. (1987) using the Einstein Observatory, are the most striking features driven by the AGN activity. These arms extend to the southwest and east of the Galactic centre, are composed of cool gas and are spatially coincident with extended radio emission (Böhringer et al. 1995; Belsole et al. 2001; Molendi 2002). Böhringer et al. (1995; see also Churazov et al. 2001) propose that these structures are the result of gas uplift in the wakes of bubbles of radio plasma buoyantly rising in the hot ICM. However, the details of this process and the role of magnetic fields are largely not understood. Subsequent Chandra and XMM–Newton observations of M87 have revealed many additional complexities in the system (e.g. Belsole et al. 2001; Matsushita et al. 2002; Molendi 2002; Böhringer et al. 2002; Sakelliou et al. 2002; Young et al. 2002; Forman et al. 2005, 2007; Simionescu et al. 2007, 2008; Werner et al. 2006).
Here, we present the first in a series of papers studying in unprecedented detail the thermodynamic properties of M87. Using an ultra-deep (574 ks) observation, we fully utilize the excellent spatial resolution of the Chandra X-ray Observatory. This paper focuses on the overall thermodynamic structure and Fe distribution of the galaxy and surrounding cluster, and on the properties of the strongest shock features. Other papers study the detailed physics of the X-ray bright arms and inner post-shock regions (Werner et al. 2010, hereafter Paper II) and the history of chemical enrichment (Million et al., in preparation, hereafter Paper III).
The structure of this paper is as follows. Section 2 describes the data reduction, basic imaging analysis and spatially resolved spectroscopy. Section 3 presents detailed thermodynamic maps for the cluster. Section 4 presents results on the radial properties of the ambient ICM to the north and south of the AGN; this excludes the X-ray bright arms, which introduce strong multi-temperature structure into the profiles. We place important new constraints on the isothermality of the ambient cluster gas. Section 5 discusses the results, focusing on the shock features at radius r∼ 180 arcsec, the isothermality of the ambient cluster gas and a high significance metallicity bump at r∼ 5–6 arcmin. Section 6 summarizes our conclusions.
Throughout this paper, we assume that the cluster lies at a distance of 16.1 Mpc, for which the linear scale is 0.078 kpc per arcsec.
2 X-RAY OBSERVATIONS AND ANALYSIS
2.1 Data reduction
Our work builds upon previous analyses of the same data sets studied here (see Young et al. 2002; Forman et al. 2005, 2007). The Chandra observations were carried out using the Advanced CCD Imaging Spectrometer (ACIS) between 2002 July and 2005 November. The standard level 1 event lists produced by the Chandra pipeline processing were reprocessed using the ciao (version 3.5.0) software package, including the appropriate gain maps and updated calibration products. Bad pixels were removed and standard grade selections applied. Where possible, the extra information available in VFAINT mode was used to improve the rejection of cosmic ray events. The data were cleaned to remove periods of anomalously high background using the standard energy ranges recommended by the Chandra X-ray Center. The net exposure times after cleaning are summarized in Table 1 and total 574 ks. Separate photon-weighted response matrices and effective area files were constructed for each region analysed.
Summary of the Chandra observations of M87 used in this study. Columns list the observation ID, detector, observation mode, exposure after cleaning and observation date.
| Obs. ID | Obs. date | Detector | Mode | Exp. (ks) |
| 2707 | 2002 Jul. 6 | ACIS-S | FAINT | 82.9 |
| 3717 | 2002 Jul. 5 | ACIS-S | FAINT | 11.1 |
| 5826 | 2005 Mar. 3 | ACIS-I | VFAINT | 126.8 |
| 5827 | 2005 May 5 | ACIS-I | VFAINT | 156.2 |
| 5828 | 2005 Nov. 17 | ACIS-I | VFAINT | 33.0 |
| 6186 | 2005 Jan. 31 | ACIS-I | VFAINT | 51.5 |
| 7210 | 2005 Nov. 16 | ACIS-I | VFAINT | 30.7 |
| 7211 | 2005 Nov. 16 | ACIS-I | VFAINT | 16.6 |
| 7212 | 2005 Nov. 14 | ACIS-I | VFAINT | 65.2 |
2.2 Imaging analysis
Background-subtracted images on a 0.984 × 0.984 arcsec2 pixel scale were created for each pointing in many narrow energy bands (spanning 0.6–7.0 keV). These were flat-fielded with respect to the median energy for each image. Background images were created from the blank-sky fields available from the Chandra X-ray Center. The blank-sky fields were processed in an identical manner to the science observations and were reprojected on to the same coordinates using the aspect solution files. The background images were normalized by the ratio of the observed and blank-sky count rates in the 9.5–12 keV band. The images were summed to form a series of combined background-subtracted, exposure-corrected images. Fig. 1 shows the X-ray image in the 0.6–2.0 keV band divided by the best-fitting, double-β model1 and smoothed with a 2 arcsec filtered Gaussian. This image spans the entire region covered by ACIS-I observations taken in 2005. The white circle (r∼ 8.5 arcmin) denotes the outer extent of the data used for the spectral analysis reported here.
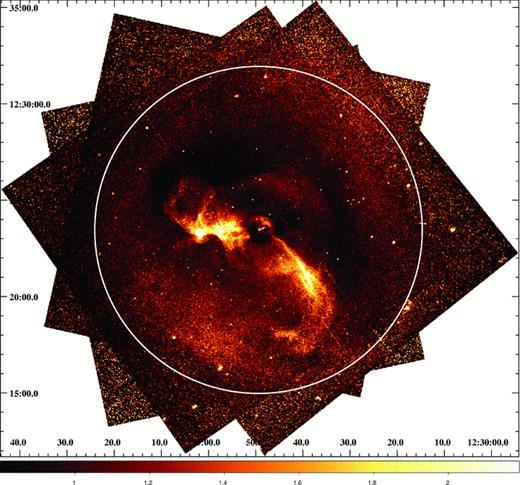
Exposure-corrected, flat-fielded, surface brightness image of the central regions of the Virgo Cluster divided by the best-fitting, radially symmetric double-β model in the 0.6–2.0 keV energy band and smoothed with a 2 arcsec Gaussian. Unity represents locations where the data are equal to the model. This image uses only the ACIS-I data taken in 2005. The white circle represents the outer extent of the thermodynamic maps presented in Figs 2–5 (radius 8.5 arcmin or ∼40 kpc).
The cool X-ray arms are readily apparent in the image. An extensive imaging analysis of these data is presented by Forman et al. (2007).
2.3 Spatially resolved spectroscopy
2.3.1 Contour binning
The individual regions for spectral fitting were determined using the contour binning method of Sanders (2006), which groups neighbouring pixels of similar surface brightness until a desired signal-to-noise ratio threshold is met. For data of the quality discussed here, regions outside the X-ray bright arms are small enough that the X-ray emission from each can be approximated usefully by a single-temperature plasma model. Regions inside the X-ray bright arms show strong evidence for multi-phase gas (see Paper II). In this paper, however, as a first approximation, we model all regions as a single-temperature plasma, recognizing that this will bias the results for the X-ray bright arms.
We constrain each region to have ∼103 net counts, giving ∼16 000 total regions for a total of ∼16 000 000 net counts. This number of counts is sufficient to determine the temperature of the cluster gas to ≲10 per cent and the metallicity to ∼20 per cent in each of the ∼16 000 independent spatial bins. The density of the cluster gas is always determined to higher precision. We have imposed a lower limit on the region size of 1 arcsec2, to mitigate the effects of Chandra's point spread function. Regions vary in size from 1 to approximately 5000 arcsec2 in the outer regions. Because the statistical uncertainty of the best-fitting metallicity is ∼20 per cent for regions with 1000 counts, we have also performed a second analysis with regions containing at least 2500 net counts each. This latter analysis produces statistical uncertainties of 3–5 per cent on the temperature and ∼15 per cent on the metallicity.
2.3.2 Annular binning
To better study the properties of the ambient cluster gas, we have also performed a radial analysis in which we exclude the X-ray bright arms. This greatly simplifies the interpretation of the results. For this analysis, we use annuli that vary in width from 10 to 30 arcsec, with ∼250 000 net counts in each for a total of 36 annuli. Each annulus is fitted with a single-temperature mekal or apec spectral model (Section 2.3.3) with Galactic absorption. We have analysed the northern (position angles2 −135° to 86°) and southern (position angles 86° to 225°) profiles both separately and together, always excluding the arms.
2.3.3 Plasma models
The spectra have been analysed using xspec (version 12.5; Arnaud 1996). We use the mekal and apec plasma emission codes (Kaastra & Mewe 1993; Smith et al. 2001), and the photoelectric absorption models of Balucinska-Church & McCammon (1992). All spectral fits were carried out in the 0.6–7.0 keV energy band. The extended C-statistic available in xspec, which allows for background subtraction, was used for all fitting.
The spectral model, applied to each spatial region, consists of an optically thin, thermal plasma model, at the redshift of the cluster. We fix the Galactic absorption to 1.93 × 10²⁰ atom cm−2 (determined from the Leiden/Argentine/Bonn radio H i survey; Kalberla et al. 2005). The temperature, metallicity and the normalization are free parameters for every region (in detail, the normalizations for each observation of each region are independently free). In determining the metallicity from the two-dimensional spectral maps, all abundances are assumed to vary in a fixed ratio with respect to solar. In our higher signal-to-noise ratio analysis of annular spectra (see Section 4), we have allowed the abundances of O, Ne, Mg, Si, S, Ar, Ca, Fe and Ni to be separate, free parameters. Results on the abundances of individual elements will be presented in a subsequent paper (Paper III). Abundances are given with respect to the ‘proto-solar’ values of Lodders (2003).
2.3.4 Background modelling
Background spectra for the appropriate detector regions were extracted from the blank-sky fields available from the Chandra X-ray Center. The blank-sky fields were processed in an identical manner to the science observation and were reprojected on to the same coordinates using the aspect solution files. Background regions were chosen to match the extraction regions for the science observations. The backgrounds were normalized by the ratio of the observed and blank-sky count rates in the 9.5–12 keV band (the statistical uncertainty in the observed 9.5–12 keV flux is less than 5 per cent in all cases). Due to the very small effective area of the Chandra telescope at hard X-ray energies, there is no significant cluster emission in the 9.5–12 keV band. Due to the high X-ray brightness of the target, uncertainties in the background modelling have little impact on the determination of thermodynamic quantities presented here.
3 THERMODYNAMIC MAPS
3.1 Large-scale thermodynamic properties
Figs 2–5 show the projected temperature, pressure, entropy and metallicity maps determined from our analysis. Fig. 6 shows the same figures in mosaic form with the 90 cm (333 MHz) radio contours from Owen, Eilek & Kassim (2000) overlaid. Point sources and read-out errors have been masked and ignored. These results confirm spectrally, for the first time, many of the features identified by Forman et al. (2005, 2007) from an imaging analysis of the same data set.

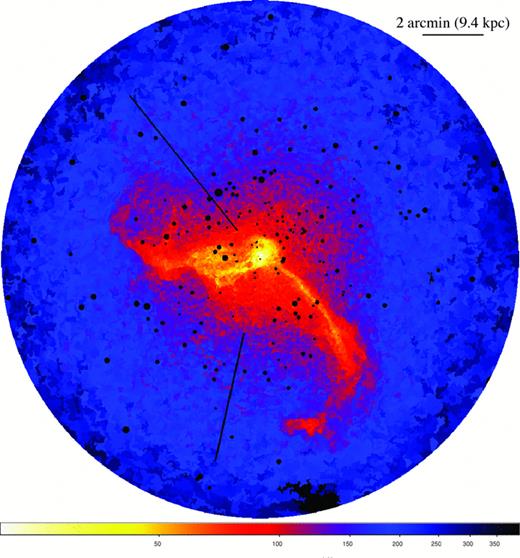
Temperature map of the central regions of the Virgo Cluster (in units of keV) for the 8.5 arcmin (∼40 kpc) radius region indicated by the white circle in Fig. 1. Regions have ∼1000 net counts, leading to 1σ fractional uncertainties in the plotted quantities of ∼10 per cent. Point sources, and readout errors, have been excluded in this analysis and appear as black holes in the maps.
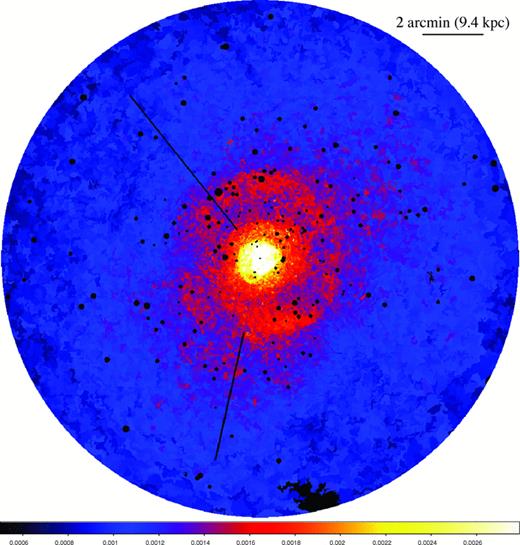
Pressure map in units of  . The number density was calculated from the normalization of the spectra;
  , where K is the mekal normalization, A the projected area and l the line-of-sight depth. C= 1014× 4πD2L/1.2 and depends only on the distance to the source. We assume that the line-of-sight depth is l= 2 Mpc over the field of view. Other details are as for Fig. 2.
Entropy map of M87 in units of  . Other details are as for Fig. 3.
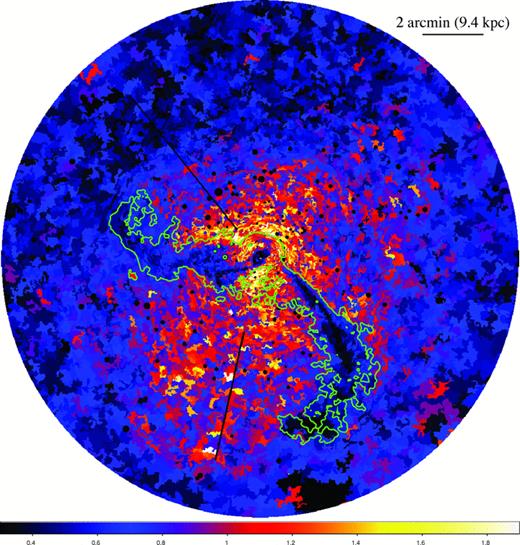
Metallicity map in solar units. Abundances are with respect to the proto-solar values of Lodders (2003). Regions contain at least 2500 net counts each. This results in statistical uncertainties of ∼15 per cent per region. Regions inside the green contours contain significant 1 keV emission (see Fig. 2; Paper II) and are modelled improperly by a single-temperature plasma. As a result, the metallicity in these regions is significantly underestimated (e.g. Buote 2000; Simionescu et al. 2008; Werner et al. 2008). Other details are as for Fig. 2.
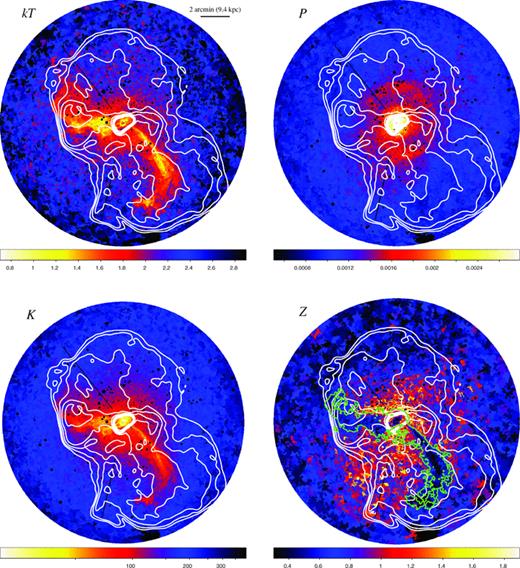
Temperature (kT), pressure (P), entropy (K) and metallicity (Z) maps with the 90 cm radio contours from Owen et al. (2000) overplotted. Other details are as for Figs 2–5.
The temperature map shown in Fig. 2 dramatically reveals the complex temperature structure of the system. The X-ray bright arms stand out as relatively cool structures (Belsole et al. 2001; Young et al. 2002; Matsushita et al. 2002; Molendi 2002; Forman et al. 2005; Simionescu et al. 2007, 2008). They are spatially correlated with enhanced 90 cm radio emission (Fig. 6a; contours are overlaid in white; from Owen et al. 2000). However, within ∼3 arcmin (the radius of the shock front described in Section 5.2.1), the southwestern arm does not coincide precisely with the radio emission (see Fig. 6a; see also Forman et al. 2005, 2007).
Outside of the cool arms, the cluster appears remarkably isothermal at a given radius (see also Section 5.1). The average temperature, excluding the arms, rises from ∼2 keV at a radius r∼ 0.9 arcmin (∼4 kpc) to ∼2.7 keV by the edge of the field (r∼ 8.5 arcmin). The X-ray bright, cold arms appear to be the most significant departures from spherical symmetry. Surface brightness discontinuities at r∼ 3.75 (northwest of the AGN) and r∼ 8 arcmin (south of the AGN) noted by Forman et al. (2005) do not have clear, corresponding features in these maps.
The pressure map shown in Fig. 3 (Fig. 6b with 90 cm radio contours from Owen et al. 2000) appears significantly more regular than the temperature map. The exception is a ring of high pressure at a radius of r∼ 3 arcmin that is approximately ∼0.7 arcmin thick. Forman et al. (2007) also see a feature at this radius in their analysis and argue that it is consistent with an AGN-driven shock propagating through the ICM with a Mach number of M∼ 1.2.
At the location of the cool arms, the observed pressure is somewhat lower. This is, however, likely an artefact due to the strong, projected multi-temperature structure in the direction of the X-ray bright arms in these regions (Paper II).
The entropy map (Fig. 4) reveals a similar morphological structure to the temperature map. The cool, X-ray bright arms have significantly lower entropy than the ambient ICM at the same radius. This suggests that the gas within the arms originates from the low entropy central regions of the cluster. The detailed thermodynamics of the arms are discussed in Paper II.
The metallicity of the ambient cluster gas (Fig. 5) peaks at a value of ∼1.5 solar near the core and drops to ∼0.3 near the edge of the field, r∼ 8.5 arcmin (40 kpc). The southern region is also more metal rich than the north and will be discussed further in Section 4.2.
At the first glance, our maps suggest a reduced metallicity within the X-ray bright arms with respect to the ambient gas (the green contours of 1 keV emission; see Paper II). However, this apparent decrement is likely a bias due to the complex multi-temperature structure within the arms (e.g. Buote 2000; Simionescu et al. 2008; Werner et al. 2008 and references within). The metallicity structure of the X-ray bright arms will be discussed further in Paper III.
A high-metallicity structure is observed at a radius of r∼ 4.5 arcmin to the west of the central AGN. This ridge connects with the high metallicity extension to the northwest of the core at a radius of r∼ 3.3 arcmin. However, this ridge is not continuous, with some regions of low abundance mixed within. As discussed in Section 5.3, this structure is likely due to the uplift of cool, metal-rich gas in the wake of buoyantly rising, radio-emitting plasma. High-metallicity ridges are also observed in the Perseus Cluster, Ophiuchus Cluster and Abell 2204 (see Sanders, Fabian & Dunn 2005; Million et al. 2010; Sanders, Fabian & Taylor 2009).
3.2 Thermodynamic properties of the inner regions
Temperature and pressure maps for the central 2 × 2 arcmin2 (9.4 × 9.4 kpc2) region of M87 are shown on an enlarged scale in Fig. 7. The 6 cm (5 GHz) radio contours of Hines, Eilek & Owen (1989) have been overlaid. Fig. 8 shows the 0.6–2.0 keV residual X-ray image (extracted from Fig. 1) for the same central 2 × 2 arcmin2 region. A number of prominent features in the images have been labelled with arrows. Each labelled cavity is detected at more than the 10σ statistical significance in surface brightness with respect to the smooth double-β model.
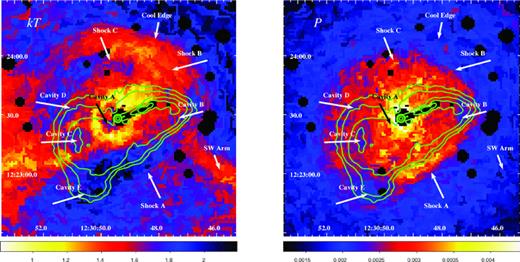
Thermodynamic maps (temperature on left; pressure on right) of the central 2 × 2 arcmin2 section of M87. Radio contours from Hines et al. (1989) are overlaid in green. Several notable features are labelled with arrows.

The jets, which have a hard non-thermal spectral energy distribution (see e.g. Marshall et al. 2002; Wilson & Yang 2002; Perlman & Wilson 2005), would normally appear as bright, high pressure, hot structures in the maps, but have been masked in these images. At a radius of 7 arcsec (0.5 kpc) in the counter-jet direction, we observe a low X-ray surface brightness, hot cavity (‘A’) (see also Young et al. 2002). Interestingly, there is no obvious corresponding radio feature. A region of brighter, cooler gas encircles this structure and the AGN.
Several other low surface brightness cavities are visible in Fig. 8, in the jet and counter-jet directions (see also Forman et al. 2007). These correspond to regions of apparent low pressure and high temperature. Two of these cavities (labelled ‘B’ and ‘C’; both are at a radius of r∼ 40 arcsec from the nucleus in the jet and counter-jet directions) are also filled with radio emitting plasma. Rings of cooler gas surround these cavities. The eastern-most cavity (‘D’), which also has relatively low pressure, lies at the edge of the radio cocoon that surrounds the AGN. Cavity E, labelled ‘bud’ by Forman et al. (2005), is located r∼ 40 arcsec (3 kpc) to the south of the AGN and is associated with high-temperature, low-pressure gas and is filled with radio plasma. Surrounding the cavity is a rim of high pressure material that is possibly shocked gas.
The southwestern edge of the bright radio emission corresponds to a high-pressure, high-temperature, X-ray bright ‘ridge’. We identify this ridge as a shock front. This feature (labelled ‘Shock A’) may extend to surround most of the bright, inner radio cocoon; it is seen clearly to the northwest, though is less obvious to the east. The connecting ‘bridge’ between the central low-temperature region and the southwest arm, which is also cool, appears ‘interrupted’ in projection by this shocked gas. To the northwest, for position angles of −63° to 43°, at a radius of r∼ 40 arcsec from the AGN, a coherent arc of relatively cool gas is observed. This cool gas is a multi-phase structure and is discussed in detail in Paper II. The outer edge of this arc at r∼ 50 arcsec (labelled ‘Cool Edge’) is also probably physically linked to the central region of cooler gas, but is apparently broken up by the shock front (‘Shock B’ and ‘Shock C’).
4 AMBIENT GAS PROPERTIES
4.1 Azimuthally averaged projected profiles
Our thermodynamic mapping reveals, in exquisite detail, the complex structure of the bright X-ray arms (see also Paper II). Just as importantly, Chandra's excellent spatial resolution also allows us to mask these structures and better determine the properties of the ambient gas surrounding M87. In this manner, we can avoid the complicating effects of temperature substructure, which will bias temperature and metallicity results in cases where the wrong thermal model is assumed (e.g. Buote 2000; Simionescu et al. 2008; Werner et al. 2008).
For this analysis, we use 36 annuli that vary in width from 10 to 30 arcsec, each with ∼250 000 net counts. Each region is fitted in the first case with a single-temperature mekal spectral model, with Galactic absorption. We also repeat the analysis using the apec code. The high signal-to-noise ratio of our annular spectra allows us to constrain the abundances of O, Ne, Mg, Si, S, Ar, Ca, Fe and Ni simultaneously, in addition to the temperature and normalization of the cluster gas (19 free parameters; 17 free parameters at large radius). Here, we present results only for Fe. Results on elemental abundances other than Fe will be presented in a subsequent paper (Paper III). Error bars are drawn at the ΔC= 1 (68 per cent) confidence level.
Fig. 9 shows the projected profiles of the temperature and Fe abundance. Results are shown for both the apec (filled circles) and mekal (open squares) plasma codes. Our profiles extend to the edge of the mosaic field of view, r∼ 8.5 arcmin (40 kpc). The inner radius for these profiles is defined by the ‘Cool Edge’ identified at r∼ 50 arcsec (4 kpc) in Fig. 7(a).
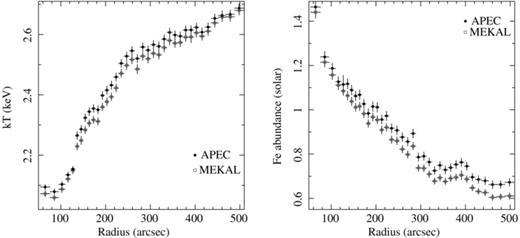
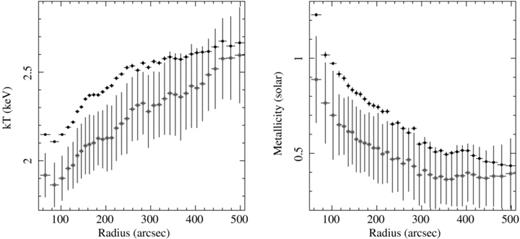
Azimuthally averaged, projected profiles of temperature (left; in keV) and Fe abundance (right) with respect to Lodders (2003) proto-solar abundances. Results are shown for both the mekal (open squares) and apec (filled circles) plasma emission codes (Kaastra & Mewe 1993; Smith et al. 2001, respectively). A radius of 100 arcsec corresponds to a physical scale of 7.8 kpc. The X-ray bright arms are excluded from this analysis (see text). The fits for these spectra include the abundances of O, Ne, Mg, Si, S, Ar, Ca, Fe and Ni as separate, free parameters in addition to the temperature and normalization of the cluster gas.
The temperature profile (Fig. 9a) steadily rises from ∼2.1 to ∼2.5 keV for 50 < r < 240 arcsec. Beyond r∼ 4 arcmin and out to r∼ 8.5 arcmin, the temperature rises more slowly but again steadily, reaching kT∼ 2.7 keV by r∼ 8.5 arcmin. The statistical errors on the measured temperatures range from 0.3 to 0.8 per cent. The results for the two plasma codes exhibit slight differences, with the mekal temperatures being ∼2 per cent lower than those for apec.
Careful inspection of Fig. 9(a) reveals a jump in temperature at a radius of r∼ 130 arcsec. This corresponds to the inner edge of the shock front described in Section 3.1.
The Fe abundance profile (Fig. 9b) peaks at ZFe > 1.4 solar in the central regions. The profile then exhibits a steady decline to ZFe∼ 0.7 solar by r∼ 350 arcsec. A significant enhancement, or ‘bump’, in the Fe abundance is seen for radii 350 < r < 400 arcsec (27–31 kpc). This is approximately the radius at which the bright X-ray arms terminate (see also Section 5.3).
We have investigated the impact of our choice of plasma code on the measured Fe abundances, finding a systematic offset of ∼2 per cent in the results for the mekal and apec codes at lower temperatures. This offset rises to ∼10 per cent for the hottest gas observed at the edge of the field.
4.2 Southern and northern profiles
We have separately analysed the properties of the ICM to the north and south of the X-ray bright arms.3 Here, we have used the apec plasma code only. Fig. 10 shows the projected temperature and Fe abundance profiles to the north (position angles −135° to 86°; filled circles) and south (position angles 86° to 225°; open squares). Our results agree well with those of Simionescu et al. (2007) using XMM–Newton data.
![Projected profiles of the temperature (left; in keV) and Fe abundance [right; with respect to Lodders (2003) proto-solar abundances] for the northern and southern sectors, separately. Here, we use the apec plasma emission code only. Results for the northern sector (position angles −135° to 86°) are plotted as filled circles. Results for the southern sector (position angles 86° to 225°) are shown as open squares.](https://oup.silverchair-cdn.com/oup/backfile/Content_public/Journal/mnras/407/4/10.1111/j.1365-2966.2010.17220.x/2/m_mnras0407-2046-f10.jpeg?Expires=1750255325&Signature=w4Bz4rLYEN3kOeRMRYPq65gazOdOpxAOdRujbdgnNPRt6BDreJlMGMc~Kf8IF3A6QCtxmUn0mmv5nzcHque6jtRLP~ywNkx2B5omQkxQG9iwGmbEGDll4pFRjbQCHBaXuLKItn0SzzawLz~iAOm6ouLVY~TrEVVrwOFg4awD4fin6QMSEyjY8DznVjMhHhOl2Z52nuen~k9AgbH0pvxD90gJqN5pceannwK9ZuOq5sQtNP9gbUvpr5QMOOHkPPIl-VCnd8ruqo9QGpklq6ysxd12Jjxc5KueXkLIA9Gx2Xf8t3L3QHjjiU6FWFcR-vA9FlnTO88~Zl2JxY25ttR8Pg__&Key-Pair-Id=APKAIE5G5CRDK6RD3PGA)
Projected profiles of the temperature (left; in keV) and Fe abundance [right; with respect to Lodders (2003) proto-solar abundances] for the northern and southern sectors, separately. Here, we use the apec plasma emission code only. Results for the northern sector (position angles −135° to 86°) are plotted as filled circles. Results for the southern sector (position angles 86° to 225°) are shown as open squares.
The northern gas temperature profile is approximately constant at kT∼ 2.1 keV for 50 < r < 100 arcsec, and then rises to ∼2.7 keV by 300 arcsec. Beyond this, the temperature rises only slightly out to r∼ 500 arcsec. In contrast, the southern profile shows a stronger temperature gradient. The central 100 arcsec dips below 2 keV whilst at large radii r∼ 450 arcsec the temperature rises to kT∼ 2.7 keV.
The measured Fe abundance is consistently lower in the northern sector, presumably due to metal transport by sloshing (see Simionescu et al. 2010). For both the north and south, however, the Fe abundance peaks in the centre and drops steadily out to a radius r∼ 400 arcsec. To the north, we observe a bump of enhanced Fe abundance at 330 < r < 400 arcsec. A less significant bump is also observed to the south. This radius corresponds to the outer radius of the X-ray bright arms. A second large bump appears to begin at r∼ 500 arcsec (39 kpc) to the north, which corresponds to the outer radius of the overall radio halo and suggests a similar origin. However, our profiles do not extend far enough to unambiguously confirm this feature. The southern profile shows no convincing evidence of Fe abundance enhancements at r≳ 400 arcsec.
5 DISCUSSION
5.1 Isothermality of the ambient cluster gas
The X-ray bright arms are well known to have multi-temperature structure (e.g. Belsole et al. 2001; Matsushita et al. 2002; Molendi 2002; Simionescu et al. 2008; Paper II). Previous spectral analyses have suggested that the gas outside of the X-ray bright arms is approximately isothermal at a given radius (Matsushita et al. 2002). Our data, however, allow us to study the spatial temperature structure in more detail. Such measurements have important implications for the physics of the ambient ICM, including e.g. the efficiency of thermal conduction and the assumption of hydrostatic equilibrium.
To determine the presence of multi-temperature structure at a given radius, we have made histograms of our different measurements of kT in 0.3 arcmin wide annular regions (Figs 11 and 12). The analysis was performed in eight annuli in the radial range of 90 < r < 235 arcsec. For this analysis, we use position angles of −81° to 42°. The width of the annuli was chosen to be large enough that ∼75 different bins from the thermodynamic maps are present in each. For this analysis, we use the temperature map created with at least 2500 net counts per region. The spectral models fitted to the individual spectra have the abundance ratios fixed to the best-fitting values determined from the analysis described in Section 4.1 (see Section 5.1.1; see also Paper III).
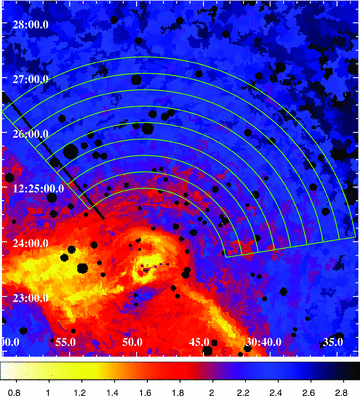
6.5 × 6.5 arcmin2 section of the temperature map made with regions that contain ∼2500 net counts. The eight partial annuli used in the analysis are overplotted in green. The average error per bin is ∼5 per cent in temperature.
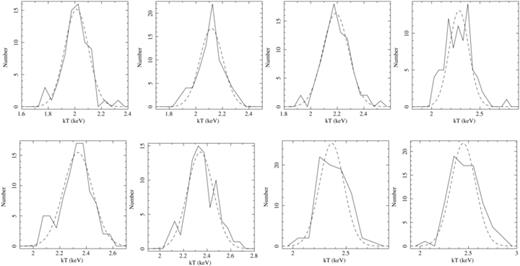
Histograms of temperature measurements (in keV) for all eight regions. Each region contains ∼75 independent temperature measurements. Gaussians with standard deviation equal to that of the average measurement error per bin are overplotted (dashed lines). Only one region shows significant deviation away from isothermality.
We have also tested each individual region for spectral evidence of multi-temperature structure. A four-temperature model (see Paper II) shows an absence of any significant thermal emission at temperatures between 0.5 < kT < 1.5 keV at larger than the few per cent level (see also Fig. 11).
Having determined the distribution of temperature measurements, we compare this distribution with a Gaussian model. The width of the Gaussian is set to be equal to the average statistical error per bin (the typical standard deviations are approximately 3–5 per cent). Errors in each bin were determined from an MCMC analysis having chain lengths of at least 104 samples, after correcting for burn-in. A good match between the temperature measurements and the Gaussian model would be consistent with isothermality. Fig. 13 shows the ratio of the observed width of the emission measure distribution (labelled σ) divided by the expectation, given the observed mean statistical error (labelled δ).
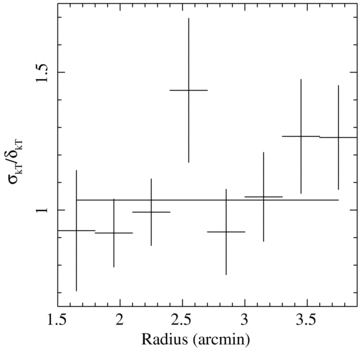
The ratio of the standard deviation of a Gaussian model fitted to the observed temperature distribution (σ) and the average error per bin in the thermodynamic maps (δ) as discussed in Section 5.1. The ratio of errors is consistent with a constant value, which is overplotted on the data.
Only one out of eight regions shows evidence for a deviation from isothermality. This region is located at the temperature discontinuity behind the shock front. The temperature distribution in the other seven regions is consistent with being isothermal. Projection effects are not expected to have a significant influence on the analysis.
The observed isothermality at a given radius implies either that the ambient cluster gas beyond the arms is relatively undisturbed by AGN uplift, or that there is efficient conduction within a spherical shell. If conduction is responsible for the observed isothermality at a given radius, then the likely orientation of the magnetic fields is perpendicular to the radial direction, as expected under action of the heat-flux-driven buoyancy instability (HBI; Quataert 2008; see also e.g. Bogdanović et al. 2009; Parrish, Quataert & Sharma 2009).
Visual inspection of Fig. 5 also suggests that the metals in the ambient ICM are significantly clumped. A detailed analysis of the metal distribution and a discussion of the implications for turbulence and conduction in the ICM will be presented in future work.
5.1.1 Temperature bias
Fig. 14 shows the temperature (left) and metallicity (right) profiles measured from both the peaks of the emission measure distributions for the individual regions (open squares) and the integrated annular spectra presented in Section 4 (filled circles). The temperature and metallicity results from the two techniques are systematically different by 10 and 30 per cent, respectively. The magnitude of this offset decreases as a function of radius.
Temperature (left) and metallicity (right) measured from the mean of the emission measure distribution when fit with a Gaussian (open squares) and from the integrated spectrum using 250 000 net counts and the same, simple spectral model for the same annular regions in Section 4 (filled circles). The spectral model is a single-phase temperature model with elemental abundances tied to Fe. Both the temperature and metallicity are systematically offset by 10 and 30 per cent, respectively, when measured with the two techniques. This is due to the incorrect modelling of the line emission around the Fe L complex, where Chandra's effective area is the largest.
From spectral simulations, we have determined that this bias is a combined modelling and signal-to-noise ratio issue. Low-temperature spectra (below ∼3 keV) contain a strong line contribution at energies where Chandra's effective area is the largest. However, in low signal-to-noise ratio spectra, one cannot determine the abundances of individual elements separately. These are instead implicitly tied to the Fe abundance. The flux from line emission is, therefore, modelled improperly which biases the temperature and metallicity to low values. Increasing the signal-to-noise ratio of the spectra reduces these biases, while simultaneously causing the residuals around the Fe L complex to significantly increase. The apparent position dependence is, therefore, explained by the temperature dependence of the intensity of these line components. The bias in low signal-to-noise ratio spectra can be lessened by fitting a model with the abundance ratios of the individual elements adjusted to their best-fitting values, as determined from a fit to the higher signal-to-noise ratio spectra.
We emphasize that this bias does not affect the primary conclusions of this paper. Where appropriate, we have used the abundance ratios measured from the high signal-to-noise ratio radial analysis (see Paper III) to reduce the impact of this effect.
5.2 Analysis of the shock fronts
5.2.1 The pressure ring at r ∼180 arcsec (14 kpc)
The large-scale pressure map (Fig. 3) reveals the presence of a thick (∼40 arcsec) high pressure ring at ∼180 arcsec. This feature has previously been identified as a shock with Mach number M∼ 1.2 and age ∼14 Myr (Forman et al. 2007).
Fig. 15 shows the projected surface brightness (upper panels; in counts s−1 arcsec−2) for the position angles 190° to 220° (south of the AGN; left) and position angles 350° to 20° (north of the AGN; right). These surface brightness profiles show signatures commensurate with a weak shock at a radius of r∼ 180 arcsec. The relevant features occur at a slightly smaller radius to the south with respect to the north (r∼ 170 as opposed to r∼ 180 arcsec). Overplotted on these profiles are simple shock models for a range of Mach numbers: for the northern sector, Mach numbers of 1.30, 1.34 and 1.38; for the southern sector, Mach numbers 1.24, 1.29 and 1.33.
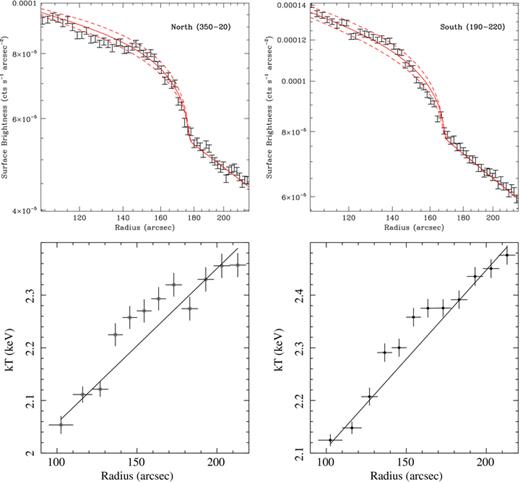
Projected surface brightness (top; in count s−1 arcsec−2) for position angles 190° to 220° (left) and position angles 350° to 20° (right). The projected temperature profiles (bottom; in keV) are drawn from Fig. 10 (left is south; right is north). The surface brightness profiles show a clear discontinuity at ∼170–180 arcsec, corresponding to the outer edge of the shock. For the southern sector (position angles 190° to 220°; left) shock models with Mach numbers 1.25, 1.29 and 1.33 at a radius of 168 arcsec are plotted; for the northern sector (position angles 350° to 20°; right), models with Mach numbers 1.30, 1.34 and 1.38 at a radius of 180 arcsec are shown. The overplotted spread in Mach numbers represent a conservative estimate for the uncertainty in the measured Mach number. For the temperature profiles, we approximate the ambient temperature profile as linear fits to the temperature profiles in the plotted radial range, excluding temperature bins within the ∼40 arcsec thick shock. The projected temperature in the region of the shock is ∼5 per cent hotter than the best-fitting ambient model.
The shock models assume a spherically symmetric, hydrodynamic model of a point explosion in an initially isothermal, hydrostatic atmosphere. The initial gas density profile is assumed to be a power law, which is adjusted to match the observed surface brightness profile beyond the shock (Nulsen et al. 2005a; Simionescu et al. 2009). We have also explored a model that injects a constant amount of energy per unit time into the system. This model provides no significant change to the calculated surface brightness profile, which is already fit well by the simple point explosion model.
These models show overall good agreement with the data and the analysis performed by Forman et al. (2007). Table 2 shows the Mach number and shock radius from four different 30° wedges (from −40° to 50° and also from 190° to 220°). Systematic uncertainties dominate the modelling of the surface brightness in these wedges. These include any projected non-sphericity of the shock due to the likely jet axis alignment near our line of sight, and the incorrect assumption of an initially isothermal, hydrostatic atmosphere. We, therefore, do not include standard, statistical error bars from the models. Instead, we estimate the uncertainty in the Mach number by finding a Mach number which brackets the observed scatter in the surface brightness profiles (see Fig. 15). This represents a conservative estimate of the uncertainty in the Mach number of the shock. The overall shape of the surface brightness constrains the Mach number of the shock to within ∼5 per cent. The radius and Mach number of the shock vary at the 10 per cent level as a function of position angle. This is likely due to the detailed structure of the ambient gas and shock front in each sector.
Summary of the shock models for each of the four different surface brightness profiles. Columns list the position angles of included data, shock radius and the Mach number of the observed shock within each position angle range. Conservative uncertainties on the Mach number, which bracket the observed scatter in the surface brightness profiles, are estimated to be M± 0.04.
| Position angle (degrees) | r (arcsec) | M |
| 20–50 | 182 | 1.16 |
| 190–220 | 168 | 1.29 |
| 320–350 | 188 | 1.21 |
| 350–20 | 180 | 1.34 |
| Position angle (degrees) | r (arcsec) | M |
| 20–50 | 182 | 1.16 |
| 190–220 | 168 | 1.29 |
| 320–350 | 188 | 1.21 |
| 350–20 | 180 | 1.34 |
The temperature profiles for the position angles of −135° to 86° and 86° to 225°, drawn from Fig. 10, are shown in the lower panels of Fig. 15 We have approximated the ambient temperature profile as a linear fit to the plotted data range, excluding the bins within the ∼40 arcsec thick shock. Under this assumption, we observe that both the northern and southern projected temperature profiles contain at least four bins (between 130 ≲r≲ 170 arcsec) that appear hotter (∼5 per cent) than expected. Fig. 16 shows the expected projected temperature profile divided by the pre-shock temperature profile as a function of radius. The ∼5 per cent rise in the temperature and the ∼40 arcsec thick shock in the observed, projected temperature profile are fully consistent with the shock model given an average Mach number M= 1.25 (see Fig. 16). We, therefore, conclude that the high pressure ring is consistent with a shock with M= 1.25.
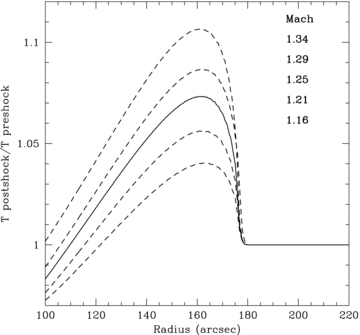
Expected emission-weighted projected temperature profile divided by the pre-shock temperature given the Mach numbers determined from the shock models in four angular sectors. The average shock with Mach number M= 1.25 at a radius of r= 180 arcsec is represented by the solid line. The observed ∼5 per cent increase in temperature and the ∼40 arcsec thickness of the over-pressurized region is well explained by the shock model.
Thick shocks have also been observed in the Perseus Cluster (see Fabian et al. 2006), which does not show a clear temperature jump at the leading edge of the front. The small increase in temperature within the thick overpressurized ring in M87 suggests that shock heating is present in these systems but that the thickness and the small amount of heating associated with these weak shocks make temperature increases difficult to detect.
5.2.2 The inner shock
A second shock is seen closer to the core (∼40 arcsec; Section 3.2; Fig. 7). The properties of this shock are difficult to constrain due to its proximity to the core. Many other surface brightness features (e.g. the cavities filled with radio plasma seen in Fig. 7) are observed at similar radii, preventing an accurate determination of the pre-shock gas properties and the Mach number. However, the projected temperature jump seen to the south of the AGN at r∼ 40 arcsec (3 kpc; Fig. 7), suggests a Mach number of at least M≳ 1.2.
The presence of the two shocks suggests that AGN outbursts are fairly common. The estimated Mach numbers from these shocks and their relative distances can be used to determine the frequency of these outbursts. These shocks suggest that AGN outbursts occur approximately every ∼10 Myr. Shock heating is likely only relevant in the central regions of the cluster because shocks significantly weaken as they expand. If repeated shocks occur every ∼10 Myr, as is suggested here, then AGN-driven, weak shocks could produce enough energy to offset the radiative cooling of the ICM (Nulsen et al. 2007).
5.3 Uplift of cool, metal-rich gas
Böhringer et al. (1995; see also Churazov et al. 2001) propose that rising bubbles filled with radio emitting plasma may be responsible for dragging cool, metal-rich gas up out of the central regions of clusters. Buoyant bubbles will rise to a height that depends on their entropy, stopping when they reach their appropriate adiabat. This process may explain the observed radio edges at r∼ 300–400 arcsec (23–31 kpc) and also at r∼ 400–500 arcsec (31–39 kpc). When the bubbles reach their maximum height, they flatten. A consequence of this interpretation is that metal-rich gas rising with the radio bubbles should be deposited at a radius similar to that at which the bubbles flatten. Our abundance profiles show evidence for enhancements in Fe abundance at 320 < r < 400 arcsec (see Figs 9b and 10b). This is a similar radius to the outer edges of the X-ray arms. Indeed, bumps are observed in the abundance profiles of all elements except oxygen (Paper III).
 is the mass fraction of Fe (Lodders 2003). We measure the gas mass and excess Fe abundance in the northern sector from a deprojection analysis (using data from position angles of −108° to 55°). This implies a total mass of uplifted Fe of ∼1.0 × 10⁶ M⊙. We compare this to the Fe mass currently present in the arms (Simionescu et al. 2008). For a gas mass of 5 × 10⁸ M⊙ and an Fe abundance of 2.2, those authors measure an Fe mass of 1.5 × 10⁶ M⊙ in the X-ray bright, cool arms. Thus, a single generation of uplifted metals from buoyant bubbles is, in principle, enough to explain the observed excess Fe mass at large radius. It is unknown how much of the uplifted metals will remain at large radius after the bubbles flatten. Lower significance bumps at higher radius that coincide with previous generations of radio bubbles may argue that this process occurs over multiple generations. It is likely that the magnetic field configuration and its evolution will also have an impact (e.g. Bogdanović et al. 2009). In the Perseus Cluster, metallicity enhancements also correspond well to the edges of several radio lobes, which suggests a similar origin to that discussed here (see Sanders et al. 2005). This process may also partly explain the metallicity ridges observed around the central regions of some cool-core galaxy clusters (Sanders et al. 2005, 2009; Million et al. 2010).
We note that bumps in the Fe abundance profiles are not clearly observed to the south. However, the mean Fe abundance is larger in the south than in the north and a cold front is located at a similar radius (Simionescu et al. 2007, 2010), making the identification of such a bump more difficult. Our results support the rising and pancaking bubble simulations presented in Churazov et al. (2001; see also e.g. Brüggen & Kaiser 2002; Kaiser 2003; Brüggen 2003; Ruszkowski et al. 2004a,b; Heinz & Churazov 2005).
6 SUMMARY
Utilizing a detailed, spatially resolved spectral mapping and an ultra-deep (574 ks) Chandra observation of M87 and the central regions of the Virgo Cluster, we present an unprecedented, close-up view of AGN feedback in action. Our maps reveal X-ray bright arms that have been lifted up by buoyant radio bubbles as relatively cool, low-entropy features that are rich in structure (see e.g. Belsole et al. 2001; Molendi 2002). The detailed properties of these arms are discussed in Paper II. Outside the arms, the ambient cluster gas is strikingly isothermal at each radius. This suggests that either the gas remains relatively undisturbed by AGN uplift or conduction is efficient along the azimuthal direction, as expected under action of the HBI. Many cavities are seen in the inner radio cocoon (∼40 arcsec or ∼3 kpc) including one located at ∼7 arcsec (∼0.5 kpc) from the central AGN in the counter-jet direction. These cavities are associated with decreased surface brightness, high temperatures, low thermal pressure, and typically appear filled with radio plasma in projection.
Our pressure map confirms spectrally previous results on the presence of a circular shock front at r∼ 180 arcsec (14 kpc). Based on the surface brightness jump, we measure an average Mach number of M= 1.25 for the shock at r∼ 180 arcsec, in good agreement with the analysis of Forman et al. (2007). Under the assumption of a linearly rising temperature profile, we also measure a temperature jump within the ∼40 arcsec thick shock, consistent with the expectations for a shock with Mach number M= 1.25. The thickness and overall weakness of these shocks will make it difficult to detect temperature jumps unambiguously in hotter clusters like Perseus (e.g. Fabian et al. 2006; Graham et al. 2008).
Another shock, associated with the central radio cocoon, is observed at ∼40 arcsec (∼3 kpc). Because of the complexity of this region, we can only estimate the Mach number of this shock, using the observed projected temperature jump across the front. This suggests a Mach number of M≳ 1.2. The relative distances and Mach numbers of these shocks suggest that AGN outbursts are common and occur every ∼10 Myr.
Our results show that a significant mass of metals is lifted up to large radius in the wake of the radio bubbles. At least 1.0 × 10⁶ M⊙ of Fe is uplifted to a radius of 350–400 arcsec (27–31 kpc) to the north of the AGN. Given that a similar amount of Fe (1.5 × 10⁶ M⊙) is present in the X-ray bright arms (Simionescu et al. 2008), a single generation of bubbles can, in principle, explain the observed Fe excess. It is still uncertain how much metal falls towards the central regions after this process occurs. Fe uplift of this magnitude may explain the observed metallicity ridges observed around some cool-core clusters. Studies of such abundance features can further enhance our understanding of transport processes. This will be the subject of future work.
In detail, this is the sum of two β models of the form  , where S0 is the amplitude of the X-ray surface brightness, rc is the core radius and α is the power-law index.
All position angles are measured counter-clockwise from north.
The cool X-ray bright arms remain excluded in this analysis.
We thank W. R. Forman, C. Jones and E. Churazov for helpful comments and R. G. Morris for computational support. NW and AS were supported by the National Aeronautics and Space Administration through Chandra/Einstein Postdoctoral Fellowship Award Number PF8-90056 and PF9-00070 issued by the Chandra X-ray Observatory Center, which is operated by the Smithsonian Astrophysical Observatory for and on behalf of the National Aeronautics and Space Administration under contract NAS8-03060. This work was supported in part by the US Department of Energy under contract number DE-AC02-76SF00515. All computational analysis was carried out using the KIPAC XOC compute cluster at Stanford University and the Stanford Linear Accelerator Center (SLAC).
REFERENCES
