


Abstract
Combining Monte Carlo radiative transfer simulations and accurate 2D bulge/disc decompositions, we present a new study to investigate the effects of dust attenuation on the apparent structural properties of the disc and bulge of spiral galaxies. We find that dust affects the results from such decompositions in ways which cannot be identified when one studies dust effects on bulge and disc components separately. In particular, the effects of dust in galaxies hosting pseudo-bulges might be different from those in galaxies hosting classical bulges, even if their dust content is identical. Confirming previous results, we find that disc scalelengths are overestimated when dust effects are important. In addition, we also find that bulge effective radii and Sérsic indices are underestimated. Furthermore, the apparent attenuation of the integrated disc light is underestimated, whereas the corresponding attenuation of bulge light is overestimated. Dust effects are more significant for the bulge parameters, and, combined, they lead to a strong underestimation of the bulge-to-disc ratio, which can reach a factor of 2 in the V band, even at relatively low galaxy inclinations and dust opacities. Nevertheless, it never reaches factors larger than about 3, which corresponds to a factor of 2 in bulge-to-total ratio. Such effect can have an impact on studies of the black hole/bulge scaling relations.
1 INTRODUCTION
The vital role of interstellar dust as an important component of the interstellar medium in galaxies has been demonstrated extensively. One of the least popular aspects of interstellar dust, at least for those astronomers who consider dust as a nuisance rather than a fascinating field per se, is the efficiency at which it absorbs and scatters ultraviolet (UV)/optical radiation. It has been known for many decades that the presence of dust influences the observed, apparent photometric galaxy parameters (apparent scalelengths, surface brightnesses, luminosities, axial ratios, etc.) and makes it a challenge to recover the intrinsic, unaffected parameters.
Several authors have investigated these effects using radiative transfer modelling with varying degrees of sophistication and/or geometrical realism. In general, it was found that the importance of dust attenuation varies as a function of wavelength, galaxy inclination and star-dust geometry (e.g. Bruzual, Magris & Calvet 1988; Byun, Freeman & Kylafis 1994; Evans 1994; Bianchi, Ferrara & Giovanardi 1996; de Jong 1996; Baes & Dejonghe 2001b; Cunow 2001). The most up-to-date study on this topic is the recent investigation by Möllenhoff, Popescu & Tuffs (2006). These authors investigate the systematic effects of dust attenuation on the apparent scalelengths, central surface brightnesses and axial ratios in pure disc galaxies as a function of inclination and dust mass. They find that dust can significantly affect both the scalelength and central surface brightness, inducing variations in the apparent to intrinsic quantities of up to 50 per cent in scalelength and up to 1.5 mag in central surface brightness in the B band.
Unfortunately, these studies are typically restricted to the disc component only. Nevertheless, it is extremely important to investigate the effects of dust attenuation on the bulge parameters as well. Bulges hold clues to different galaxy formation and evolution processes (see e.g. Kormendy & Kennicutt 2004; Athanassoula 2005; Gadotti 2009, and references therein). Galaxies hosting classical bulges are believed to have had evolutionary histories with a significant contribution from mergers, as opposed to galaxies hosting pseudo-bulges, with a more quiet evolution. In fact, Durbala et al. (2008) present results which suggest that pseudo-bulges are related to isolated galaxies. Like discs, bulge structural parameters are also expected to be affected by dust attenuation. Indeed, Driver et al. (2007) find empirically that about twice as many photons produced in bulges are absorbed by dust as photons produced in discs.
In the last few years, two independent teams have investigated the effects of dust attenuation in bulge and disc components, on their integrated properties, separately, using realistic models of spiral galaxies. Pierini et al. (2004) presented attenuation functions for the individual disc and bulge components of dusty spiral galaxies, based on the dirty Monte Carlo radiative transfer code (Gordon et al. 2001). In a similar way, Tuffs et al. (2004; see also Driver et al. 2008) investigated the attenuation of the bulge and disc components in spiral galaxies using the scattered-intensities method pioneered by Kylafis & Bahcall (1987) and Byun et al. (1994). Both teams clearly demonstrated that the effects of dust on the bulge and disc components can differ substantially, as a result of the different star-dust geometry.
In the framework of our series of papers on radiative transfer in disc galaxies (Baes & Dejonghe 2001a,b; Baes et al. 2003), we aim to extend this approach one stage further and want to investigate the systematic effects of dust attenuation on the apparent detailed structural properties of discs and bulges simultaneously. As mentioned, dust attenuation effects on the determination of structural parameters of pure discs, and on integrated properties of individual bulges and discs, have been studied. However, most massive galaxies contain a bulge and a disc, and the determination of structural parameters for the different galactic components through 2D image decomposition has become a popular tool (e.g. Laurikainen, Salo & Buta 2005; Allen et al. 2006; Graham & Worley 2008; Gadotti 2009, and references therein). How dust affects the direct output of such decompositions still needs to be evaluated. This is the main goal of the current study. As we will see, the complexity of such decompositions can lead to unforeseen effects. Dust effects in one galaxy component can alter the parameters of the other component even if dust is absent in the latter.
In order to perform such study, we have created several realistic, dusty disc galaxy models, with different dust opacities and at various inclination angles, and carried out sophisticated 2D bulge/disc decompositions on these models. This paper is organized as follows. The next section describes how the models were created and the 2D fits carried out. Section 3 presents how disc and bulge parameters obtained through the 2D fits vary with dust opacity and inclination angle. The results are discussed in Section 4. In Section 5, we discuss possible implications of our results on galaxy structure studies. Finally, in Section 6 we summarize our main conclusions.
2 THE MODELLING PROCESS
2.1 Input models
The input models are a subset of an extensive library of disc galaxy models, set up to investigate in a systematic way the attenuation, dust temperature structure and far-infrared/submillimeter emission (Baes et al., in preparation). The models considered in this paper consist of a double-exponential stellar disc, a spherical stellar Sérsic bulge and a double-exponential dust disc.1 To cover both early-type and late-type galaxies, we consider two types of models, denoted as TrueBulge and PseudoBulge models. The models we consider are based on the results of Hunt, Pierini & Giovanardi (2004), who obtained the structural parameters of 108 disc galaxies using H-band observations, and the work of Gadotti (2009), who similarly performed 2D decomposition of almost 1000 galaxies using images from the Sloan Digital Sky Survey Data Release 2 in the g, r and i bands. Our models thus mimic the typical galaxy hosting a classical bulge and the typical galaxy hosting a pseudo-bulge, according to observational results.
The stellar disc has four free parameters: the radial scalelength hR, the vertical scalelength, or scaleheight, hz, the stellar age tdisc[the intrinsic spectral energy distribution (SED) is represented as a simple stellar population with solar metallicity – hereafter SSP] and the bolometric luminosity Ldisc,bol (or equivalently, the luminosity Ldisc,X in a given band X). The TrueBulge model is characterized by a disc with scalelength hR= 4 kpc, H-band luminosity Ldisc,H= 7.08 × 10¹⁰ L⊙ and stellar age tdisc= 4 Gyr. The vertical scalelength of the stellar disc was not recovered in the studies mentioned above; based on our own Milky Way, we adopt the value hz= 350 pc. This results in hR/hz∼ 11, a value in agreement with studies of edge-on spiral galaxies (de Grijs 1998; Schwarzkopf & Dettmar 2000). The PseudoBulge model disc has the same scalelength, scaleheight and SSP age, but the disc is slightly less luminous with Ldisc,H= 6.70 × 10¹⁰ L⊙.
The stellar bulge is also characterized by four parameters: the effective radius Re, the Sérsic index n, the age tbulge and the bolometric luminosity Lbulge,bol (or Lbulge,X). For the TrueBulge model, we adopt the structural values Re= 1.5 kpc and n= 3.5. The stellar population is assumed to be relatively old and red at tbulge= 11 Gyr. With a luminosity of Lbulge,H= 4.72 × 10¹⁰ L⊙, the bulge contributes 40 per cent of the total luminosity in the H band. The bulge of the PseudoBulge model is smaller, less concentrated, younger and fainter; the parameters are Re= 750 pc, n= 1.5, tbulge= 4 Gyr and Lbulge,H= 7.45 × 10⁹ L⊙. In the H band, this comes down to a contribution of only 10 per cent.
Parameters describing the dusty disc galaxy models in the H band.
| Parameter | Unit | TrueBulge | PseudoBulge |
| H-band disc luminosity Ldisc,H | 109 L⊙ | 70.8 | 67.0 |
| Stellar disc scalelength hR | kpc | 4.0 | 4.0 |
| Stellar disc scaleheight hz | kpc | 0.35 | 0.35 |
| Stellar disc SSP age tdisc | Gyr | 4.0 | 4.0 |
| H-band bulge luminosity Lbulge,H | 109 L⊙ | 47.2 | 7.45 |
| Bulge Sérsic index n | – | 3.5 | 1.5 |
| Bulge effective radius Re | kpc | 1.5 | 0.75 |
| Bulge SSP age tbulge | Gyr | 11.0 | 4.0 |
| H-band total luminosity Ltot,H | 109 L⊙ | 118 | 74.5 |
| H-band bulge fraction (B/T)H | – | 0.4 | 0.1 |
| Dust disc scalelength hR,d | kpc | 4.0 | 4.0 |
| Dust disc scaleheight hz,d | kpc | 0.14 | 0.14 |
| V-band face-on optical depth τ | – | 0–8 | 0–8 |
2.2 Radiative transfer simulations
The dust-affected galaxy images are constructed with the 3D Monte Carlo radiative transfer code skirt (Baes et al. 2003; Baes, Dejonghe & Davies 2005a). skirt was originally developed to study the effects of dust absorption and scattering on the observed kinematics of galaxies. It has grown to be a flexible Monte Carlo radiative transfer code that can be used to model a variety of dusty systems, from spiral and elliptical galaxies to circumstellar dust discs. It takes into account the physical processes of absorption, multiple anisotropic scattering and thermal re-emission by dust grains. Further, the code is strongly optimized, using many well-known and some novel Monte Carlo radiative transfer optimization techniques, including forced first scattering, photon peel-off, continuous absorption, polychromatism and smart detectors (see e.g. Mattila 1970; Witt 1977; Yusef-Zadeh, Morris & White 1984; Lucy 1999; Bjorkman & Wood 2001; Baes et al. 2005b; Juvela 2005; Jonsson 2006; Baes 2008). The general output of the code is global and spatially resolved SEDs and images for arbitrary viewing points and at any wavelength from the UV to the millimetre range.
Given that the calculation of the volume emissivity of the bulge component is not trivial, and the fact that our results are fundamentally based on this calculation, we describe in Appendix A how skirt deals with it.
The model images used here are V-band images created from a viewing point with inclinations i of 15°, 30°, 45° and 60° with respect to the plane of the disc of the galaxy (a face-on projection corresponds to i= 0°). We did not investigate galaxies at an inclination higher than 60°, as for these galaxies the scaleheight of the disc plays an important and complicating role. A circular Gaussian function is convolved with the images in order to simulate the effects of atmospheric turbulence and instrumental resolution. The Gaussian variance was chosen as to produce a point spread function (PSF) with full width at half-maximum (FWHM) typical of most imaging data from ground-based telescopes, corresponding to 75 pc in our simulated images. In total, we investigated 64 images. The simulated images contain 481 × 481 pixels with a pixel size of 50 pc, resulting in a total field of view of 24 × 24 kpc.
2.3 Bulge/disc decomposition
We investigate the resulting images from skirt using budda, a code developed to perform a detailed structural analysis of galaxies through 2D image decomposition, and extensively tested (see de Souza, Gadotti & dos Anjos 2004; Gadotti 2008, for details). While the code is able to fit complex systems such as barred galaxies, here we use it to fit only bulge and disc, since these are the only components present in our model images.
The bulge component is fitted with a Sérsic profile, whereas discs are infinitely thin exponential discs. The budda code needs a starting point to fit each parameter, and these values were obtained using iraf. We searched the maximum of the light distribution and considered this as an input for the centre of the model galaxy. An intensity radial profile was used to estimate the bulge and disc structural parameters for each model. The user is also able to set how much each parameter varies at every iteration in the search for the best fit. For the disc central intensity and scalelength, and for the bulge effective intensity, effective radius and Sérsic index, we typically used a variation of about 10 per cent, as this was shown to give best results. For the central coordinates and for the geometrical parameters of bulge and disc (i.e. position angle and ellipticity), we set this value to ∼0.1–1 per cent, as good estimates for these parameters are relatively easier to obtain, using e.g. the ellipse task in iraf. During the fitting process, the code alters these variations as needed by a factor of 2. For instance, when approaching the best solution, such variations gradually fall until convergence is reached. Finally, the fits also take into account the effects produced by our mimicking of seeing effects (see Section 2.2). For each model, we have produced and inspected fits until a satisfactory one was obtained, which usually happened at the first or second run of budda.
Once with the best fit at hand, the next step is to use budda to create an image of the structural model so obtained. To inspect the quality of the fits, we produced residual images by subtracting the budda model image from the skirt dusty model image. An example of these images is given in Fig. 1. The left-hand panel shows an image built with skirt, corresponding to a TrueBulge galaxy model at an inclination of 30°, and with a dust opacity of τ= 1. The middle panel shows the corresponding budda model, whereas the right-hand panel shows the residual image obtained in this case. While the model images are displayed using identical brightness and contrast levels, the residual image is displayed as to significantly enhance the differences between the two images, which do not go above the 10 per cent level. The structure seen in the residual image is caused by the dust disc: the skirt model cannot be fitted perfectly anymore by a stellar disc and a stellar bulge alone.
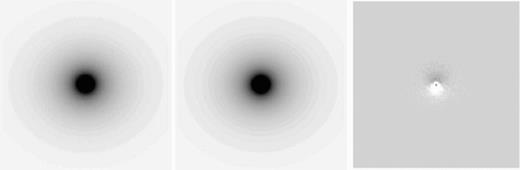
Example of a budda fit (middle panel) to a skirt dusty model (left-hand panel), which corresponds to a TrueBulge galaxy model at an inclination of 30° and with a dust opacity of τ= 1. The right-hand panel is an enhanced residual image, obtained by subtracting the budda fit from the skirt dusty model. The structure seen in the centre of the residual image is mostly a result from attenuation caused by the dust disc. The black dot at the centre results from a small discrepancy between the input skirt model and the budda fit in an area with radius of the order of half the PSF FWHM at the centre of the model images.
3 RESULTS
In this section, we discuss how the bulge and disc structural parameters as obtained from the budda bulge/disc decompositions vary with the inclination i and optical depth τ of the skirt model. The results are summarized graphically in Figs 2 and 3. Before discussing the individual panels in detail, we note that the values of some of the structural parameters obtained with budda at τ= 0, i.e. in the absence of dust, seem to depend on i, and not always reproduce the exact values used as input for skirt, although such differences are very small. The reason for it is that the bulge/disc decomposition performed by budda assumes an infinitely thin disc, whereas the disc in our input radiative transfer model is a double-exponential disc with a finite thickness in the vertical direction. With increasing inclination, the effective thickness of the disc increases and this influences the results of the bulge/disc decomposition. The structural parameters affected by this inclination effect are the bulge effective radius and Sérsic index, and the disc radial scalelength. Nevertheless, such effect only produces variations which are within the typical uncertainties estimated by budda for each parameter.
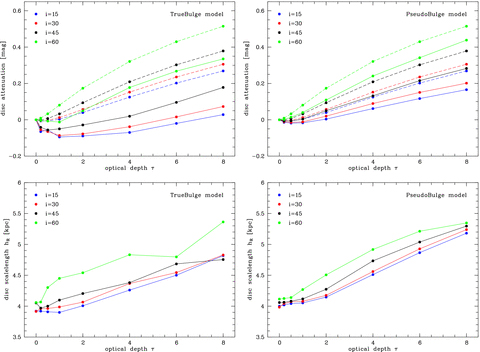
Dependence of the apparent disc parameters on the V-band optical depth τ, as derived from the budda bulge/disc decompositions of the dust-affected images. The panels on the top and bottom rows respectively show the disc attenuation and scalelength. The dashed lines in the top panels show the actual attenuation of the disc as a function of the optical depth. Results for the different inclination angles are shown, as indicated.
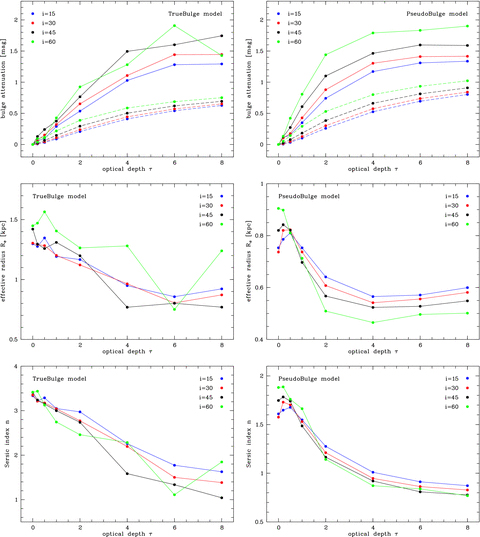
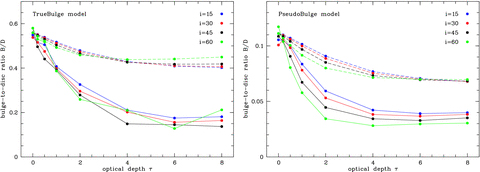
Dependence of the apparent bulge parameters on the V-band optical depth τ, as derived from the budda bulge/disc decompositions of the dust-affected images. The panels on the top, central and bottom rows show, respectively, the bulge attenuation, effective radius and Sérsic index. The dashed lines in the top panels show the actual attenuation of the bulge as a function of the optical depth. Results for the different inclination angles are shown, as indicated.
As mentioned in the Introduction, we have to distinguish the effects caused by the dust disc on the perceived luminosity and structural parameters of galaxies with single stellar structural components (i.e. either a pure stellar disc or bulge) from the effects on the perceived luminosities and structural parameters of stellar discs and bulges in composite galaxies (i.e. disc galaxies with bulges). One can call the former effects as ‘single component effects’, and the latter as ‘composite effects’. In some sense, the single component effects are real effects, whereas the composite effects are a combination of these real effects with a bias introduced by the decomposition. Therefore, we will use the following terminology. We will call the apparent attenuation of the bulge (or disc) luminosity that obtained with the budda fit, which thus includes not only the effects of dust on the component luminosity, but also the effects of dust on the bulge/disc decomposition itself. The apparent attenuation is to be distinguished from what we will call the actual attenuation. The latter is that in the skirt model, and thus comes from the input model to budda, and refers to single component effects. Note that we will only start discussing the actual attenuation of bulge and disc luminosities in Section 4. Thus, all instances in which we mention attenuation before Section 4 refer to composite effects. Furthermore, we only look at single component effects on the attenuation of the integrated bulge and disc luminosities, and not on the other structural parameters, such as the scalelengths and the bulge Sérsic index. Thus, the dust effects on these structural parameters we study in this paper are always composite effects.
3.1 Disc parameters
The solid lines in the top panels of Fig. 2 show the integrated disc attenuation versus optical depth for the TrueBulge and PseudoBulge models. Both plots show mostly a non-monotonous behaviour: the attenuation first decreases to negative values, reaches a minimum value at τ∼ 1, and then increases to positive values for increasing optical depth. This trend is clearly present at all inclinations in the TrueBulge models (with a luminosity increase of up to 0.1 mag for the most face-on inclinations), whereas its effect is much less pronounced in the PseudoBulge models, being absent in the 60° case.
The positive attenuation of the disc for large optical depths is easy to understand, although it is not clear at this moment why the attenuation is more significant in the PseudoBulge models. The negative attenuation, i.e. the apparent brightening of the disc, at moderate optical depths, on the other hand, is rather counter-intuitive. One possible explanation could be the notorious effect of disc brightening at low inclinations due to dust scattering. Photons that initially (or after a scattering event) move on a path nearly parallel to the equatorial plane have a large probability of interacting with a dust grain. If they are scattered into a direction that is nearly perpendicular to the disc plane, the probability of interacting with another dust grain is much smaller, such that they can easily leave the galaxy. The overall net effect of such scattering is that photons are removed from lines of sight with a high inclination and sent into face-on directions, where they leave the galaxy. This effect can easily compensate the loss of radiation due to absorption (Byun et al. 1994; Baes & Dejonghe 2001b; Pierini et al. 2004). However, this effect is only important for nearly face-on inclinations and cannot play a significant contribution for apparent disc brightening at inclinations as high as 60°. Moreover, this effect alone cannot explain the difference in apparent disc brightening between the TrueBulge and PseudoBulge models.
The bottom panels of Fig. 2 show the disc radial scalelength hR versus τ. For all inclinations and for both the TrueBulge and PseudoBulge models, hR generally increases with increasing optical depth. This can easily be understood, given that the dust density decreases exponentially with increasing radius. The attenuation is therefore stronger in the central region, which flattens the surface brightness profile and hence increases the scalelength of the best-fitting exponential profile. However, there is a difference between the TrueBulge and PseudoBulge models which this effect alone cannot explain: for i < 60° and τ > 2, hR is systematically larger for the PseudoBulge models. These results will be further discussed below.
3.2 Bulge parameters
The top panels of Fig. 3 show the integrated bulge attenuation for the TrueBulge and PseudoBulge models as a function of optical depth. In both cases, the attenuation increases drastically with increasing optical depth. It is remarkable that the bulge attenuation is much stronger than the attenuation of the disc at identical optical depths and inclinations.
The slopes of the bulge attenuation versus optical depth curves are not constant, but flatten towards larger optical depths. This is expected, since at large optical depths the entire central region of the galaxy (where the bulge resides) becomes completely optically thick. In these cases, dust behaves as an effective screen for half of the bulge: the further half of the bulge, i.e. the part that lies behind the dust layer, does not contribute to the observable bulge luminosity anymore; only the nearer half of the bulge that lies in front of the dust layer does contribute. As a result, the attenuation curves flatten down. This flattening sets in sooner for the PseudoBulge model (at τ∼ 4) than for the TrueBulge model (at τ∼ 6), because the bulge of the former is smaller in size and hence it reaches sooner the point where the part of the dust disc covering the bulge is completely optically thick.
The behaviours of the apparent effective radius Re and Sérsic index n are shown in the middle and bottom panels of Fig. 3, respectively. For the TrueBulge model, both parameters are generally decreasing functions of the optical depth. In addition, the corresponding curves also suggest to be flattening for large values of τ. The more erratic behaviour of the i= 60° curve, in this case, is likely due to the finite vertical thickness of the disc, which is not included in the budda fits. It thus suggests that, for i≳ 60°, fits using an infinitely thin disc, as those provided by budda, start to become unrealistic, since the effective thickness of the disc is becoming increasingly important.2 As a result, the bulge parameters are becoming more uncertain. For the PseudoBulge model, the behaviour is different: both the effective radius and the Sérsic index increase with increasing optical depth, reach a maximum value at τ∼ 0.2–0.5 and subsequently decrease for larger optical depths. Only the effective radius, from τ∼ 4, is roughly constant with increasing τ, although the curves concerning the Sérsic index also flatten for larger optical depths. It is also interesting to note how both the apparent effective radius and the apparent Sérsic index of the PseudoBulge model coincide at all inclinations when τ= 0.5.
The effect of dust extinction on bulge Sérsic index can be intuitively understood. Since the density in the dust disc is larger at its centre, the inner part of the bulge surface brightness profile is the most affected. Therefore, the peak in the centre of the bulge profile is reduced, leading to lower values of Sérsic index. The flattening of the curves concerning Re and n also seem to be related to the same effect leading to the flattening of the bulge attenuation curves. They set in at similar values of τ as the bulge attenuation curves, and also set in for lower values of τ in the PseudoBulge models, as compared to the TrueBulge models. What is not trivial to understand is the decrease in effective radius. This leads to a lower contribution from bulge light also in its outer region, where dust attenuation is small. Furthermore, it is also unclear why there is an increase in both Re and n, in the case of the PseudoBulge models, when τ goes from zero to ∼0.2–0.5. These points are discussed in more detail in the next section.
4 DISCUSSION
In the previous section, we have seen that the general behaviour of the apparent disc and bulge parameters with increasing optical depth can be understood in an intuitive way, but some results require a more in-depth discussion.
The disc component seems to brighten for moderate optical depths, at inclinations which are too far off face-on to explain this trend by scattering effects alone. Moreover, the disc brightening is stronger in the TrueBulge models than in the PseudoBulge models. Scattering effects alone would produce similar results, independent on bulge properties.
The apparent scalelength of the disc is systematically lower for the TrueBulge model, as compared with the PseudoBulge model, whereas the intrinsic scalelengths are identical.
The effective radius of the bulge decreases when dust effects become important. However, this leads to a deficit of bulge light in its outer region, where dust attenuation is small, as compared to the central region.
While both the effective radius and Sérsic index of the bulge generally decrease with increasing optical depths, they increase for small optical depths for the PseudoBulge models.
A plausible explanation for the non-trivial behaviour of these parameters as a function of optical depth is that they are the result of the complex interplay between the attenuation of the disc and the bulge, and its consequences on the 2D bulge/disc decompositions. It is important to realize that the parameters we study here result from simultaneous fits to the entire dust-affected image, i.e. to both bulge and disc at the same time. The apparent bulge parameters are not only affected by the direct attenuating presence of dust, but also indirectly by the effect of dust on the apparent disc parameters, and vice versa.
4.1 Disc attenuation
The dashed lines in the upper panels of Fig. 2 represent the actual disc attenuation as a function of τ, whereas the solid lines represent the apparent attenuation. We note in both cases the intriguing disc brightening, but this effect is only found for the more face-on inclinations when we consider the actual attenuation; further, the effect is identical in the TrueBulge and PseudoBulge models. It can be completely understood in terms of scattering effects (Byun et al. 1994; Baes & Dejonghe 2001b; Pierini et al. 2004). This confirms our previous argumentation that the apparent disc brightening (the solid lines) cannot be due to scattering effects alone.
Another difference between the solid and dashed lines is the strength of the attenuation: the apparent disc attenuation is significantly weaker than the actual attenuation at a given τ. In other words, the bulge/disc decomposition minimizes the attenuation of the disc. The reason for this difference stems from the different ways the inner and outer regions of the disc relate to the resulting apparent and actual attenuation. The outer regions give only a modest contribution to the total flux of the disc; the inner, dust-affected regions contribute much more significantly, and are mainly responsible for the general increase of the actual attenuation with increasing optical depth. On the other hand, it is the outer regions of the disc that have a relatively larger weight on the resulting apparent disc attenuation. In fact, when searching for the best disc model, budda naturally gives more weight to the outer disc, as compared to the inner disc, as the former occupies a much large number of pixels in the image.3 Furthermore, the outer surface brightness profile of the disc is hardly affected by dust. As a result, the outer regions will tend to push the fitted disc parameters to their optically thin value, in spite of the much larger attenuation at smaller radii, making the apparent attenuation weaker than the actual one. As we will discuss now, in order to compensate such discrepancy at small radii, the bulge model is affected in such a way that the bulge contribution to the total model is reduced.
4.2 Bulge attenuation
A direct consequence from the above is thus that the bulge parameters will be strongly affected. This is clear when we compare the solid and dashed lines in the top panels of Fig. 3, which represent the apparent and actual bulge attenuations, respectively. Clearly, the apparent bulge attenuation at a given optical depth is much stronger than the actual bulge attenuation, contrary to what happens with the disc apparent and actual attenuations. The magnitude of this difference is dependent on the inclination of the system and the type of bulge, but it typically amounts to a factor of 2 or more. This is completely in accordance with the previous observation that, in the bulge/disc decomposition, to account for the excess of light from the disc model in the galaxy inner region, the bulge model becomes less important. This explains why the effective radius of the bulge is also reduced as dust effects become important. Further, as a consequence, the bulge-to-disc luminosity ratio, as measured through the decompositions, can be significantly smaller than the corresponding ratio in the input, skirt models, at fixed optical depth and inclination (see Fig. 4).
Dependence of the bulge-to-disc ratio on the V-band optical depth τ. The solid lines represent the apparent bulge-to-disc ratio as derived from the budda bulge/disc decompositions of the dust-affected images. The dashed lines represent the actual bulge-to-disc ratio as determined from the ratio of the input bulge and disc integrated fluxes.
This effect arising from the bulge/disc decompositions also explains why the disc suffers more from dust effects in the PseudoBulge models, as compared to the TrueBulge models. Fig. 2 shows that the effects of dust on the apparent integrated disc attenuation and scalelength are more significant in the PseudoBulge models. What happens is that because the bulge in the PseudoBulge models is relatively small, it cannot be weakened so significantly, as the bulge in the TrueBulge models, to account for the reduced effects of dust in the disc. Therefore, the disc itself, in the PseudoBulge models, has to respond more substantially to the dust effects.
To better illustrate the effects of dust in the budda fits, we show in Fig. 5 the results from budda decompositions of two TrueBulge skirt models seen at a viewing angle i= 60°, with no dust (left-hand panels) and with a dust disc with τ= 4 (right-hand panels). While the effects of dust in the disc model obtained with budda are relatively weak – the disc central surface brightness gets slightly fainter and the disc scalelength slightly larger – such effects are strong in the corresponding bulge model, which has both its effective radius and Sérsic index significantly lowered, resulting in an underestimation of the true bulge-to-disc ratio. Furthermore, it is also notable that the budda fit is worse when dust effects are important, in particular at the central regions. In extreme cases, this could lead to the wrong conclusion that substructures are present.
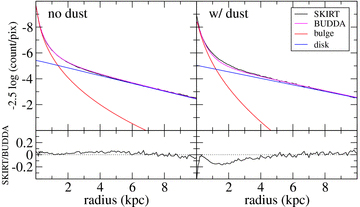
Results from budda decompositions of two TrueBulge skirt models seen at a viewing angle i= 60°, with no dust (left) and with a dust disc with τ= 4 (right). The surface brightness radial profiles of the skirt and total budda models are shown in the upper panels, as well as those of the bulge and disc individual budda models, as indicated. The lower panels show the residuals of the fits in magnitudes. One can clearly see how dust effects are more severe in the bulge model than in the disc model.
It is not clear, however, how the disc brightening seen above can happen at high inclinations, and why it is stronger in the TrueBulge models. We also do not have a clear answer to why, in the PseudoBulge models, the bulge effective radius and Sérsic index increase at small optical depths. Nevertheless, we suspect that both features are connected, and have an origin in the process of bulge/disc decomposition.
5 IMPLICATIONS
Our results indicate that, broadly speaking, when dust effects are important, disc scalelengths are being overestimated, and bulge effective radii and Sérsic indices and bulge-to-disc ratios underestimated, in studies of galaxy structure based on bulge/disc decomposition. The extent of the problem of course depends on galaxy inclination and dust opacity, and the latter is most of the times difficult to estimate. Furthermore, while dust effects might not be too significant on disc parameters, the impact on bulge parameters can be considerable. Finally, it is also worth mentioning that, for high opacities, dust effects might not be negligible even for galaxies seen face-on.
It is well known that dust attenuation in galaxies also depends strongly on the dust-star geometry (Disney, Davies & Phillipps 1989; Witt et al. 1992; Byun, Freeman & Kylafis 1994; Bianchi, Ferrara & Giovanardi 1996; Baes & Dejonghe 2001b). Applied to the particular case of spiral galaxies containing both a disc and a bulge component, it is not surprising that interstellar dust affects the bulge much stronger than the disc. The fact that bulges suffer more attenuation than discs has been demonstrated in detail by several authors (Pierini et al. 2004; Tuffs et al. 2004; Möllenhoff et al. 2006). Using radiative transfer calculations that investigate the effects of dust on the actual individual bulge and disc components, Tuffs et al. (2004) concluded that increasing the bulge-to-disc ratio at a constant opacity can mimic the effect of increasing the opacity of a pure disc. In general, ignoring the presence of bulges can lead to a systematic overestimate of the opacity of discs.
In the previous section, we have demonstrated that the actual and apparent attenuations of disc and bulge are indeed substantially different: the actual disc attenuation is modest (even negative for small optical depths due to scattering effects), whereas the actual bulge attenuation is much more pronounced. This differential extinction between bulge and disc leads to a general decrease of the bulge-to-disc ratio with increasing optical depth, as demonstrated with the dashed lines in Fig. 4. For the TrueBulge model, the actual bulge-to-disc ratio decreases some 10–15 per cent at an optical depth τ= 2, reaching a reduction of roughly 25 per cent at τ= 8. For the PseudoBulge model, with its smaller bulge buried deeper into the dusty central region, the actual bulge-to-disc ratio decrease is slightly stronger, being about 20 per cent at τ= 2 and 35 per cent at τ= 8.
While these numbers are significant, the actual extinction of bulge and disc light is not the dominant factor in the behaviour of the apparent bulge-to-disc ratio with increasing dust opacity. The solid lines in Fig. 4 represent the apparent bulge-to-disc ratio resulting from the 2D bulge/disc decomposition of the dust-affected images. It is important to stress that this measure, and not the actual bulge-to-disc ratio discussed previously, is the observable bulge-to-disc ratio measured in real galaxy images. These curves are the result of two corroborating effects: on the one hand the different actual attenuation of the individual bulge and disc components, and on the other hand the effect with origin in the process of bulge/disc decomposition, in which the bulge model is reduced in order to compensate for an excess of light in the central part of the disc model, which in the actual disc is dust-obscured. We have seen in the previous section that this effect tends to minimize the attenuation of the disc while it strongly overestimates the attenuation of the bulge. The result is that the apparent bulge-to-disc ratio is a stronger function of the optical depth than the actual bulge-to-disc ratio: even at relatively modest optical depths, τ= 1 and 2, the apparent bulge-to-disc ratio decreases by roughly 25 and 50 per cent (or bulge-to-total ratio decrements of roughly 15 and 33 per cent), respectively, for both the TrueBulge and PseudoBulge cases. Interestingly enough, also for both types of models, the apparent bulge-to-disc ratio becomes roughly constant for values of τ larger than 4. At this point, the underestimation of the bulge-to-disc ratio is about a factor of 3, which corresponds to an underestimation of the bulge-to-total ratio by a factor of 2. Such effect can have important consequences on studies of the black hole/bulge scaling relations in disc galaxies. Some such studies (see e.g. Bentz et al. 2009; Gültekin et al. 2009, and references therein) derive bulge luminosity or mass from the bulge-to-total ratio, which, as we have seen, can be substantially underestimated if dust attenuation is significant. This is likely to happen if the image used in the decomposition is obtained through a blue passband, or if the galaxy is seen edge-on. An artificial decrement in bulge-to-total ratio can result in an elevated measure of the scatter in such relations, and one thus has to be alert to that possibility.
Given the difficulties in determining dust opacities, we will not attempt to draw quantitative conclusions about the effects of dust on the outcome of observational work on the structural parameters of galaxy components through image decomposition. However, we note that, knowing the galaxy inclination, and assuming or estimating a value for τ, one can roughly assess in the figures presented above how the galaxy structural parameters are affected through 2D bulge/disc decomposition.
The biases produced by dust effects on the results from decompositions in studies with statistically large samples will depend on the spatial resolution of each object, as well as on details in the decomposition algorithm. Our results indicate that bulges which are better resolved will tend to suffer more from dust effects. In addition, the function used to describe the surface brightness radial profile of discs, and the weighting scheme used by the decomposition algorithm, also influence how dust affects the results. Using a broken exponential profile to fit discs, with the inner part flatter than the outer part, might alleviate biases caused by dust. This can also be achieved by giving more weight to pixels in the inner part of the disc, as compared to its outer part.4 One can devise more elaborated fitting functions or weighting schemes if the disc opacity can be evaluated by independent means, through e.g. measurements of dust emission and/or spectroscopic diagnostics. Thus, biases caused by dust have to be calibrated separately for each survey.
Since bulge prominence is an important structural property, connected to other important physical properties, one should be careful when assessing bulge-to-disc ratios (or bulge-to-total ratios) in cases where dust effects are expected to be significant. The results above show that the effects of dust on the measured structural parameters of bulges and discs can be different in galaxies hosting classical and pseudo-bulges, even if their dust content is the same. It might be thus fortunate that, when such effects are combined, they result in relative decrements in the bulge prominence which are quantitatively similar for both categories of galaxies.
6 SUMMARY AND CONCLUSIONS
We have created artificial galaxy images, using radiative transfer simulations, to mimic the observed structural properties of galaxies with classical and pseudo-bulges, and include the effects of dust attenuation in the observed light distribution. By applying 2D bulge/disc decomposition techniques in this set of models, we were able to evaluate what are the effects of galaxy inclination and dust opacity on the results from such decompositions.
We have found that the effects of dust on the structural parameters of bulges and discs obtained from 2D bulge/disc decomposition cannot be simply evaluated by putting together the effects of dust on properties of bulges and discs treated separately. The reason for that comes from the fact that such decompositions use specific models to fit bulges and discs which cannot accommodate the effects of a dust disc in the galaxy. Therefore, when the model for a component tries to adjust itself when dust is present, this has direct consequences on the model of the other component, even if the latter is not directly affected by dust. More specifically, we have found that the outer parts of the disc have more influence in setting the disc model in the 2D fits, as they occupy a larger number of pixels. However, this area of the disc suffers little from dust attenuation, and hence the disc parameters so obtained are not significantly affected by dust. This results from the fact that a simple exponential function is used to describe the light distribution in the disc. As a consequence, there will be an excess of light in the central parts of the disc, because dust attenuation is stronger there. Finally, to compensate such discrepancy in the central parts of the galaxy, the bulge model is reduced. A possible solution to such problem would thus be to use a broken exponential to fit the disc light distribution, with the inner part of such function being flatter than the outer part. Another possible solution is to use a pixel weighting scheme in the decomposition algorithm that compensates for the effects of dust.
We have found that, when dust effects are important, disc scalelengths are overestimated, bulge effective radii are underestimated and bulge Sérsic indices are also underestimated. Furthermore, the attenuation caused by dust in the integrated disc luminosity is underestimated, whereas the corresponding attenuation for the bulge is overestimated. This leads to a systematic underestimation of bulge-to-disc ratios. The extent to which these systematic effects are significant depend on galaxy inclination and dust opacity. The strongest effect is seen in the bulge-to-disc ratio, which can be underestimated by a factor of 2, in the V band, even considering relatively low inclinations and opacities. Nevertheless, we have also found that such parameter is never underestimated by factors larger than about 3, which corresponds to a factor of 2 in bulge-to-total ratio. Such effect can have an impact on studies of the black hole/bulge scaling relations.
By double-exponential disc, we mean a disc whose stellar/dust surface density varies exponentially in both the radial and vertical directions.
Note, however, that for edge-on galaxies, i.e. when i≈ 90°, budda provides a more realistic fit, using a disc model with finite vertical thickness.
The weighting scheme used in budda is such that each pixel is weighted by a function which is ∝1/N, where N is the number of counts in ADU at the pixel, i.e. inversely proportional to the absolute value of the Poisson noise (variance) in the pixel. This too tends to put more weight on the outer parts of galaxies, since pixels there have generally lower counts.
Note, however, that different weighting schemes can introduce other sorts of biases (see discussion in Laurikainen et al. 2005).
We are grateful to Daniele Pierini for reading our manuscript and providing insightful comments. We thank an anonymous referee for several comments that helped to improve our paper. DAG is supported by the Deutsche Forschungsgemeinschaft priority program 1177 (‘Witnesses of Cosmic History: Formation and evolution of galaxies, black holes and their environment’), and the Max Planck Society. MB and SF gratefully acknowledge the financial support of the Fonds voor Wetenschappelijk Onderzoek Vlaanderen (FWO-Vlaanderen).
REFERENCES
Appendix
APPENDIX A: SÉRSIC MODELS IN skirt
The surface brightness profiles of bulges in spiral galaxies can generally be represented as Sérsic models, a convention that is followed in this paper. One problem with the Sérsic models is that the deprojection of a Sérsic surface brightness profile to a volume emissivity ν(r) is in general non-analytic and that it is singular at the centre. In practice, one often uses approximations for the Sérsic models when the volume emissivity is necessary (e.g. Prugniel & Simien 1997; Lima Neto, Gerbal & Márquez 1999; Trujillo et al. 2002). Since we model the projected images of our skirt models with exact Sérsic models, it is important that the correct, i.e. exact, volume emissivity of the Sérsic models are adopted in this case.
 is the total luminosity of the system. For a spherically symmetric model, such as we have assumed here, generating a random position r= (r, θ, φ) comes down to generating a random direction (θ, φ) on the unit sphere and a random radius r from the probability distribution
