


Abstract
In previous works, the nearby galaxy cluster Abell 3158 was reported to possess a relatively regular, relaxed morphology in the X-ray band. By analysing the Chandra and XMM–Newton archived data of Abell 3158, we have identified a bow-edge-shaped discontinuity in the X-ray surface brightness distribution about 120 h−171 kpc west of the X-ray peak. This feature is found to be associated with a massive, off-centre cool gas clump, and actually forms the west boundary of the cool clump. By calculating the thermal gas pressures in the cool clump and in the free-stream region, we determine that the cool gas clump is moving at a subsonic velocity of 700+140−340 km s−1 (M= 0.6+0.1−0.3) towards west on the sky plane. We exclude the possibility that this cool clump was formed by local inhomogeneous radiative cooling in the intracluster medium, because of the effectiveness of the thermal conduction on the time-scale of ∼0.3 Gyr. As no evidence for central active galactic nucleus activity has been found in Abell 3158, and this cool clump bears many similarities to the off-centre cool gas clumps detected in other merging clusters in terms of their mass, size, location and thermal properties (e.g. lower temperature and higher abundance as compared with the environment), we speculate that the cool clump in Abell 3158 was caused by a merger event, and is the remnant of the original central cool-core of the main cluster or the infalling subcluster. This idea is supported not only by the study of the line-of-sight velocity distribution of the cluster member galaxies, but also by the study of the gas entropy–temperature correlation. This example shows that the appearance of such massive, off-centre cool gas clumps can be used to diagnose the dynamical state of a cluster, especially when prominent shocks and cold fronts are absent.
1 INTRODUCTION
In the hierarchical clustering scenario, galaxy clusters grow in size by merging with subunits, with each major merger event lasting for 2–5 Gyr (e.g. Roettiger, Loken & Burns 1997; Ascasibar & Markevitch 2006; Poole et al. 2006). In such major mergers, both ram pressure stripping and slingshot can generate remarkable X-ray substructures in gas density and temperature distributions. These are often accompanied by shocks and/or cold fronts, which exhibit arc-shaped or edge-like morphologies (e.g. Markevitch & Vikhlinin 2007 and references therein). These substructures are expected to contain valuable information not only on the merger dynamics itself, but also on the thermal and chemical evolutions of the hot intracluster medium (ICM). This can help us to understand the nature of dark matter (Markevitch et al. 2004; Randall et al. 2008).
Theoretical studies and numerical N-body simulations (e.g. Roettiger et al. 1997; Ricker 1998; Poole et al. 2006) have shown that in a typical major merger event, temperature substructures may survive for the relatively long time of tthermal≃ngaskT/n2gasΛ, where ngas, T and Λ are the gas density, temperature and cooling function, respectively. The derived tthermal (up to about 4 Gyr in some cases) is much longer than the lifetimes of shocks and cold fronts, as shocks and cold fronts are usually smeared out quickly on dynamic time-scales characterized by the sound crossing time. Actually, high-quality Chandra and XMM–Newton observations have shown that in merging clusters there is a prevailing existence of massive, off-centre cool gas clumps. These are about 50–300 kpc in size, reside within the central (≲600 kpc) region of the cluster, and possess an average temperature 1–4 keV lower than the ambient gas.
In 1E 0657–56 (the Bullet cluster; Markevitch et al. 2002), Abell 520 (Govoni et al. 2004), Abell 2256 (Sun et al. 2002) and Abell 3667 (Vikhlinin, Markevitch & Murray 2001), the off-centre cool gas clump is found to be moving adiabatically behind a bow shock and/or a cold front. Thus, it can be directly identified as the remnant of the original central cool-core of the infalling subcluster. However, in clusters such as Abell 754 (Markevitch et al. 2003), Abell 2065 (Chatzikos, Sarazin & Kempner 2006) and Abell 2255 (Sakelliou & Ponman 2006), the off-centre cool gas clump is not escorted by either a shock or a cold front. However, unambiguous evidence obtained in radio, optical and X-ray bands still indicates that the cool gas clump was driven out of the core region of either the main cluster (Abell 754; Markevitch et al. 2003; Henry, Finoguenov & Briel 2004) or the infalling subcluster by the merger.
In fact, the off-centre cool gas clumps in the above two types of cluster share many similarities in terms of their sizes, locations and gas masses (∼1011 M⊙). Therefore, an interesting question arises: can the appearance of such massive, off-centre cool gas clumps be safely used to diagnose the dynamical state of a cluster, even when there is a lack of violent merger signatures, such as prominent shocks, cold fronts and other associated radio/optical substructures? Clearly, in order to address this issue, we need to examine the gas temperature distribution in more galaxy clusters that show only weak merger signatures and have evolved into late merger stages (usually mean post-core passages).
In this paper, we present a detailed joint Chandra and XMM–Newton study of the nearby rich galaxy cluster Abell 3158 (richness class 2, Quintana & Havlen 1979; z= 0.0597, Struble & Rood 1999), which contains 105 member galaxies within the central 2.4 h−171 Mpc (Biviano et al. 2002). In the literature (e.g. Irwin, Bregman & Evrard 1999; Łokas et al. 2006; Chen et al. 2007), this cluster is usually referred to as a relaxed, non-cool-core system, because neither significant X-ray substructures nor diffuse radio emission have been reported in previous works (Ku et al. 1983; Mohr, Mathiesen & Evrard 1999; Schuecker et al. 2001; Mauch et al. 2003). In the optical band, however, the cluster shows some unusual properties, which could possibly be related to a recent merger event. These are summarized as follows. First, the cluster hosts three luminous elliptical galaxies that are brighter than 9 × 10¹⁰ LB,⊙ (Paturel et al. 2003), all classified as central dominant (cD) galaxies by Sérsic (1974). Two of these, the brightest member PGC 13641 (E0, LB= 1.45 × 10¹¹ LB,⊙) and the S0 galaxy PGC 13652 (LB= 9.39 × 10¹⁰ LB,⊙), constitute a closely aligned central galaxy pair, whose projected separation is 81.3 h−171 kpc, and jointly dominate the cluster (Quintana & Havlen 1979). The second luminous member PGC 13679 (S0, LB= 9.48 × 10¹⁰ LB,⊙) is located at about 417.8 h−171 kpc south-east of the central galaxy pair, and dominates a local subcluster whose recessional velocity is about 1300 km s−1 larger than the mean recessional velocity of the main cluster (17 500 km s−1; Lucey et al. 1983; Kolokotronis et al. 2001). Secondly, as shown in fig. 7 of Smith et al. (2004), the line-of-sight velocity distribution of the cluster's member galaxies exhibits a plateau at the high-velocity end, which is often seen in merging systems. Thirdly, Kolokotronis et al. (2001) have reported that, in this cluster, there is an offset of about 200 h−171 kpc between the optical flux-weighted centroid and the optical density peak. Based on these properties, we speculate that Abell 3158 is evolving at a late merger stage and is thus an ideal target for our investigation.
Throughout the paper, we adopt the cosmological parameters H0= 71 km s−1 Mpc−1, ΩM= 0.27 and ΩΛ= 0.73, so that 1 arcsec corresponds to about 1.14 h−171 kpc at the redshift of the cluster. We utilize the solar abundance standards given by Grevesse & Sauval (1998), where the iron abundance relative to hydrogen is 3.16 × 10⁻⁵ in number. Unless stated otherwise, the quoted errors are the 90 per cent confidence limits.
2 OBSERVATIONS AND DATA REDUCTIONS
2.1 Chandra
Except for an extremely short exposure on 2007 September 16 (5.1 ks, ObsID 7688), which is not used in this work, Abell 3158 has also been observed with Chandra on 2002 June 19 (31.4 ks, ObsID 3712) and June 21 (25.1 ks, ObsID 3201), respectively, with chips 0, 1, 2, 3 and 6 of the Advanced CCD Imaging Spectrometer (ACIS) operating in vfaint mode. We used the Chandra data analysis package ciao version 4.1 and caldb version 4.1.2 to process the archived data in the standard way, by starting with the level 1 event files. Corrections for the charge transfer inefficiency and time-dependent gain have been applied. We kept events with ASCA grades 0, 2, 3, 4 and 6, and removed all the bad pixels, bad columns and columns adjacent to bad columns and node boundaries. We examined the 0.3–10.0 keV light curves extracted from the background regions defined on ACIS chips 0 and 1, and we found that there are no strong flares that increase the background count rate to >120 per cent of the mean quiescent value. The obtained net exposures are 30.9 and 24.8 ks for the two observations, respectively. In the spectral analysis, we extracted the Chandra spectra in 0.7–8.0 keV from the two observations separately, and fitted them simultaneously with the same model, except that their normalizations were left free. Background spectra were extracted from the Chandra blank-sky fields; a cross-check based on the use of local background yielded essentially the same results.
2.2 XMM–Newton
Abell 3158 was observed with XMM–Newton on 2005 November 22 (22.4 ks, ObsID 0300210201) and 2006 January 18 (9.4 ks, ObsID 0300211301), respectively, with the European Photon Imaging Camera (EPIC) operating in PrimeFullWindow (MOS1 and MOS2) and PrimeFullWindowExtended (pn) modes. Although during the second observation the Reflection Grating Spectrometer (RGS) was also turned on, in this work we limited our analysis to the first observation only by using the latest version of sas (version 8.0.1) and its standard filterings. We kept the events with flag= 0 and patterns 0–12 for MOS1 and MOS2, and the events with flag= 0 and patterns 0–4 for pn. We removed all the time intervals contaminated by soft proton flares, during which the 10–12 keV count rate exceeds the 2σ limit of the mean quiescent value (see, for example, Katayama et al. 2004). The cleaned MOS1, MOS2 and pn data sets have effective exposure times of 20.9, 20.6 and 12.2 ks, respectively. In the spectral analysis, we removed all the bright X-ray point sources and adopted conservative energy cuts at 0.5 and 8.0 keV. The obtained MOS1, MOS2 and pn spectra were fitted simultaneously using the same model, except that their normalizations were left free. Background spectra were generated from the blank-sky event lists, which were filtered in advance using the same selection criteria (pattern, flag, etc.) as used for the source spectra.
3 X-RAY ANALYSIS AND RESULTS
3.1 X-ray surface brightness discontinuity
In Figs 1(a) and (b), we show the Chandra ACIS and combined XMM–Newton EPIC images of the central 1.5 × 1.5 h−171 Mpc2 (21.9 × 21.9 arcmin2) region of Abell 3158 in 0.3–2.0 keV, respectively. These have been adaptively smoothed and corrected for both exposure and vignetting. The XMM–Newton image was generated by combining the MOS1, MOS2 and PN events together, using the sas‘image’ script. The X-ray peak of the cluster ( J2000) is found at about 17.8 h−171 kpc (0.26 arcmin) north-west of the optical centroid of PGC 13641 (
 ; Katgert et al. 1998), the brighter member of the central galaxy pair. The corresponding optical Digital Sky Survey (DSS) image is shown in Fig. 1(c), on which the Chandra intensity contours obtained from Fig. 1(a) are overlaid.
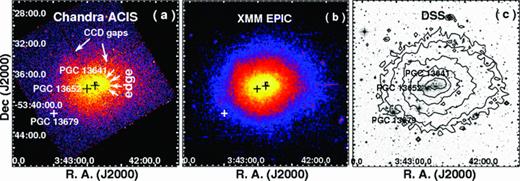
Adaptively smoothed and exposure-corrected (a) Chandra ACIS-I (ObsID 3712) and (b) XMM–Newton EPIC (ObsID 0300210201) images of the central 1.5 × 1.5 h−171 Mpc2 (21.93 × 21.93 arcmin2) region of Abell 3158. Both images are extracted in 0.3–2.0 keV and plotted in logarithmic scale. One small box and three crosses are used to mark the peak of the X-ray halo and the centres of luminous member galaxies PGC 13641, PGC 13652 and PGC 13679, respectively. (c) Optical DSS B-band image for the same sky field as (a) and (b), on which the Chandra X-ray intensity contours (square-root scale) are plotted.
On both Chandra and XMM–Newton images it can be clearly seen that the X-ray isophotes are elongated in nearly the east–west direction with an ellipticity of ≃0.3. Also, on the Chandra image a bow edge can be identified at about 120 h−171 kpc (1.88 arcmin) west of the X-ray peak. According to its shape and location on the detector, the possibility of the feature being associated with the artefacts caused by CCD gaps or bad columns can be excluded.
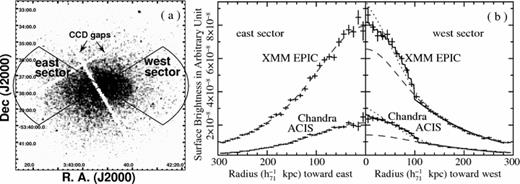
(a) East and west sector regions used to extract the X-ray SBPs, which are shown in (b). Here, the Chandra ACIS image is used as the background image. (b) Chandra ACIS and XMM–Newton EPIC 0.3–2.0 keV SBPs extracted from the partial elliptical annuli defined in the two sector regions. For SBPs extracted in the east sector, a single β model can give an acceptable fit to the observed SBPs (dashed lines; Section 3.1 and Table 1). For SBPs extracted in the west sector, dashed, dotted and solid lines are used to show the best fits obtained with the single β model (Section 3.1), two-β model and truncated power-law +β model (Section 3.3 and Table 1), respectively.
| East sectora | ||||||||
| Model | Data | S0 (cnts cm−2 s−1 arcsec−2) | β | rc (h−171 kpc) | – | – | – | χ2/dof |
| Single β | Chandra | 8.85 ± 0.26 × 10⁻⁸ | 0.73 ± 0.02 | 197.2 ± 5.4 | – | – | – | 28.5/27 |
| Single β | XMM | 7.94 ± 0.07 × 10⁻⁸ | 0.74 ± 0.02 | 187.0 ± 1.8 | – | – | – | 41.9/27 |
| West sectorb | ||||||||
| Model | Data | ng,1 (10−3 cm−3) | β1(α) | Rc1(Rcut) (h−171 kpc) | ng,2 (10−3 cm−3) | β2 | Rc2 (h−171 kpc) | χ2/dof |
| A | Chandra | 3.95 ± 0.12 | 4.50 ± 0.12 | 243.1 ± 4.0 | 2.60 ± 0.04 | 0.54 ± 0.01 | 257.2 ± 2.3 | 115.1/15 |
| A | XMM | 2.90 ± 0.06 | 2.88 ± 0.06 | 209.1 ± 4.0 | 3.08 ± 0.04 | 0.50 ± 0.01 | 182.3 ± 1.2 | 72.5/24 |
| B | Chandra | 4.51 ± 0.09 | 0.07 ± 0.04 | 111.0 ± 4.4 | 3.16 ± 0.05 | 0.63 ± 0.01 | 238.9 ± 3.3 | 20.7/15 |
| B | XMM | 4.72 ± 0.08 | 0.03 ± 0.03 | 104.9 ± 2.2 | 3.92 ± 0.05 | 0.66 ± 0.01 | 200.0 ± 2.1 | 33.5/24 |
a A single β model is sufficient for fitting the SBPs extracted in the east sector (Section 3.1).
b Best-fitting deprojected spectral parameters obtained in Section 3.2 (see also Table 2 and Fig. 4e) and two gas density models [Section 3.3; model A =β component +β component (equation 3); model B = truncated power-law component + truncated β component (equation 4)] are used to fit the Chandra and XMM–Newton profiles extracted in the west sector.
| East sectora | ||||||||
| Model | Data | S0 (cnts cm−2 s−1 arcsec−2) | β | rc (h−171 kpc) | – | – | – | χ2/dof |
| Single β | Chandra | 8.85 ± 0.26 × 10⁻⁸ | 0.73 ± 0.02 | 197.2 ± 5.4 | – | – | – | 28.5/27 |
| Single β | XMM | 7.94 ± 0.07 × 10⁻⁸ | 0.74 ± 0.02 | 187.0 ± 1.8 | – | – | – | 41.9/27 |
| West sectorb | ||||||||
| Model | Data | ng,1 (10−3 cm−3) | β1(α) | Rc1(Rcut) (h−171 kpc) | ng,2 (10−3 cm−3) | β2 | Rc2 (h−171 kpc) | χ2/dof |
| A | Chandra | 3.95 ± 0.12 | 4.50 ± 0.12 | 243.1 ± 4.0 | 2.60 ± 0.04 | 0.54 ± 0.01 | 257.2 ± 2.3 | 115.1/15 |
| A | XMM | 2.90 ± 0.06 | 2.88 ± 0.06 | 209.1 ± 4.0 | 3.08 ± 0.04 | 0.50 ± 0.01 | 182.3 ± 1.2 | 72.5/24 |
| B | Chandra | 4.51 ± 0.09 | 0.07 ± 0.04 | 111.0 ± 4.4 | 3.16 ± 0.05 | 0.63 ± 0.01 | 238.9 ± 3.3 | 20.7/15 |
| B | XMM | 4.72 ± 0.08 | 0.03 ± 0.03 | 104.9 ± 2.2 | 3.92 ± 0.05 | 0.66 ± 0.01 | 200.0 ± 2.1 | 33.5/24 |
a A single β model is sufficient for fitting the SBPs extracted in the east sector (Section 3.1).
b Best-fitting deprojected spectral parameters obtained in Section 3.2 (see also Table 2 and Fig. 4e) and two gas density models [Section 3.3; model A =β component +β component (equation 3); model B = truncated power-law component + truncated β component (equation 4)] are used to fit the Chandra and XMM–Newton profiles extracted in the west sector.
3.2 An unusual off-centre cool gas clump
 is the distance between r and the centre of the cell i, s(ri) is defined as the radius of cell i and
  is the Gaussian kernel with a scale parameter σ=s(ri). The obtained temperature map and the 1σ error map, which is calculated in nearly the same way as the temperature map, are shown in Figs 3(a) and (b), respectively.
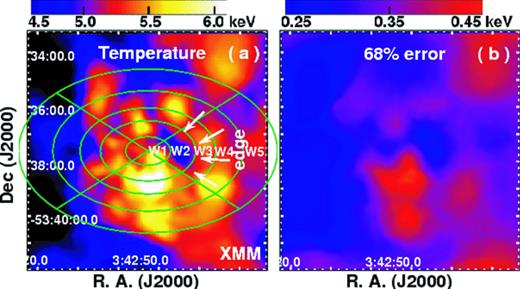
(a) Projected gas temperature map for the central 0.6 × 0.6 h−171 Mpc2 (8.77 × 8.77 arcmin2) region, along with the 68 per cent error map (b). These are calculated from the XMM–Newton MOS1+MOS2+pn data. Partial elliptical annuli defined in the north, east, south and west sector regions are shown in (a), which are used to extract both the Chandra and XMM–Newton spectra analysed in Section 3.2.
Despite the relatively regular appearance of the X-ray images (Fig. 1), we find that the spectral distribution of the projected gas temperature is highly asymmetric, inferring that the cluster has not recovered from a violent event on cluster scales. In particular, we find that there exists a cool gas clump at about 84 h−171 kpc (1.23 arcmin) west of the X-ray peak, whose linear scale is about 80 h−171 kpc (1.17 arcmin). The projected gas temperature within this cool clump ranges from about 4.4 to 5.0 keV, which is apparently lower than that of the ambient gas (5.2–6.0 keV). Most interestingly, the west boundary of the cool gas clump coincides with the bow edge perfectly, indicating that they are likely to have the same origin.
To clarify the significance of the existence of the cool gas clump, we define four sector regions in Fig. 3(a), two of which have the same angles as those defined earlier in Fig. 2(a). We divide each of these sector regions into a series of wider partial elliptical annuli. We extract both the Chandra ACIS and XMM–Newton MOS1, MOS2 and pn spectra from these annuli. We fit these with an absorbed apec model when the redshift and absorption are fixed again as above; allowing the absorption to vary does not improve the fits. In the fittings, the Chandra ACIS spectra extracted from the two observations are treated as group one, and the XMM–Newton MOS1, MOS2 and pn spectra are treated as group two. Each group of spectra is fitted simultaneously with the same model parameters, except that the normalizations are left free. The derived projected temperature profiles in the four sectors are plotted in Figs 4(a)–(d). It can be clearly seen that the Chandra and XMM–Newton temperatures are consistent with each other (68 per cent confidence level), and in the west sector the temperature in 45.4– 95.3 h−171 kpc (4.85 ± 0.17 keV), where the cool gas clump is located, is lower than those of the adjacent regions at 68 per cent confidence level (see also Table 2); no such temperature drop is found in the other three directions. This is further confirmed by the results of the deprojected analysis of the XMM–Newton spectra for the west sector (Table 2 and Figs 4e and f), which shows that the gas temperature of the cool gas clump (3.98+0.43−0.41 keV for the W2 region) is actually lower than those of the innermost region (5.71+1.04−0.71 keV for the W1 region) and the next outer region (5.38+0.74−0.51 keV for the W3 region) at the 90 per cent confidence level, and cannot be ascribed to the uncertainties in determining the metal abundance.
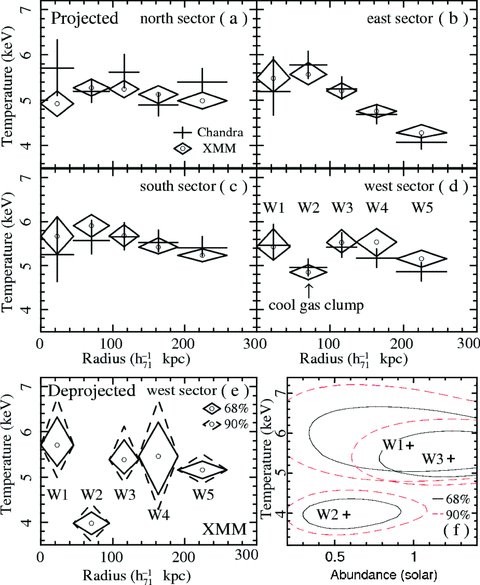
Projected gas temperature profiles obtained with Chandra ACIS (cross) and XMM–Newton MOS1+MOS2+pn (diamond) data for the (a) north, (b) east, (c) south and (d) west sectors defined in Fig. 3(a), along with the 68 per cent errors. (e) Deprojected XMM–Newton temperature profiles for the west sector, along with the 68 per cent (solid) and 90 per cent (dashed) errors (see also Table 2). (f) Fit-statistic contours of temperature and abundance at the 68 per cent (Δχ2= 2.30; solid) and 90 per cent (Δχ2= 4.61; dashed) confidence levels for the inner three partial annuli of the west sector, all obtained in the XMM–Newton deprojected analysis.
Gas temperature and abundance distributions in the west sector region.
| Regiona | Radiusb (h−171 kpc) | Data | kT (keV) | Z (Z⊙) | χ2/dof |
| Projectedc | |||||
| W1 | 0.0−45.4 | Chandra | 5.46+0.48−0.31 | 0.75+0.27−0.25 | 119.2/124 |
| XMM | 5.43+0.41−0.30 | 0.90+0.43−0.27 | 124.7/120 | ||
| W2 | 45.4−95.3 | Chandra | 4.96+0.19−0.19 | 0.69+0.14−0.14 | 199.2/206 |
| XMM | 4.85+0.17−0.17 | 0.81+0.13−0.13 | 192.5/207 | ||
| W3 | 95.3−136.1 | Chandra | 5.42+0.33−0.23 | 0.78+0.19−0.18 | 229.4/205 |
| XMM | 5.53+0.29−0.23 | 0.93+0.18−0.17 | 166.2/165 | ||
| W4 | 136.1−190.5 | Chandra | 5.17+0.21−0.21 | 0.69+0.15−0.14 | 212.9/206 |
| XMM | 5.54+0.30−0.32 | 0.48+0.14−0.14 | 187.6/187 | ||
| W5 | 190.5−258.5 | Chandra | 4.86+0.21−0.21 | 0.58+0.15−0.14 | 163.5/126 |
| XMM | 5.16+0.19−0.19 | 0.63+0.14−0.13 | 195.5/216 | ||
| Deprojectedd | |||||
| W1 | 0.0−45.4 | XMM | 5.71+1.04−0.71 | 0.99+0.87−0.70 | 896.3/893 |
| W2 | 45.4−95.3 | XMM | 3.98+0.43−0.41 | 0.58+0.37−0.31 | – |
| W3 | 95.3−136.1 | XMM | 5.38+0.74−0.51 | 1.24+0.59−0.50 | – |
| W4 | 136.1−190.5 | XMM | 5.46+1.24−1.17 | 0.02+0.53−0.02 | – |
a We divide the west sector region into wider partial elliptical annuli (i.e. W1–W5 regions; Fig. 3a).
b Equivalent inner and outer radii for each partial elliptical annulus, which are defined as  , where a and b are the corresponding semimajor and semiminor axes, respectively.
c An absorbed apec model is used to fit the Chandra ACIS and XMM–Newton MOS1+MOS2+pn spectra extracted in the W1–W5 regions. The redshift and absorption are fixed to z= 0.0597 and the Galactic value NH= 1.62 × 1020 cm−2 (Dickey & Lockman 1990), respectively. Errors are quoted at the 68 per cent confidence.
d The projct model coded in xspec v12.4.0 is used to deproject the XMM–Newton MOS1+MOS2+pn spectra. Errors are quoted at the 90 per cent confidence level.
Gas temperature and abundance distributions in the west sector region.
| Regiona | Radiusb (h−171 kpc) | Data | kT (keV) | Z (Z⊙) | χ2/dof |
| Projectedc | |||||
| W1 | 0.0−45.4 | Chandra | 5.46+0.48−0.31 | 0.75+0.27−0.25 | 119.2/124 |
| XMM | 5.43+0.41−0.30 | 0.90+0.43−0.27 | 124.7/120 | ||
| W2 | 45.4−95.3 | Chandra | 4.96+0.19−0.19 | 0.69+0.14−0.14 | 199.2/206 |
| XMM | 4.85+0.17−0.17 | 0.81+0.13−0.13 | 192.5/207 | ||
| W3 | 95.3−136.1 | Chandra | 5.42+0.33−0.23 | 0.78+0.19−0.18 | 229.4/205 |
| XMM | 5.53+0.29−0.23 | 0.93+0.18−0.17 | 166.2/165 | ||
| W4 | 136.1−190.5 | Chandra | 5.17+0.21−0.21 | 0.69+0.15−0.14 | 212.9/206 |
| XMM | 5.54+0.30−0.32 | 0.48+0.14−0.14 | 187.6/187 | ||
| W5 | 190.5−258.5 | Chandra | 4.86+0.21−0.21 | 0.58+0.15−0.14 | 163.5/126 |
| XMM | 5.16+0.19−0.19 | 0.63+0.14−0.13 | 195.5/216 | ||
| Deprojectedd | |||||
| W1 | 0.0−45.4 | XMM | 5.71+1.04−0.71 | 0.99+0.87−0.70 | 896.3/893 |
| W2 | 45.4−95.3 | XMM | 3.98+0.43−0.41 | 0.58+0.37−0.31 | – |
| W3 | 95.3−136.1 | XMM | 5.38+0.74−0.51 | 1.24+0.59−0.50 | – |
| W4 | 136.1−190.5 | XMM | 5.46+1.24−1.17 | 0.02+0.53−0.02 | – |
| Regiona | Radiusb (h−171 kpc) | Data | kT (keV) | Z (Z⊙) | χ2/dof |
| Projectedc | |||||
| W1 | 0.0−45.4 | Chandra | 5.46+0.48−0.31 | 0.75+0.27−0.25 | 119.2/124 |
| XMM | 5.43+0.41−0.30 | 0.90+0.43−0.27 | 124.7/120 | ||
| W2 | 45.4−95.3 | Chandra | 4.96+0.19−0.19 | 0.69+0.14−0.14 | 199.2/206 |
| XMM | 4.85+0.17−0.17 | 0.81+0.13−0.13 | 192.5/207 | ||
| W3 | 95.3−136.1 | Chandra | 5.42+0.33−0.23 | 0.78+0.19−0.18 | 229.4/205 |
| XMM | 5.53+0.29−0.23 | 0.93+0.18−0.17 | 166.2/165 | ||
| W4 | 136.1−190.5 | Chandra | 5.17+0.21−0.21 | 0.69+0.15−0.14 | 212.9/206 |
| XMM | 5.54+0.30−0.32 | 0.48+0.14−0.14 | 187.6/187 | ||
| W5 | 190.5−258.5 | Chandra | 4.86+0.21−0.21 | 0.58+0.15−0.14 | 163.5/126 |
| XMM | 5.16+0.19−0.19 | 0.63+0.14−0.13 | 195.5/216 | ||
| Deprojectedd | |||||
| W1 | 0.0−45.4 | XMM | 5.71+1.04−0.71 | 0.99+0.87−0.70 | 896.3/893 |
| W2 | 45.4−95.3 | XMM | 3.98+0.43−0.41 | 0.58+0.37−0.31 | – |
| W3 | 95.3−136.1 | XMM | 5.38+0.74−0.51 | 1.24+0.59−0.50 | – |
| W4 | 136.1−190.5 | XMM | 5.46+1.24−1.17 | 0.02+0.53−0.02 | – |
a We divide the west sector region into wider partial elliptical annuli (i.e. W1–W5 regions; Fig. 3a).
b Equivalent inner and outer radii for each partial elliptical annulus, which are defined as , where a and b are the corresponding semimajor and semiminor axes, respectively.
c An absorbed apec model is used to fit the Chandra ACIS and XMM–Newton MOS1+MOS2+pn spectra extracted in the W1–W5 regions. The redshift and absorption are fixed to z= 0.0597 and the Galactic value NH= 1.62 × 1020 cm−2 (Dickey & Lockman 1990), respectively. Errors are quoted at the 68 per cent confidence.
d The projct model coded in xspec v12.4.0 is used to deproject the XMM–Newton MOS1+MOS2+pn spectra. Errors are quoted at the 90 per cent confidence level.
3.3 Faint cold front associated with the cool gas clump
Following Vikhlinin et al. (2001), we use the best-fitting gas densities across the edge (equation 4) and gas temperatures for the W2 and W3 regions (Section 3.2 and Fig. 4e) to calculate the thermal gas pressures in the cool gas clump (P0) and in the free-stream region (P1), respectively. The former pressure is assumed to be in pressure equilibrium with the gas pressure at the stagnation point (denoted as the place where the relative gas velocity vanishes). The pressure ratio is estimated to be P0/P1= 1.3 ± 0.2 (68 per cent confidence level). This allows us to determine the Mach number (M) of the cool clump to be 0.6+0.1−0.3, which corresponds to a velocity of 700+140−340 km s−1. This subsonic velocity of the clump, along with the results obtained in Section 3.1 (i.e. surface brightness discontinuity) and Section 3.2 (i.e. gas temperature and density discontinuities), allows us to conclude that there exists a faint cold front at the west boundary of the cool gas clump.
4 VELOCITY PLATEAU
In the earlier works of Biviano et al. (1997, 2002), Girardi et al. (1996) and Kolokotronis et al. (2001), both the two-dimensional spatial distribution and the line-of-sight velocity distribution of the member galaxies in Abell 3158 were studied, and no significant substructure was reported. However, after a tighter and more reliable selection criterion for member galaxies, based on the galaxy colour–magnitude relation (e.g. Colless & Dunn 1996; Ferrari et al. 2003; Maurogordato et al. 2008), was applied, Smith et al. (2004) reconstructed the line-of-sight velocity distribution with higher fidelity and found that there exists a visible plateau beyond the Gaussian distribution at the high-velocity side. Because Smith et al. (2004) did not use a quantitative approach to assess the significance of the high-velocity plateau, in which the merger information might be contained, here we draw the velocity data of the member galaxies in Abell 3158 from Smith et al. (2004), and re-analyse the line-of-sight velocity distribution profile. After the model fitting of this distribution is finished, we also attempt to investigate the two-dimensional spatial distribution of the galaxies in the high-velocity plateau.
First, we plot the line-of-sight velocity distribution of the 68 member galaxies identified by Smith et al. (2004) in Fig. 5(a), which shows that the high-velocity plateau is located at about 19 000 km s−1. We fit the observed distribution with a single Gaussian profile, and calculate the Kolmogorov–Smirnov statistic for the observed distribution against the best-fitting Gaussian model (χ2/dof = 31.6/9). We find that the observed distribution has a probability of <10 per cent of being Gaussian. We then attempt to fit the observed distribution with a two-Gaussian model. The best fit (χ2/dof = 9.8/6) gives an average velocity of 〈v1〉= 17 380 ± 50 km s−1 and a corresponding variance of σv,1= 520 ± 50 km s−1 for the main Gaussian component, and 〈v2〉= 19 120 ± 130 km s−1 and σv,2= 510 ± 100 km s−1 for the high-velocity plateau. By applying the F-test and the Kaye Mixture Model (KMM; McLachlan & Basford 1988; Ashman, Bird & Zepf 1994) test, the latter of which is based on a maximum likelihood algorithm, we find that the second Gaussian component is required at 94.3 per cent confidence level and preferred at a significant probability of 90 per cent, respectively.
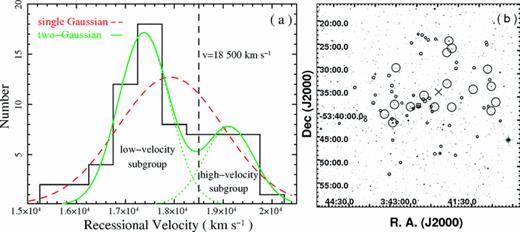
(a) Line-of-sight velocity distribution of 68 member galaxies identified in Abell 3158. The original velocity data are drawn from Smith et al. (2004). The distribution is fitted with a two-Gaussian model (solid) and a single Gaussian model (dashed; Section 4), respectively. (b) DSS optical image for the central 3.0 × 3.0 h−171 Mpc2 (43.86 × 43.86 arcmin2) region of Abell 3158, where the low-velocity (v < 18 500 km s−1) and high-velocity (v > 18 500 km s−1) member galaxies are marked with small and large circles, respectively. The X-ray peak is marked with a small box and the geometric centroid of the high-velocity subgroup is marked with a cross.
To investigate if the galaxies in the high-velocity plateau form a real substructure in the cluster, we divide the member galaxies into two subgroups: one low-velocity (15 300–18 500 km s−1) subgroup and one high-velocity (18 500–20 000 km s−1) subgroup, which consist of 51 and 17 galaxies, respectively. According to the best-fitting two-Gaussian model, these two subgroups roughly correspond to the two Gaussian components, respectively, with up to about two of the galaxies in the high-velocity subgroup coming from the main Gaussian component. We find that the galaxies belonging to the high-velocity subgroup are distributed mostly in the central 500 h−171 kpc (7.3 arcmin), as well as the west part of the cluster. There is a geometric centroid of the high-velocity galaxies located at about 355 h−171 kpc (5.2 arcmin) north-west of the X-ray peak, which is not coincident with any X-ray substructures or luminous member galaxies. The high-velocity subgroup roughly includes the member galaxies of the PGC 13679 subcluster, as the member galaxies and the boundary of the latter are difficult to determine by two-dimensional spatial distribution alone (e.g. Colless & Dunn 1996; Boschin et al. 2006). The galaxies in the low-velocity subgroup that is dominated by the central PGC 13641–PGC 13652 galaxy pair, however, are scattered symmetrically in the field. These results suggest that the galaxy velocity separation (Fig. 5a; see also Smith et al. 2004) has a dynamical nature, which is most likely to be a major merger, with a merger mass ratio of about 1: 1–3, as estimated from the velocity variance ratio (σv,2/σv,1≃ 1: 1) and the galaxy number ratio (≃17/51 = 1: 3) of the two subgroups.
In the literature, Abell 3158 was classified as a ‘single-component’ and ‘relaxed’ system (Kolokotronis et al. 2001; Łokas et al. 2006), which possesses a relatively regular morphology in the X-ray band (Ku et al. 1983; Mohr et al. 1999; Schuecker et al. 2001). However, considering no violent merger signatures are detected in the cluster, the existence of the high-velocity subgroup indicates that the cluster is evolving into the late stage of a major merger event. This may explain the origin of the off-centre cool gas clump detected in the west sector region, which is moving at a subsonic velocity (Sections 3.2–3.3; see also Section 5.1).
5 DISCUSSION
5.1 Merging origin of the massive, off-centre cool gas clump
Properties of the massive, off-centre cool gas clumps, which are detected in 1E 0657–56 (Markevitch et al. 2002), Abell 754 (Markevitch et al. 2003; Henry et al. 2004), Abell 2065 (Chatzikos et al. 2006), Abell 2255 (Sakelliou & Ponman 2006), Abell 2256 (Sun et al. 2002) and Abell 3667 (Vikhlinin et al. 2001; Briel et al. 2004). The cooling times of the cool clumps are calculated from equation (5), and the effective conduction times are estimated from equation (6) by assuming a tangled magnetic effect. The gas masses of the cool clumps are calculated by assuming that the gas density, temperature and metal abundance are constant in the clump. Gas entropies are given by S=kT/n2/3gas.
| Host cluster | 1E 0657–56 | A754 | A2065 | A2255 | A2256 | A3158 | A3667 | |
| Clump scale l | (h−171 kpc) | 70 | 120 | 60 | 100 | 160 | 80–110 | 300 |
| Projected distance to centre d | (h−171 kpc) | 650 | 200 | 60 | 130 | 130 | 85 | 400 |
| Gas density ngas | (10−3 cm−3) | 24 | 4.6 | 7.2 | 2.6 − 4.3 | 4.3 | 4.5 | 3.8 |
| Gas temperature T | (keV) | 7.0 ± 1.0 | 6.2 ± 0.1 | 3.4 ± 0.6 | 5.2 ± 0.7 | 4.5 ± 1.0 | 4.0 ± 0.4 | 4.1 ± 0.2 |
| Ambient temperature Tamb | (keV) | 13.6 | 7.4 | 5.5 | 6.9 | 6.7 | 5.5 | 7.7 |
| Cluster temperature Tcluster | (keV) | 13.6 ± 1.0 | 10.0 ± 0.3 | 5.5 ± 0.2 | 6.9 ± 0.3 | 6.7 ± 0.2 | 5.5 ± 0.1 | 7.3 ± 0.2 |
| Metal abundance Z | (Z⊙) | – | 0.54 | 1.36 | – | 0.84 | 0.81 | 0.81 |
| Cooling time tcool | (109 yr) | 2.4 | 12.0 | 5.7 | 11.7 − 19.4 | 10.9 | 9.8 | 11.8 |
| Effective conduction time tcond | (109 yr) | 0.1 | 0.3 | 0.3 | 0.2 − 0.3 | 0.7 | 0.3 − 0.6 | 1.5 |
| Gas mass Mgas | (1011 M ⊙) | 1.1 | 1.0 | 0.2 | 0.3 − 0.6 | 2.3 | 0.3 − 0.8 | 13.4 |
| Gas entropy S | (keV cm2) | 84 ± 12 | 224 ± 4 | 91 ± 16 | 236 ± 80 | 170 ± 38 | 147 ± 15 | 168 ± 8 |
Assuming that the cool gas clump in Abell 3158 has a spherical geometry with a diameter of 80–110 h−171 kpc (Fig. 3a), and has a constant density, the gas mass is estimated to be about 3.0–7.7 × 10¹⁰ M⊙. This value is comparable to the masses of the off-centre cool clumps identified in other merging clusters, which range from about 2.0 × 10¹⁰ to 1.3 × 10¹² M⊙ (Table 3). It also falls into the gas mass range of the cool-core regions of poor clusters and massive groups (e.g. Mulchaey et al. 1996; Gastaldello et al. 2007; Baldi et al. 2009). In fact, as shown in Table 3, not only the gas mass, but also the size, temperature gradient and the relatively high metal abundance of the cool clump in Abell 3158 resemble those of other off-centre cool clumps detected in 1E 0657–56 (Markevitch et al. 2002), Abell 754 (Markevitch et al. 2003), Abell 2065 (Chatzikos et al. 2006), Abell 2255 (Sakelliou & Ponman 2006), Abell 2256 (Sun et al. 2002) and Abell 3667 (Vikhlinin et al. 2001). Note that most of the off-centre cool clumps in these merging systems are considered to be the remnant of the cool-core of either the main cluster or the infalling subcluster. Based on all these similarities, it is natural to speculate that the cool gas clump in Abell 3158 was formed by ram pressure stripping or slingshot during a merger event.
The above speculation is enhanced by the study of the correlation between gas temperature and entropy, which is defined as S=kT/n2/3gas in terms of gas temperature kT and density ngas. By quoting the data of Zhang et al. (2007) and Sanderson, O'Sullivan & Ponman (2009), we recalculate the redshift-corrected gas entropy at 0.1R500 (R500 is the radius at which the mean over-density is 500 with respect to the critical density of the Universe) for a sample of 13 cool-core clusters and a sample of 19 non-cool-core clusters. We also calculate the gas entropy of the seven cool gas clumps listed in Table 3. The entropy–temperature distribution is plotted in Fig. 6, where the strong correlations for the cool-core and non-cool-core clusters are characterized by two power-law models, respectively (Sanderson et al. 2009). It can be clearly seen that cool gas clumps in Abell 3158 and most of the other merging clusters follow the relation for cool-core clusters, which reveals their nature as cool-core remnants. Note that the gas entropy of the cool clump in 1E 0657–56 is significantly below the relation for cool-core clusters at least at the 1σ limit (Fig. 6). This is possibly because the cool clump is compressed extremely as it experiences the ram pressure stripping force and passes through the deep potential of the main cluster during this drastic high-velocity merger event (Markevitch et al. 2002).
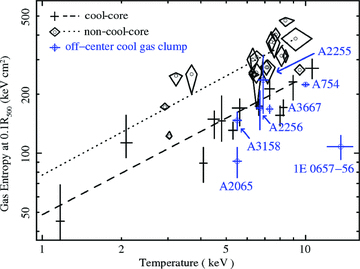
Redshift-corrected gas entropy measured at 0.1R500 (roughly 50–150 kpc) versus average gas temperature for cool-core clusters (crosses) and non-cool-core clusters (diamonds), which are recalculated based on the data of Zhang et al. (2007) and Sanderson et al. (2009). The corresponding best-fitting power-law models given by Sanderson et al. (2009) are also shown as dashed and dotted lines, respectively. The entropy–temperature distribution of the off-centre cool gas clumps (Table 3) is also plotted.
Based on the above data analysis, calculations and discussion, we propose that the appearance of the massive off-centre cool gas clumps can be regarded as a robust diagnostic of a merger state. Combining the study of cold fronts (e.g. Owers et al. 2009), which survive longer than shocks, with the study of such cool gas clumps, we may be able to place tight constraints on the merger history.
5.2 Possible merging scenarios
In Abell 3158, the X-ray bow edge of the faint cold front is pointing west in projection (Sections 3.1–3.3), which indicates that the symmetrical axis of the merging process is reasonably close to the west–east direction, although the projected effect lowers the detectability of the edge. The direction is also roughly consistent with the extending direction of the three cD galaxies (Fig. 1a), as well as the galaxy distribution of the high-velocity subgroup (Fig. 5b). Straightforwardly, the high-velocity subgroup has already made its closest approach to the core of the main cluster roughly from east to west. In this scenario, the apparent discrepancy between the moving velocity of the cool gas clump (700+140−340 km s−1; Section 3.3) and the relative line-of-sight velocity of the high-velocity subgroup (1740 ± 180 km s−1; Section 4) demonstrates that the gas component of the high-velocity subgroup has possibly been significantly slowed by the ram pressure stripping force. Regarding the late stage of the major merger (Section 4), perhaps the high-velocity subgroup is in its second core passage. However, because the three cD galaxies all lie well behind the cold front (Fig. 1a), perhaps the cluster is in another merging scenario, in which the cool gas clump has been slingshot out from the centre of the main cluster, as expected after core passage, although the optical centroid of the high-velocity subgroup is not behind the faint cold front edge.
6 SUMMARY
By analysing the Chandra and XMM–Newton data of the nearby galaxy cluster Abell 3158, we identify a massive, off-centre cool gas clump, which is moving at a velocity of M= 0.6+0.1−0.3, towards west on the sky plane behind a faint cold front. The possibilities of this substructure being formed by inhomogeneous radiative cooling and by central AGN activity are excluded. Based on the results obtained in the X-ray and optical analysis, we speculate that the cool gas clump is the remnant of the original central cool-core of the main cluster or the infalling subcluster during a major merger event. This case shows that the appearance of such massive, off-centre cool gas clumps can be used to diagnose the dynamical state of a cluster, especially when violent merger signatures (e.g. prominent shocks and cold fronts) are absent.
We thank the Chandra and XMM–Newton teams for conducting this research. This work was supported by the National Science Foundation of China (Grant Nos 10673008, 10878001 and 10973010), the Ministry of Science and Technology of China (Grant No. 2009CB824900/2009CB24904) and the Ministry of Education of China (the NCET programme).
REFERENCES
