


Abstract
We consider the response of a protostellar disc to a tidally induced warp and the resultant changes in the spectral energy distribution (SED). We argue that for typical protostellar disc parameters the warp is communicated through the disc in a wave-like fashion. We find that the main effects of the warp tend to be at large radii (R≳ 30 au) and, for sufficiently small viscosity, can be quite long-lived. This can result in non-uniform illumination of the disc at these radii and can induce significant changes to the SED at wavelengths λ≳ 100 μm.
1 INTRODUCTION
These models, however, all assume the disc to be cylindrically symmetric, and this seems to be a reasonable assumption in the inner regions (Monnier et al. 2006). Stars typically form within clusters, and so even single stars are likely to have undergone close encounters with neighbouring stars at a young age. Very close encounters are likely to be dissipative and lead to disc truncation and perhaps even capture and binary star formation (Clarke & Pringle 1991, 1993; Hall, Clarke & Pringle 1996; Boffin et al. 1998; Watkins et al. 1998a,b; Pfalzner et al. 2005; Moeckel & Bally 2006). More distant encounters occur more frequently, but can still provide the disc with significant warping. We note that there is observational evidence for such disc disturbances (Cabrit et al. 2006; Lin et al. 2006; Quillen 2006) and for the warping of the disc at large radius (Hughes et al. 2009).
Viscosity in the outer regions of protostellar discs is likely to be small, and typical figures of the dimensionless viscosity parameter α (Shakura & Sunyaev 1973) in the range 10−2–10−4 are thought likely, e.g. Terquem (2008). This is less than the disc thickness ratio H/R, and in this case such warps are propagated as waves (Papaloizou & Lin 1995). With such low viscosities, these waves can exist for a significant fraction of the protostellar lifetime (Section 2).
In this paper, we investigate the effects of these waves in a very simplified manner. We do not attempt to model perturbations to the structure or SEDs of discs with flares or other configurations. Rather we consider the effect on the shape and on the resultant SEDs emitted by a disc which is initially thin and flat. Although this is not likely to enable us to provide realistic fits to any observations, it does enable us to see at what wavelengths any complications deriving from such perturbations might manifest themselves, and to provide an estimate of their relative magnitude. We note that the effect of warping on the SED of a protostellar disc has been considered previously for the case of a disc in a misaligned binary system by Terquem & Bertout (1993, 1996), but that they do not consider the dynamic response of the disc, nor its subsequent evolution towards alignment (e.g. Bate et al. 2000).
In Section 2, we provide estimates of the periods and lifetimes of warp-like perturbations in a protostellar disc. In Section 3, we compute the time-dependent behaviour of warps which can be generated using a simple model of the flyby of a perturbing star. In Section 4, we compute the temperature distributions and resulting SEDs for these disc models. We discuss the implications of our results in Section 5.
2 WARP PROPAGATION AND LIFETIME ESTIMATES


3 WARP GENERATION – NUMERICAL RESULTS
3.1 The warp equations
 is the vertically integrated pressure. We note that these equations do not make allowance for dispersive or non-linear effects in the wave propagation (Ogilvie 2006). For the waves, we discuss here dispersive effects may be of marginal significance, but only at the outer disc edge. However, for the large amplitudes required to substantially change the SED, non-linear effects may well play a role. However, to take these effects properly into account would require a full hydrodynamical model of the disc, which is beyond the scope of the current investigation.
 and
and  lie in the XY-plane. We can then use W=lx+i ly, G=Gx+i Gy and T=Tx+i Ty as complex representations of l, G and T, respectively. We then replace the quantities W and G by the quantities A(R, t) and D(R, t) defined by


We truncate the disc at R=Rout and do not allow for dissipation at the outer boundary. This is because the wavelength of the warp is long in comparison to any smoothing of the outer edge and so the warp will only see it as a sharp edge and reflect back inwards.
3.2 External torque due to fly-by
 by a mass of M2 at position vector Rb is given to first order in R/Rb by (Lubow & Ogilvie 2000)
3.3 The disc shape and its evolution
We start with a disc which has an outer radius of Rout= 100 au. We take the inner radius to be at Rin= 0.01 au, and note that this is much less than the expected value of Rcrit (equation 11) within which we expect the disc to be tilted but not warped.


The disc evolution equations (18) and (19) are evolved numerically using a leapfrog scheme. Boundary conditions are chosen to ensure that the inner and outer edges of the disc are stress free.
 .
.3.3.1 Model 1
 is in the Z-direction. We take its magnitude V to correspond to the escape velocity from the point of nearest approach, so that
Because the path of the perturber lies solely in the XZ-plane, the disc annuli are tilted only about the Y-axis. Thus we can envisage the disc warp by considering a cut through the disc in the XZ-plane.
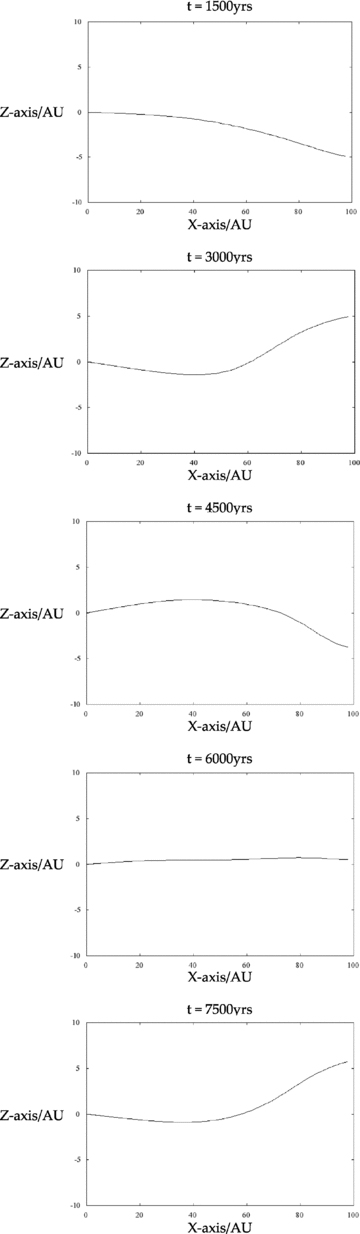
A sample of the XZ-profiles of the disc at various times for Model 1a, showing the induced warp and its propagation through the disc. For time t= 0, the disc is entirely flat in the XY-plane. Here we only show the positive X-axis. In the XZ-plane, the disc is antisymmetric around x= 0. The axes are in au. Note that the inner region of the disc (R≲ 30 au) is tilted but not warped.
For Model 1b we explore a more substantial warping of the disc. For this, we use a= |a| = 200 au and we take the mass of the perturber M2= 10 M⊙. We note that this changes the velocity of the flyby to V= 9.5 km s−1. As can be seen in Fig. 2 this produces an amplitude for the warp wave of approximately 35 au.
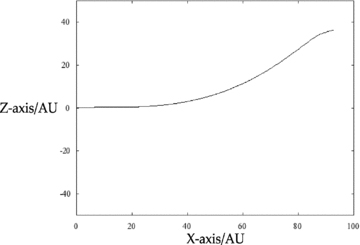
An example of the XZ-profile of the disc for Model 1b, showing that in this case the warp is more substantial at the outer edge of the disc. The axes are in au.
3.3.2 Model 2
 , that is, at an angle to the disc plane. The perturber is initially at position
As the disc is twisted we can no longer view it via a cut through the XZ-plane. To illustrate this, in Fig. 3, we show the disc in three-dimensions, for Model 1b, and compare it to Fig. 4, which is a typical shape of the disc for Model 2. The disc shapes for Model 1a and 1b are the same but with differing amplitudes, so we use Model 1b here to illustrate the disc shape more easily.

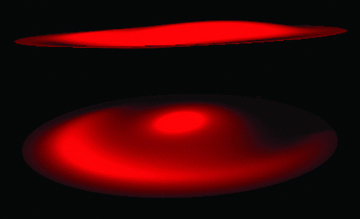
We show here a representative disc shape in three-dimensions for Model 1b. The image was generated using the graphics package povray. The top image is the XZ profile of the 100 au disc, viewed and illuminated from (0, −200, 0). The second image is the same disc but viewed from (0, −200, 50), and illuminated from (0, 5, 0). Because the path of the perturber lies in the XZ-plane, each disc annulus is tilted about the Y-axis. Thus the disc is warped but not twisted.
We show here a representative disc shape in three-dimensions for Model 2. The image was generated using the graphics package povray. The top image is the XZ profile of the 100 au disc, viewed and illuminated from (0, −200, 0). The second image is the same disc but viewed from (0, −200, 50), and illuminated from (0, 5, 0). Because the path of the perturber is not perpendicular to the unperturbed disc, the individual disc annuli are tilted about different axes in the XY-plane. This means that the shape of the disc is twisted about the Z-axis. The central region is tilted in one plane and the outer rings are slowly twisted away from this plane, producing the shadowing effects.
4 DISC HEATING AND RESULTANT SEDs
4.1 Temperature profile

This is valid only if self-shadowing of the disc can be ignored. In practice, this needs to be taken into account. Thus this temperature is applied only to those parts of the disc which are tilted towards the central star and which have a view of the central star which is unobscured by other (warped) parts of the disc. Parts of the disc which are obscured are assumed to have negligible temperature. This computation is carried out in a straightforward manner as in Pringle (1997).
Once the temperature distribution of the disc is found, we compute the emitted disc spectrum simply by assuming that each disc element emits locally as a blackbody. For the SED, we assume an observer placed on the Z-axis for simplicity. If the disc was to be viewed from an angle, there would be an apparent reduction in the magnitude of the flux emitted by the disc. If that angle is increased enough, then the central star and large portions of the disc would be obscured from the observer by the warp.
4.1.1 Model 1
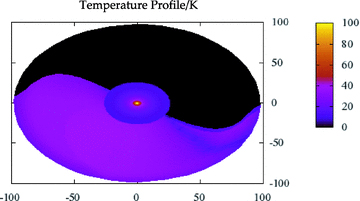
In Fig. 5, we show a representative temperature distribution found for Model 1b, and in Fig. 6 the resultant SED (as viewed by a distant observer in the direction of the Z-axis) from the disc structure shown in Fig. 3. For comparison we also plot, in Fig. 6, an SED from Model 1a and the contribution to the SED from the central star. Because of the induced warp, the SED displays a secondary peak at around 100 μm. For shorter wavelengths, the radiation comes from the stellar surface and the flat illuminated part of the inner disc. The magnitude of the warp is larger in Model 1b, creating a more substantial flux from the warped disc at around 100 μm as opposed to the weaker flux from Model 1a. In Model 1, all disc annuli are tilted about the same axis, therefore outside the central region (taken to be at the reflection radius), only one half of the disc appears illuminated.
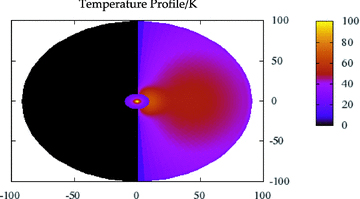
Temperature profile for the disc in Fig. 3, from Model 1b. The axes are in au, with the temperature coloured by the scale shown in Kelvin. The central star (with T*= 5000 K) and innermost parts of the disc are omitted to give a higher resolution over the disc. Note that only one half of the disc appears illuminated to an external observer.
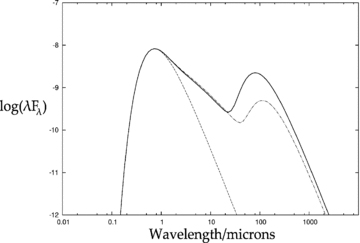
SED in terms of λFλ. The solid line is for the disc in Fig. 3, from Model 1b. The dot–dashed line is a typical SED from Model 1a, and the dashed line represents the star which is taken to be a blackbody with T*= 5000 K. The contribution from the star peaks at about 0.6 μm. The inner disc has a similar maximum temperature and a log wavelength dependence of the form λFλ∝λ−4/3. The contribution from the upturned part of the outer disc peaks at around 100 μm. As the warp is more substantial in Model 1b, the flux in this peak is greater than the flux in the corresponding peak for Model 1a. As is to be expected, both disc peaks have less magnitude than the primary peak, with Model 1b having a disc peak flux that is around 5 times less than the primary peak flux.
In general, the disc illumination can be more complicated than this because of self-shadowing, and we illustrate some possibilities in Fig. 7.
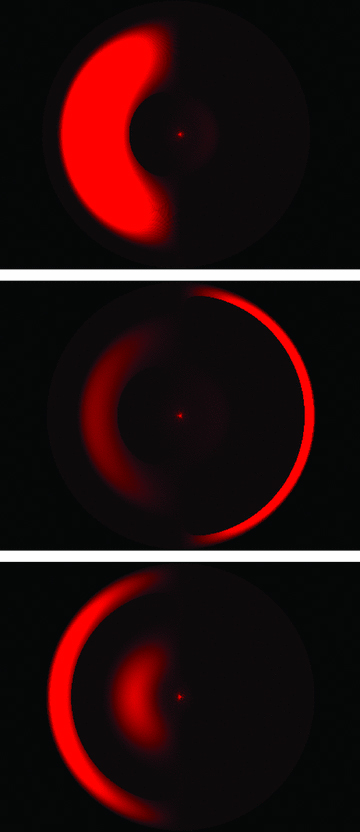
Some examples of the complicated illumination profiles that arise due to the self-shadowing as the warp propagates through the disc. Note that the characteristic property of an illuminated warp is that the disc surface brightness is lop-sided with respect to the central star. The images were generated by the graphics package povray, with the source of illumination on the central stars surface. The discs here have a radius of 100 au.
4.1.2 Model 2
As the flyby in Model 2 is misaligned with the original plane of the disc, the resultant disc is both tilted and twisted. This can be seen in Fig. 8 which shows a typical temperature profile for Model 2. This exhibits a spiral pattern in the illumination profile. The resultant SED, Fig. 9, is not changed greatly by this, which is to be expected as the disc intercepts a similar amount of stellar flux when both tilted and twisted as opposed to just being tilted. The contribution of the heated outer disc again peaks at around 100 μm.
Temperature profile for the disc in Fig. 4, from Model 2. The axes are in au, with the colour scale giving the temperature in Kelvin. The central star (with T*= 5000 K) and innermost parts of the disc are omitted to give a higher resolution over the disc. Note that when the path of the perturber is not perpendicular to the unperturbed disc plane, the disc is twisted and so the pattern of illumination displays an apparent spiral pattern.
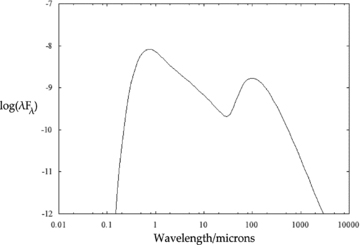
SED in terms of λFλ for the disc in Fig. 4, from Model 2.
5 DISCUSSION
We have considered the response of a protostellar disc to a tidally induced warp, and the resultant change in the SED. We have used a simplified analysis in order to emphasize the relevant implications.
For the low viscosities currently envisaged for the outer disc regions, we note that a tidally induced warp is propagated as a wave, and that such a wave can be comparatively long lasting (in our case more than a Myr for α= 10−4). The warp is largest in the outer regions, and within some critical radius (in our case Rcrit∼ 30 au) the disc remains flat but has a tilt which is variable on a time-scale of order the propagation time-scale of the warp (here a few thousand years). Note that any collimated outflow, or jet, originating from the inner disc regions might be expected therefore to vary direction on this time-scale.
In reality, the passive disc that we are considering here will be flared. Flaring of the disc contributes to the SED at wavelengths longer than a few μm. In this paper, in order to emphasize the effects of the warp, we have assumed the disc to be locally thin when computing the SED. In practice the two effects, that of the flare and that of the warp, must be combined.
From our computations, in agreement with Terquem & Bertout (1993, 1996), we conclude that the warp is only likely to affect the disc SED at wavelengths of around 100 μm and longer, but that the effects can be substantial. We also note that warp-induced variations in disc illumination have the effect of making the disc appear asymmetric with respect to the central star at radii R≳Rcrit. Further, a twist in the disc, induced by a skewed flyby, can have the effect of introducing a spiral component into the disc illumination.
We thank Cathie Clarke for useful discussions on the topic. We also thank the referee for useful feedback.
REFERENCES
