


Abstract
The Doppler wobble induced by the extra-solar planet HD 134987b was first detected by data from the Keck Telescope nearly a decade ago, and was subsequently confirmed by data from the Anglo-Australian Telescope (AAT). However, as more data have been acquired for this star over the years since, the quality of a single Keplerian fit to that data has been getting steadily worse. The best-fitting single Keplerian to the 138 Keck and AAT observations now in hand has an root-mean-square (rms) scatter of 6.6 m s−1. This is significantly in excess of both the instrumental precision achieved by both the Keck and Anglo-Australian Planet Searches for stars of this magnitude, and of the jitter expected for a star with the properties of HD134987. However, a double Keplerian (i.e. dual planet) fit delivers a significantly reduced rms of 3.3 m s−1. The best-fitting double planet solution has minimum planet masses of 1.59 and 0.82 1.59 ± 0.02MJup, orbital periods of 258 and 5000 d, and eccentricities of 0.23 and 0.12, respectively. We find evidence that activity-induced jitter is a significant factor in our fits and do not find evidence for asteroseismological p modes. We also present seven years of photometry at a typical precision of 0.003 mag with the T8 0.8 m automatic photometric telescope at Fairborn observatory. These observations do not detect photometric variability and support the inference that the detected radial-velocity periods are due to planetary mass companions rather than due to photospheric spots and plages.
1 INTRODUCTION
Of the more than 300 nearby stars known to harbour one or more planets, 38 are multiple-planet systems, and some show radial velocity residuals indicative of additional companions (e.g. Wright et al. 2007). A number of known extrasolar planets (hereafter, shortened to exoplanets) are becoming suitable for increasingly powerful follow-up techniques. Primarily, this has been led by the discovery of transiting objects, though other observations are becoming rewarding. Notably, observations of short-period exoplanets have enabled atmospheric abundance studies (e.g. Swain et al. 2009), phase variation in flux to be distinguished (e.g. Knutson et al. 2007), and high-resolution spectroscopic observations may soon allow for direct spectroscopic detection (e.g. Barnes et al. 2008). Recent leaps in image processing (e.g. Marois et al. 2008) have led to companion detections at 0.5 arcsec separations with contrast ratios of 10−6 across the near infrared. This has allowed for the direct imaging of putative exoplanets which in turn is driving the instrumentation programmes of telescopes worldwide.
The architecture of our Solar system is dominated by Jupiter at 5.2 au and by Saturn at 9.5 au. However, very little is known about the frequency or nature of other planetary systems with orbital distances greater than 5 au (e.g. Marcy et al. 2005). Precise radial velocities have only recently reached beyond the 10 yr required to sense such objects. For planets orbiting solar mass stars, it is key to have sensitivity to Jupiter-like (12 yr) and Saturn-like (30 yr) orbits. The ability to put constraints on such planets, even with potentially incomplete orbits, will enable imaging observations to target systems for which they can provide critical observational constraints. With or without imaging, such orbits may substantially constrain the orbital structure and dynamical configuration, providing clues about planetary formation and migration (e.g. Currie 2009) and will help us trace the uniqueness of our own Solar system.
The Anglo-Australian Planet Search (AAPS) and the Keck planet searches are long-term radial velocity projects engaged in the detection and measurement of exoplanets at the highest possible precisions. Using the iodine calibration technique (e.g. Butler et al. 1996), they provide coverage of bright inactive F, G, K and M dwarfs. The AAPS began operation in 1998 January, and is currently surveying 250 stars. It has published exoplanets with M sin i ranging from 5MEarth to 10 MJup (Butler et al. 2001, 2002, 2006a; Tinney et al. 2001, 2002a,b, 2003, 2005, 2006; Jones et al. 2002a,b, 2003, 2006; Carter et al. 2003; McCarthy et al. 2005; O'Toole et al. 2007, 2009a,b; Bailey et al. 2009; Vogt et al. 2010). With its somewhat longer baseline (since 1996) the Keck project originally announced the exoplanetary signal around HD 134987 (Vogt et al. 2000). Both Keck and the Anglo-Australian Telescope (AAT) have been regularly observing the star since 1998. Nearly a decade later, we present results for HD 134987 from the combined AAT and Keck data set.
2 CHARACTERISTICS OF HD 134987
HD134987 (23 Lib) is a solar-type (G4V) star which is nearby (22 pc) and bright (V= 6.45), with low activity (adopted log RHK =−5.1) and high metallicity (adopted 0.25 dex). As an analogue of the prototype ‘Hot Jupiter’ host star (51 Peg), it has long been a target for precision exoplanet surveys. Vogt et al. (2000) reported a planetary mass signal with a period P= 259 d, eccentricity e= 0.24, M sin i= 1.58 MJup from Keck data with an rms of 3 m s−1. Butler et al. (2001) confirmed the orbit using AAT data. In Butler et al. (2006a), these parameters were revised to P= 258 d, eccentricity, e= 0.24, M sin i= 1.64 MJup with an rms of 4 m s−1 to a reduced χ2ν= 0.89 fit, including a trend of 2.9 ± 0.2 m s−1 yr−1. At that time, the jitter of HD 134987 was estimated to be 3.5 m s−1. Wright et al. (2007) identify a number of objects whose False Alarm Probability for an additional Keplerian versus a simple trend is below 2 per cent. Wright et al. report that the signal appeared as a change in the level of the residuals between 2000 and 2002 of 15 m s−1. They thus suggested an outer planet on a rather eccentric orbit which reached periastron in 2001. Recently estimates for the jitter, based on Wright (2005), have been reduced by around a factor of  , (J. Wright, private communication) and an additional 43 epochs have been acquired with the AAT and Keck.
The properties of HD 134987 are summarized in Table 1. The variety of recent measurements reflect its inclusion in large-scale studies of nearby solar type stars. Recently, Holmberg, Nordstroem & Andersen (2007) included it in a magnitude-limited, kinematically unbiased study of 16682 nearby F and G dwarf stars and Takeda et al. (2007) included it in a study of the stellar properties for 1040 F, G and K stars observed for the Anglo-Australian, Lick and Keck planet search programmes. Takeda et al. used high signal-to-noise echelle spectra (originally taken as iodine-free templates for radial velocities) to derive effective temperatures, surface gravities and metallicities whereas Holmberg et al. used Strömgren photometry and the infrared flux method calibration of Alonso, Arribas & Martínez-Roger (1996). Both studies used Hipparcos parallaxes to convert luminosities in order to make comparisons with different theoretical isochrones and so derive stellar parameters. To determine, stellar masses and ages Takeda et al. (2007), use Yonsei-Yale isochrones (Demarque, Woo & Kim 2004), and Holmberg et al. (2007) use Padova isochrones (Giradri et al. 2000; Salasnich et al. 2000). Both sets of derived parameters agree to within the uncertainties.
The stellar parameters for HD 134987 are tabulated below.
| Parameter | Value | Reference |
| Spectral Type | G5V | Cenarro et al. (2007) |
| log R′HK | −5.04 | Jenkins et al. (2006) |
| −5.13 | Saffe, Gomez & Chavero (2005) | |
| Variability(σ) | 0.0013 | van Leeuwen (2007) |
| Distance(pc) | 22.2±1.1 | van Leeuwen (2007) |
| log (Lstar/L⊙) | 1.80±0.14 | van Belle & von Braun (2009) |
| 1.43±0.02 | Sousa et al. (2008) | |
| Rstar/R⊙ | 1.25±0.04 | van Belle & von Braun (2009) |
| Mstar/M⊙ | 1.07 ±0.030.08 | Holmberg et al. (2007) |
| 1.05 ±0.070.05 | Takeda et al. (2007) | |
| 1.10 ±0.070.04 | Takeda (2007) | |
| Teff (K) | 5636 | Holmberg et al. (2007) |
| 5766 | Takeda (2007) | |
| 5740±23 | Sousa et al. (2008) | |
| 5585±50 | van Belle & von Braun (2009) | |
| 5623 ±57 | Bond et al. (2006) | |
| [Fe/H] | 0.20 | Holmberg et al. (2007) |
| 0.28 | Takeda (2007) | |
| 0.25±0.02 | Sousa et al. (2008) | |
| U,V,W (km s−1) | −21,−41,20 | Holmberg et al. (2007) |
| −9.8,−25.4,28.4 | Takeda (2007) | |
| Age (Gyr) | 8.4 ±1.61.4 | Takeda et al. (2007) |
| 11.1 ±1.53.7 | Saffe et al. (2008) | |
| jitter (m s−1) | 3.5 | Butler et al. (2006a) |
| v sin i (km s−1) | 2.17 | Butler et al. (2006a) |
The low activity index of HD 134987 (log R′HK∼−5.1) is consistent with the lack of significant photometric variability in measurements made by the Hipparcos satellite. Combining Hipparcos astrometry with their radial velocities, Holmberg et al. (2007) and Takeda (2007) determine U, V, W space velocities consistent with the old disc lifetimes in the range 8–11 Gyr inferred from the isochrones and the lack of X-ray flux detected from HD 134987 (Kashyap, Drake & Saar 2008).
3 SPECTROSCOPIC OBSERVATIONS
The 63 epochs of Doppler data obtained at the AAT between 1998 August and 2009 October are shown in Table 2. The 75 epochs of Doppler measurements obtained at the Keck Telescope between 1996 August and 2009 July are shown in Table 3. The observing and data processing procedures follow those described by Butler et al. (1996, 2001, 2006a). All these data have been reprocessed through our frequently up-graded analysis system, and here we report results from the current version of our pipeline. Our velocity measurements are derived by breaking the spectra into several hundred 2 Å chunks and deriving relative velocities for each chunk. The velocity uncertainty, given in the third column and labelled ‘Unc.’ is determined from the scatter of these chunks. This uncertainty includes the effects of photon-counting uncertainties, residual errors in the spectrograph point spread function (PSF) model, and variation in the underlying spectrum between the template and iodine epochs. For both the AAT and Keck, observations in which the uncertainty is more than three times the median uncertainty of the entire set are not reported. All velocities are measured relative to the zero-point defined by the template observation. Since the AAT and Keck data were processed with different templates, we treat the difference between their zero-points as a free parameter in our fitting procedures.
Relative radial velocities (RV) and error in m s−1 are given for the AAT data set. Julian Dates (JD) are heliocentric. Radial velocities are barycentric but have an arbitrary zero-point determined by the radial velocity of the template.
| JD (−2450 000) | RV (m s−1) | Unc. (m s−1) |
|---|---|---|
| 917.2282 | −41.8 | 2.0 |
| 1213.2775 | −61.6 | 1.9 |
| 1276.0475 | −50.4 | 2.1 |
| 1382.9573 | 30.1 | 1.8 |
| 1413.8813 | −16.4 | 1.0 |
| 1630.2677 | 36.1 | 1.7 |
| 1683.0609 | −20.8 | 2.0 |
| 1706.0960 | −43.3 | 2.5 |
| 1717.9564 | −56.0 | 1.8 |
| 1742.9340 | −57.7 | 1.6 |
| 1984.2154 | −51.4 | 2.0 |
| 2060.9717 | −35.8 | 1.6 |
| 2091.9394 | −11.9 | 1.3 |
| 2124.8927 | 33.8 | 1.0 |
| 2125.0410 | 34.2 | 1.3 |
| 2125.8890 | 41.6 | 1.1 |
| 2125.9847 | 35.2 | 1.2 |
| 2126.9191 | 37.7 | 1.6 |
| 2186.8784 | 0.6 | 1.7 |
| 2189.8632 | −11.8 | 1.3 |
| 2360.2379 | 7.4 | 1.6 |
| 2387.1061 | 42.9 | 1.5 |
| 2388.1532 | 44.9 | 1.3 |
| 2455.9877 | −6.8 | 1.7 |
| 2476.9724 | −29.5 | 1.4 |
| 2655.2513 | 52.5 | 1.6 |
| 2747.1502 | −39.9 | 1.3 |
| 2785.0880 | −50.4 | 1.5 |
| 2860.8964 | −10.0 | 1.4 |
| 3042.2517 | −50.8 | 1.3 |
| 3215.9389 | 7.3 | 1.0 |
| 3485.0592 | −7.4 | 1.2 |
| 3508.1736 | −25.2 | 1.4 |
| 3521.0784 | −33.2 | 1.6 |
| 3943.9202 | 49.4 | 0.9 |
| 3946.9329 | 47.4 | 0.8 |
| 4139.2578 | −28.8 | 1.2 |
| 4226.0985 | 36.0 | 1.9 |
| 4368.8908 | −48.2 | 1.1 |
| 4543.2849 | −34.2 | 1.1 |
| 4899.2183 | −47.7 | 1.2 |
| 4900.2294 | −44.4 | 0.8 |
| 4908.2357 | −42.0 | 1.5 |
| 5017.9707 | 4.8 | 1.4 |
| 5020.0140 | −2.8 | 1.1 |
| 5020.9416 | −2.5 | 1.0 |
| 5021.9442 | −3.2 | 1.2 |
| 5023.9401 | −9.0 | 1.0 |
| 5029.9292 | −13.3 | 1.1 |
| 5030.8891 | −15.1 | 0.9 |
| 5032.0031 | −17.6 | 0.9 |
| 5032.9382 | −16.1 | 1.0 |
| 5036.9205 | −19.3 | 1.2 |
| 5044.9871 | −31.4 | 1.2 |
| 5046.0131 | −31.4 | 0.7 |
| 5046.9415 | −32.0 | 0.9 |
| 5047.8949 | −34.5 | 0.8 |
| 5048.9788 | −37.6 | 0.7 |
| 5054.8813 | −42.6 | 0.9 |
| 5055.9357 | −40.2 | 0.5 |
| 5104.8746 | −57.2 | 1.4 |
| 5110.8763 | −60.2 | 1.0 |
| 5111.8779 | −61.8 | 1.4 |
Relative radial velocities, errors in m s−1, S values and exposure times (texp) are given for the Keck data set. Julian Dates are heliocentric. RVs are barycentric but have an arbitrary zero-point determined by the radial velocity of the template.
| JD (−2450 000) | RV (m s−1) | Unc. (m s−1) | S | texp s |
|---|---|---|---|---|
| 276.8020 | −9.3 | 1.4 | 0.122 | 600 |
| 283.8984 | −15.4 | 1.8 | −0.020 | 300 |
| 604.8935 | 41.2 | 1.1 | 0.135 | 150 |
| 838.1755 | 40.0 | 1.1 | 0.151 | 143 |
| 839.1727 | 41.2 | 1.1 | 0.150 | 143 |
| 840.1707 | 43.1 | 1.2 | 0.156 | 143 |
| 863.1203 | 37.6 | 1.2 | 0.148 | 80 |
| 954.9176 | −49.3 | 0.8 | 0.143 | 143 |
| 956.9547 | −44.6 | 1.1 | 0.153 | 143 |
| 981.8126 | −54.8 | 1.5 | 0.151 | 120 |
| 982.8190 | −48.6 | 1.1 | 0.154 | 140 |
| 983.8498 | −48.6 | 1.6 | 0.154 | 110 |
| 1011.8011 | −48.6 | 1.1 | 0.150 | 60 |
| 1012.8005 | −46.2 | 1.2 | 0.138 | 100 |
| 1013.8006 | −46.1 | 1.3 | 0.128 | 80 |
| 1050.7730 | −13.2 | 1.1 | 0.170 | 80 |
| 1051.7547 | −10.7 | 1.1 | 0.152 | 268 |
| 1068.7306 | 7.1 | 1.0 | 0.174 | 100 |
| 1069.7193 | 8.2 | 1.0 | 0.172 | 100 |
| 1070.7242 | 9.9 | 1.0 | 0.164 | 110 |
| 1071.7229 | 8.8 | 1.0 | 0.182 | 120 |
| 1072.7204 | 14.9 | 1.1 | 0.161 | 80 |
| 1073.7196 | 14.4 | 1.2 | 0.051 | 120 |
| 1074.7070 | 16.4 | 1.0 | 0.166 | 120 |
| 1200.1581 | −48.3 | 1.2 | 0.147 | 100 |
| 1227.0883 | −49.0 | 1.0 | 0.148 | 120 |
| 1228.1038 | −51.1 | 1.2 | 0.157 | 120 |
| 1229.1161 | −49.9 | 1.1 | 0.156 | 140 |
| 1310.8892 | −18.2 | 1.1 | 0.143 | 100 |
| 1311.9101 | −14.3 | 1.1 | 0.144 | 100 |
| 1312.9239 | −19.3 | 1.4 | 0.138 | 70 |
| 1314.0005 | −14.5 | 1.2 | 0.150 | 100 |
| 1340.8393 | 30.9 | 1.1 | 0.148 | 119 |
| 1341.8853 | 31.8 | 1.3 | 0.154 | 119 |
| 1342.8787 | 34.2 | 1.3 | 0.150 | 60 |
| 1367.7877 | 39.2 | 1.3 | 0.150 | 90 |
| 1368.7558 | 48.3 | 1.3 | 0.146 | 55 |
| 1369.7821 | 52.9 | 1.3 | 0.156 | 60 |
| 1370.8677 | 53.4 | 1.4 | 0.155 | 90 |
| 1371.7599 | 49.4 | 1.2 | 0.149 | 50 |
| 1372.7678 | 49.7 | 1.2 | 0.145 | 60 |
| 1373.7712 | 45.5 | 1.3 | 0.151 | 40 |
| 1410.7258 | 4.3 | 1.1 | 0.153 | 119 |
| 1411.7251 | −3.6 | 1.3 | 0.143 | 119 |
| 1583.1620 | 8.2 | 1.6 | 0.153 | 70 |
| 1704.8398 | −27.8 | 1.3 | 0.148 | 57 |
| 2002.9877 | −46.3 | 1.4 | 0.128 | 213 |
| 2030.9596 | −40.7 | 1.3 | 0.134 | 194 |
| 2062.8470 | −25.1 | 1.3 | 0.119 | 68 |
| 2094.7919 | 4.4 | 1.4 | 0.119 | 87 |
| 2334.1494 | −10.6 | 1.4 | 0.127 | 56 |
| 2446.9002 | 14.6 | 1.3 | 0.135 | 74 |
| 2683.1724 | 40.0 | 1.5 | 0.140 | 50 |
| 2828.8530 | −28.8 | 1.3 | 0.130 | 52 |
| 3153.8956 | 49.5 | 1.1 | 0.135 | 42 |
| 3426.0749 | 61.6 | 1.1 | 0.142 | 446 |
| 3934.7661 | 57.9 | 1.1 | 0.144 | 59 |
| 4139.1543 | −10.3 | 1.2 | 0.149 | 40 |
| 4246.9373 | 16.4 | 0.9 | 0.155 | 173 |
| 4247.9507 | 16.7 | 1.2 | 0.154 | 56 |
| 4248.9033 | 13.2 | 1.0 | 0.153 | 27 |
| 4251.8409 | 8.9 | 1.3 | 0.152 | 41 |
| 4255.8205 | 5.3 | 1.0 | 0.151 | 27 |
| 4278.7856 | −10.1 | 1.2 | 0.153 | 42 |
| 4279.7868 | −12.1 | 1.1 | 0.150 | 49 |
| 4285.7953 | −18.7 | 1.3 | 0.161 | 93 |
| 4294.8522 | −28.6 | 1.2 | 0.151 | 53 |
| 4343.7227 | −36.2 | 1.2 | 0.159 | 42 |
| 4491.1711 | 37.2 | 1.3 | 0.149 | 55 |
| 4545.0821 | −20.5 | 1.3 | 0.150 | 36 |
| 4547.0645 | −20.6 | 1.3 | 0.149 | 36 |
| 4600.9843 | −43.3 | 1.2 | 0.148 | 84 |
| 4635.8703 | −31.3 | 1.3 | 0.152 | 27 |
| 4718.7306 | 61.8 | 1.4 | 0.159 | 50 |
| 5049.8434 | −15.8 | 0.8 | 0.177 | 59 |
4 ORBITAL SOLUTION FOR HD 134987
The AAT and Keck data are shown in Fig. 1 with a single Keplerian curve fit with an orbital period of 258.19 ± 0.07 d, a velocity amplitude of 50.1±1.5 m s−1 and an eccentricity of 0.233 ± 0.002. The minimum (M sin i) mass of the planet is 1.59 ± 0.02 MJup. The rms to the single Keplerian fit is 6.6 m s−1. The activity measure (log RHK=−5.1) predicts a rotation period of 23–33 d (Wright 2005), which is significantly different from the exoplanet solution. The lack of any observed chromospheric activity or photometric variations gives us confidence that this solution proposed by Vogt et al. (2000) arises from an exoplanet rather than from long-period starspots or chromospherically active regions. However, since HD134987 is an inactive star we would expect a substantially lower rms. Further to the long-term trend found by Butler et al. (2006a), we now find a curvature that suggests a two planet solution with an ∼5000 d period for the outer planet. Fig. 2 shows the best-fitting double Keplerian to the Keck and AAT data, with an rms of 3.3 m s−1. The best-fitting parameters of the double-Keplerian fit are given in Table 4 and are based on treating the offset between the AAT and Keck as a free parameter.
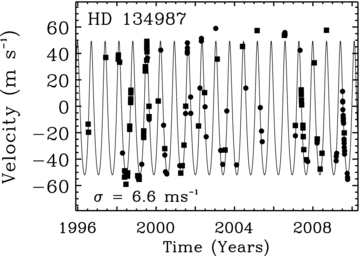
The solid line indicates the best-fitting single Keplerian which has an rms of 6.6 m s−1 fit to the data. The Keck data are shown as squares and the AAT data as circles.
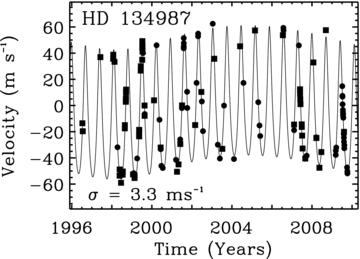
The solid line shows the best-fitting double Keplerian to the Keck (squares) and AAT (circles) data. A significantly improved rms of 3.3 m s−1 is achieved relative to the single planet fit.
Orbital parameters with standard errors for double Keplerian fit to HD 134987 data set based on our best fit solution.
| HD 134987b | HD 134987c | |
| Orbital period P (d) | 258.19 ± 0.07 | 5000±400 |
| Velocity amplitude K (m s−1) | 49.5±0.2 | 9.3±0.3 |
| Eccentricity e | 0.233 ± 0.002 | 0.12±0.02 |
| ω (deg) | 352.7±0.5 | 195±48 |
| Periastron Time (JD) | 10071.0±0.8 | 11100±600 |
| Msini (MJup) | 1.59 ± 0.02 | 0.82±0.03 |
| a (au) | 0.81±0.02 | 5.8±0.5 |
| Systemic zero point offset (m s−1) | −3.8±3.2 | |
| Systemic AAT offset (m s−1) | −14.6±3.2 |
Fig. 3 shows the periodogram of the residuals to HD134987b for the AAT, Keck and combined AAT+Keck data sets. Significant power is present at periods beyond a few thousand days in the data sets (with low false alarm probabilities computed using systemic: AAT –5 × 10⁻², Keck –7 × 10⁻⁵, combined –3 × 10⁻¹³). We investigated a range of solutions using the AAT and Keck data sets both separately and together. Both data sets produce very similar solutions for the inner planet. For the outer planet, we have not definitively seen a full orbital period and thus the orbit is less clear-cut. We found that the AAT data set favours somewhat shorter periods (around 5000 d) and lower eccentricities (e∼ 0.1), while the Keck data set favours longer period solutions with higher eccentricities. The addition of a 5000 d outer planet to either data set or the combined data set produces an improvement in rms by more than a factor of 2 (e.g. Figs 1 and 2). The jitter value which must be used to result in a reduced χ2ν= 1 is more than 6 m s−1 for a single planet fit, and drops significantly to around 2.6 m s−1 for a double planet fit for the combined data set and 2.3 m s−1 (AAT) and 3.2 m s−1 (Keck) for the double planet fit to the separate data sets. These values of jitter are consistent with prediction (2.1 m s−1) of the most recent activity jitter calibration of J. Wright (private communication). The earliest Keck data have larger uncertainties than the other Keck observations and appear as outliers in the residuals plots (Fig. 4). We have therefore checked the sensitivity of the solution to these three 1996 and 1997 data points, and find that removal of these data points does not significantly change the best-fitting orbital parameters and leads to a reduction of only 0.1 m s−1 in the fit rms.
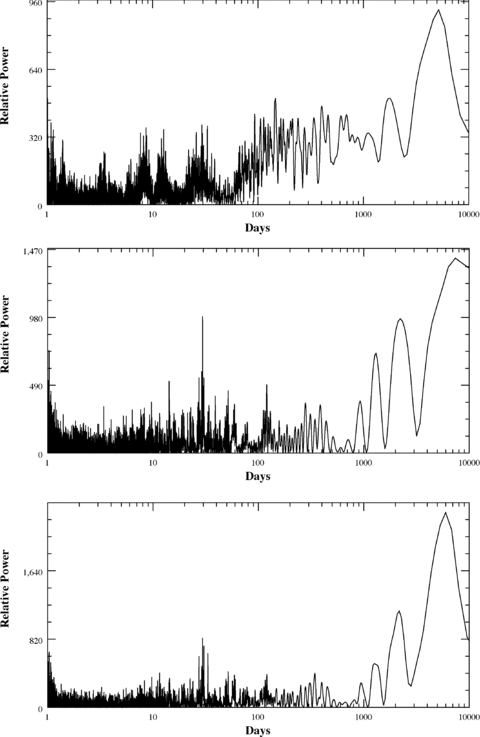
Periodograms of the residuals to a single Keplerian fit to the HD 134987 data: AAT (top), Keck (middle), Combined (bottom). The outputs are taken from the publicly available package systemic (Meschiari et al. 2009).
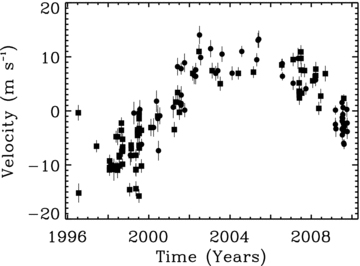
Residuals to the 258 d Keplerian fit for HD134987b shown in Fig. 1 are shown.
We have not yet seen a full orbital period for HD134987c and so it is difficult to assign a reliable solution for its parameters. In order to better understand how the fit parameters for HD134987c are related, in Fig. 5, we show contours of best-fitting χ2 for period, mass and eccentricity. The contours indicate best-fitting χ2 solutions increased by 2.3, 6.2 and 11.8, which correspond to 1σ, 2σ and 3σ confidence levels for systems represented with two degrees of freedom and Gaussian noise. They have been derived allowing all other orbital parameters for HD134987b and c to be best fit.
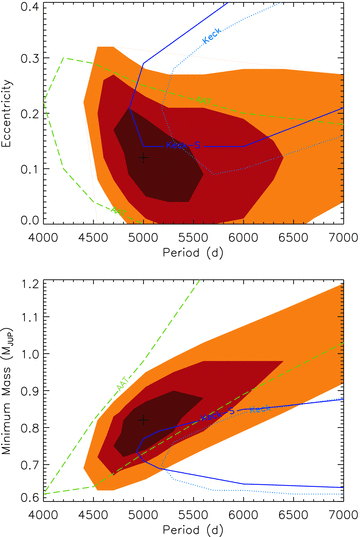
The plots show contours of χ2 for best-fitting orbits to the radial velocity data of HD134987c in period versus eccentricity (upper plot) and period versus mass (lower plot). The solid brown, red and yellow shading indicate the regions where Δχ2 is up to 2.3, 6.2 and 11.8 from the best-fitting minimum χ2. Dashed green and dotted blue lines show the contours for the AAT and Keck data, respectively. For the case of the Keck data a further contour is shown. The dashed–dot–dot–dot contour (dark blue, labelled Keck-S) represents a subset of the Keck data from which velocity values corresponding to 10 per cent of the highest activity values are removed. The position of the cross marks the best-fitting solution for the combined data set.
These plots highlight the asymmetric nature of the confidence regions due to not having a complete orbital period. These fits are made using the systemic package (Meschiari et al. 2009) and assumes no stellar jitter for all data points, however since stellar jitter provides a source of pseudo-random noise which may vary on various time-scales, e.g. unknown stellar rotation time-scale, the noise in the radial velocities may be non-Gaussian. In addition, to the best-fitting χ2 for the joint data set, 1σ contours for the individual AAT (dashed green) and Keck (dotted blue) data sets are shown.
The observing programmes at the AAT and Keck both use the same calibration methodology and follow similar observing and data reduction strategies. A major difference in their operation for a given star is that Keck achieves a given signal-to-noise ratio in a much shorter exposure time. For HD134987, Keck integration times range from 27 s to 10 min, typically 1–2 min long, with a median of 84 s and including 24 measurements of less than a minute. The median of AAT integration times are nearly five times longer (median 400 s) and with a smaller spread in the range of times from 3.3 to 10 min. It is therefore probable that the differences (to the double planet fit) seen at each telescope are the result of their sampling astrophysical noise sources on different time-scales. In order to make the jitter values to achieve a best-fitting reduced χ2 the same for both data sets, it would be necessary for there to be nearly 2 m s−1 of additional astrophysical noise (added in quadrature) present in the Keck, but not the AAT, data.
We investigate the importance of the relatively shorter Keck exposure times in a few different ways. We add velocity jitter to all Keck radial velocity errors corresponding to exposure times of less than 200 s (the shortest exposure time at the AAT). We do this by adding radial velocity jitter of 4.5×(1-texp/200) m s−1. The scaling factor of 4.5 is chosen so as give resultant best fits requiring the same jitter as the AAT (2.3 m s−1) to achieve a best-fitting reduced χ2 of one and is consistent with the higher levels of jitter expected for HD134987c from Wright (2005). However, this procedure as well as removal of the 10 per cent of the data with the shortest exposure times do not significantly alter the Keck solution.
The Keck data allow us to gain more direct insight into the importance of the activity of HD134987. The Keck High Resolution Echelle Spectrograph (HIRES) spectrometer simultaneously covers the Ca ii H&K lines and the iodine region. While activity indices such as CaHK do not provide a one-to-one mapping on to stellar jitter and thus cannot be used as an input error for the radial velocities, these CaHK lines are the primary method of radial velocity jitter estimation (Wright 2005). From an extraction of this activity measure (e.g. Tinney et al. 2002b), the S values for the Keck data are given in Table 3 and plotted with a Gaussian distribution in Fig. 6. This indicates that the distribution of S values is not a particularly good match for a Gaussian. Although the jitter values are the largest source of uncertainty, the assignment of the Gaussian σ confidence limits should be robust due the large number of data points available for the fit. Wright (2005) indicates that in the regime of activity, spectral type and magnitude for different stars in their table 2 for HD134987, there is a factor of 3 difference in radial velocity jitter between 20th and 80th percentile. While this scatter is for different stars we can look at the impact of characterizing the jitter radial velocity signal in terms of a linear function varying by a factor of 3 between the 20th and 80th percentiles found by Wright (2005). For the HD134987 Keck data, this corresponds to assigning radial velocity jitter values up to 6 m s−1. We found that this operation expands the 1σ contours and brings best-fitting solutions to the Keck data set to shorter periods. Alternatively, one can obtain a solution with little expansion in the 1σ contours by ignoring radial velocities with high activity values. Fig. 5 shows 1σ best-fitting contours (dashed-dot-dot-dot) for a Keck data set with the omission of the radial velocity data corresponding to the highest 10 per cent of S values (that lie in the range 0.164–0.182). The removal of these high S values does not lead to much expansion in the 1σ best-fitting contours, removes data points that are spread relatively evenly in time and yields 1σ contours closer to those found for the AAT values.
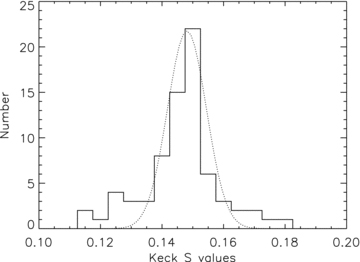
Histogram of S values for the Keck data set plotted with a Gaussian distribution with a full-width half maximum, twice the standard deviation of the S values tabulated in Table 3.
This result that exposure time has less impact on the solution than the S value can be investigated quantitatively for asteroseismological p mode jitter. The methodology of O'Toole, Tinney & Jones (2008) allows the p mode jitter for HD134987 to be derived relatively precisely as a function of exposure time using values from Table 1. This indicates that the Keck data should present no more than around 0.54 m s−1 p mode jitter, compared to a maximum of about 0.36 m s−1 in AAT data. Since these are significantly smaller than the internal errors, the contributions of other stellar jitter noise sources such as granulation and convection (e.g. Bruntt et al. 2005) are presumably significantly larger. While we are not in a position to quantify the exact noise source responsible for the different jitter values, the low and reasonably consistent values of jitter in agreement with stars of similar spectral type and the improved consistency between data sets on removal of easily identifiable high jitter values indicate that a two planet fit to both AAPS and Keck velocity data sets is consistent with our rudimentary jitter expectations. We also note that a periodogram of the Keck S values neither shows any significant periodicities nor any peaks with low false alarm probabilities which we would expect if there was a significant spot-induced radial velocity signal in the Keck data set.
5 PHOTOMETRIC OBSERVATIONS
In addition to the spectroscopic observations described and analysed above, we have also acquired high-precision photometric observations of HD 134987 in seven observing seasons between 1999 March and 2009 June with the T8 0.80 m automatic photometric telescope (APT), one of the seven automatic telescopes operated by TSU at Fairborn Observatory in southern Arizona (Eaton, Henry & Fekel 2003). The APTs can detect short-term, low-amplitude brightness variability in solar-type stars resulting from rotational modulation in the visibility of active regions, such as starspots and plages e.g. Henry, Fekel & Hall 1995b, and can also detect longer term variations produced by the growth and decay of individual active regions and the occurrence of stellar magnetic cycles, e.g. Henry et al. (1995a) and Hall et al. 2009. The photometric observations can help to establish whether observed radial velocity variations are caused by stellar activity or planetary reflex motion, e.g. Henry et al. (2000b). Several examples of periodic radial velocity variations in solar-type stars caused by photospheric spots and plages have been documented by Queloz et al. (2001) and Paulson et al. (2004). The photometric observations are also useful to search for transits of the planetary companions e.g. Henry et al. (2000a) and Sato et al. (2005).
The T8 0.80 m APT is equipped with a two-channel precision photometer featuring two EMI 9124QB bi-alkali photomultiplier tubes to make simultaneous measurements of a star in Strömgren b and y passbands. The APT observes each target star (star D) in a quartet with three ostensibly constant comparison stars (stars A, B and C). From these measurements, we compute b and y differential magnitudes for each of the six combinations of the four stars: D−A, D−B, D−C, C−A, C−B and B−A. We then correct the Strömgren b and y differential magnitudes for differential extinction with nightly extinction coefficients and transform them to the Strömgren photometric system with yearly mean transformation coefficients. Finally, we combine the Strömgren b and y differential magnitudes into a single (b+y)/2 passband to improve the precision of the observations. Henry (1999) presents a detailed description of the T8 automated telescope and photometer, observing techniques, and data reduction and quality-control procedures needed for long-term, high-precision photometry.
The 419 D−C differential magnitudes of HD 134987 are plotted in the top panel of Fig. 7. We chose to analyse the D−C observations for two reasons: (1) they have the smallest standard deviation of the three D−A, D−B and D−C time series, although not by much (0.00266, 0.00264 and 0.00263 mag, respectively), and, more importantly, (2) the D−C time series is one-year longer than the other two because comparison stars A and B had to be replaced after one year due to their variability. The three comparison stars A, B and C are HD 131992 (V= 6.94, B−V= 0.20), HD 137076 (V= 8.26, B−V= 0.41) and HD 135390 (V= 6.47, B−V= 0.69). The standard deviations of the C−A, C−B and B−A differential magnitudes about their means are 0.00297, 0.00308 and 0.00266 mag, respectively, comparable to the three standard deviations for star D (HD 134987) given above. These values are somewhat larger than our typical precision of 0.0015 mag because HD 134987 lies at a declination of −25° and so is observed through high airmass (1.8–2.0). The mean precision of the three HD 134987 differential time series is 0.00 264 mag, while the mean precision of the three comparison star time series is 0.00 290 mag. Therefore, we have not resolved intrinsic brightness variability in HD 134987, and the scatter in the D−C measurements can be accounted for by the APT's measurement precision at high air mass.
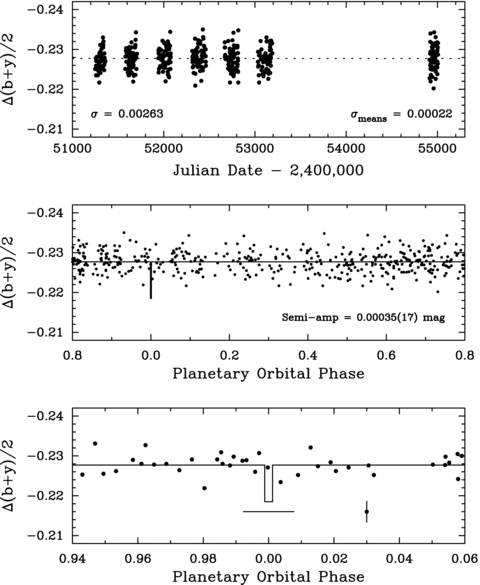
Top panel: the 419 Strom̈gren (b+y)/2 D−C differential magnitudes of HD 134987 plotted against heliocentric Julian Date. The standard deviation of the observations from their mean (dotted line) is 0.00 263 mag. The standard deviation of the yearly means is 0.00 022 mag. Middle panel: the observations plotted modulo the 258.187-d orbital period of the inner planet. Phase 0.0 corresponds to the predicted time of mid-transit. A least-squares sine fit at the orbital period yields a semiamplitude of only 0.00 035 ± 0.00 017 mag. Bottom panel: the observations near phase 0.0 plotted on an expanded scale. The duration of a central transit is 15 h while the uncertainty of the transit time is ±2 d. Our phase coverage is insufficient to determine whether or not companion b transits the star.
Nevertheless, we performed periodogram analyses on all six sets of differential magnitudes and find no significant periodicities between 0.03 and 1000 d. In particular, a least-squares sine fit to the D−C observations phased on companion b's orbital period of 258.187 d gives a semi-amplitude of only 0.00035 ± 0.00017 mag. The low level of magnetic activity in HD 134987 recorded in Table 1 and the lack of detectable photometric variability on the orbital period of companion b confirms that the radial velocity variability (K= 49.5 m s−1) on that period is the result of stellar reflex variability induced by HD 134987b.
The D−C photometric observations plotted in the top panel of Fig. 7 cover a range of 3758 d or 11 observing seasons but with a gap of four seasons. So the photometric observations are too few and the orbital period of HD 134987c too uncertain (5000 ± 338) for the photometry to determine limits of stellar brightness variability on companion c's orbital period. However, we can look at HD 134987's long-term, year-to-year variability for the existing seven observing seasons plotted in Fig. 7. The standard deviation of the seven yearly mean magnitudes about their grand mean is just 0.000 220 mag; the slope of the best-fitting line to the seven means is −0.0000245 ± 0.0000278 mag yr−1. Interestingly, the first six years of our photometry (1999–2004) correspond to the interval when the radial velocity residuals to the 258 d period, plotted in Fig. 4, increased approximately linearly by ∼22 m s−1. The best-fitting line to those six yearly photometric means has a slope of −0.0000376 ± 0.0000599 mag yr−1, which is indistinguishable from zero to high precision. Therefore, the photometric observations also provide strong support for the existence of HD 134987c.
With the 419 nightly APT observations of HD 134987, we examine the possibility of detecting transits of the inner planet. The geometric probability for transits to occur, given HD 134987b's orbital elements in Table 4, is 0.65 per cent, computed from equation (1) of Seagroves et al. (2003). This is a modest improvement over the transit probability (0.52 per cent) for a circular orbit because of the favourable orientation ( ) of the planet's moderately eccentric orbit (e= 0.23). The 419 photometric measurements in the top panel of Fig. 7 are replotted in the middle panel phased with the 258.187 d orbital period. Phase 0.0 corresponds to a predicted time of mid-transit derived from the orbital elements, Ttransit= 2455 027.31. The observations near phase 0.0 are replotted on an expanded scale in the bottom panel of Fig. 7. The solid curve in the two lower panels approximates the depth (0.85 per cent) and duration (15 h) of a central transit, derived from the orbital elements. The horizontal bar below the predicted transit window in the bottom panel represents the ±2 d uncertainty in the time of central transit; the vertical error bar to the right of the transit window corresponds to the ±0.00 263 mag measurement uncertainty of a single observation. It is clear that transits of the inner planet could be detected with the APT, but our phase coverage is insufficient to determine whether or not they occur.
6 DISCUSSION
At a distance of 22 pc, HD 134987 is one of the more nearby exoplanetary systems. The combination of the close distance and long period indicates a relatively large angular distance from the star of ≳0.23 arcsec for an edge-on circular orbit. Such an angular separation will be accessible to the typical 0.2 arcsec figure of merit for a current and foreseen high resolution imaging systems on 8 m class telescopes. Only eight other radial-velocity-discovered exoplanets currently exceed a maximum angular separation of 0.2 arcsec. They are ε Eridani b (Hatzes et al. 2000), GJ832b (Bailey et al. 2009), 55 Cnc d (Marcy et al. 2002), HD160691e (McCarthy et al. 2005), GJ849b (Butler et al. 2006b), HD190360b (Naef et al. 2003), 47Uma c (Fischer et al. 2002), HD154345b (Butler et al. 2006b). Notably, three-quarters of these have been detected using data from the Keck or AAT. Despite this promising separation for direct detection, evolutionary models indicate that the contrast ratio of HD134987c with its host star will make this a challenging observation. Models from Baraffe et al. (2003) suggest a 5 Gyr, 2 MJup exoplanet at 22 pc will have an H-band magnitude of around 35. This will be beyond the reach of even the next generation of high resolution instruments. Nevertheless, it should be noted that this estimate is based on the minimum mass (sin i= 1) for HD 134987c. Both an inclined orbit, and a longer period (which is plausible given the relatively poorly determined period at present) will lead to a larger mass and improved detectability for HD134987c. So, imaging observations will be useful to constrain possible orbits and masses of HD 134987c.
Detection of the astrometric signal from HD 134987 c is more plausible. The astrometric orbit semimajor axis is α sin i≳ 0.19 mas, which is comparable to the 0.25 ± 0.06 mas astrometric orbit determined by Benedict et al. (2002) for GJ 876b. An astrometric orbit would enable the inclination to be determined, removing the current sin i uncertainty on the mass.
HD134987 joins the family of stars with multiple planets. It appears to be consistent with the broad general properties for multiple planets suggested by Wright et al. (2009). For example, its metallicity of +0.25 is close to that of the mean for exoplanets with long-term trends (+0.20) or multiplanet systems (+0.15, Wright et al. 2009) and the eccentricities of its planets (0.12 and 0.23) are somewhat lower than the 0.25 mean for all exoplanets (excluding tidally circularized ones) and its planetary masses of close to 1MJup (the approximate dividing line in mass between higher and lower multiple-planet eccentricities). From a conservative analysis of exoplanet signals requiring an extra trend to adequately fit the data set, Wright et al. (2009) suggest that >28 per cent of exoplanets are in multiple systems, a finding likely to be consistent with the AAPS data set. In order to assess the actual value, it will be necessary to assess the detectability of such trends using simulations such as those presented by O'Toole et al. (2009b,c) and Wittenmyer et al. (2009).
The fit to HD134987c indicates a relatively small semi-amplitude (∼10 m s−1) in comparison to most of the other long-period exoplanets announced to date. Fig. 8 indicates that the orbital solution for HD134987c is rather more reminiscent of Jupiter than other exoplanets discovered to date. With a longer semimajor axis than Jupiter and similar eccentricity, the discovery of HD134987c signals that we have sensitivity to radial velocity planets with Jupiter-like periods around Sun-like stars. As the second decade of data is now being gathered by the AAT and Keck Telescopes, we can be confident that our long-term precision is sufficient to empirically constrain the incidence of exoplanets with Jupiter-like periods around Sun-like stars. This will enable us to ascertain just how common our Solar system might be and be able to make comparison with developing theoretical predictions (e.g. Mordasini et al. 2009). As our temporal baseline extends, we will become sensitive to longer period planets, e.g. a true Saturn analogue would require 15 more years of observation to fully sense. As our data set improves, we will become sensitive to lower mass longer period exoplanets, which migration scenarios for planets around solar-type stars suggest is a rich domain (e.g. Schlaufman, Lin & Ida 2009).
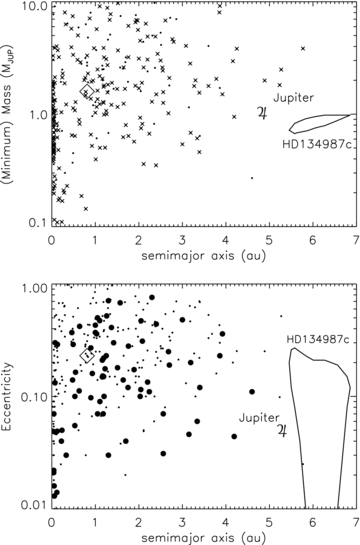
All exoplanets as recorded at http://exoplanets.eu on 2009 October 27 with planet and star masses, semi-major axes and eccentricity are included as small filled circles. The majority of data in the plots are for radial velocity discovered exoplanets and are included as M sini values and so most but not all are minimum mass values. The upper plot shows semimajor axis as a function of planet mass. Those labelled with crosses have primary masses within 25 per cent of the Sun. Jupiter's position is marked by the traditional mythological symbol. Jupiter's semimajor axis and eccentricity are plotted as 5.20 au and 0.0489, respectively, from the Astronomical Almanac (2000). The best-fitting orbit for HD134987b is indicated by diamonds with the 2σ best-fitting contour for HD134987c orbit. In the lower plot points plotted as large filled circles are those whose ratios of planet mass to star mass fall within 50 per cent of that of Jupiter and the Sun.
We thank the Anglo-Australian and Keck time assignment committees for continuing allocations of telescope time. We are grateful for the extraordinary support we have received from the AAT technical staff – E. Penny, R. Paterson, D. Stafford, F. Freeman, S. Lee, J. Pogson, S. James, J. Stevenson, K. Fiegert and W. Campbell. The work herein is based on observations obtained at the W. M. Keck Observatory, which is operated jointly by the University of California and the California Institute of Technology, and we thank the UC-Keck and NASA-Keck Time Assignment Committees for their support. We gratefully acknowledge the UK and Australian government support of the Anglo-Australian Telescope through their PPARC, STFC and DETYA funding (HRAJ, CGT); NSF grant AST-9988087, NASA grant NAG5-12182, STFC grant PP/C000552/1, ARC Grant DP0774000 and travel support from the Carnegie Institution of Washington (to RPB) and from the Anglo-Australian Observatory (to CGT, BDC and JB). SSV gratefully acknowledges support from NSF grant AST-0307493. GWH acknowledges support from NASA, NSF, Tennessee State University, and the state of Tennessee through its Centers of Excellence program. This research has made use of the SIMBAD and exoplanet.eu data bases, operated at CDS, Strasbourg and Paris Observatory respectively. We also wish to extend our special thanks to those of Hawaiian ancestry on whose sacredmountain of Mauna Kea we are privileged to be guests. Without their generous hospitality, the Keck observations presented herein would not have been possible. The referee is thanked for making a number of valuable suggestions which led to substantial improvements in the paper.
REFERENCES
