


Abstract
We present a thorough literature study of the most-massive star, mmax, in several young star clusters in order to assess whether or not star clusters are populated from the stellar initial mass function (IMF) by random sampling over the mass range 0.01 ≤m≤ 150 M⊙ without being constrained by the cluster mass, Mecl. The data reveal a partition of the sample into lowest mass objects (Mecl≤ 102 M⊙), moderate mass clusters (102 M⊙ < Mecl≤ 103 M⊙) and rich clusters above 103 M⊙. Additionally, there is a plateau of a constant maximal star mass (mmax≈ 25 M⊙) for clusters with masses between 103 M⊙ and 4 × 10³ M⊙. Statistical tests of this data set reveal that the hypothesis of random sampling from the IMF between 0.01 and 150 M⊙ is highly unlikely for star clusters more massive than 102 M⊙ with a probability of p≈ 2 × 10⁻⁷ for the objects with Mecl between 102 and 103 M⊙ and p≈ 3 × 10⁻⁹ for the more massive star clusters. Also, the spread of mmax values at a given Mecl is smaller than expected from random sampling. We suggest that the basic physical process able to explain this dependence of stellar inventory of a star cluster on its mass may be the interplay between stellar feedback and the binding energy of the cluster-forming molecular cloud core. Given these results, it would follow that an integrated galactic IMF (IGIMF) sampled from such clusters would automatically be steeper in comparison to the IMF within individual star clusters.
1 INTRODUCTION
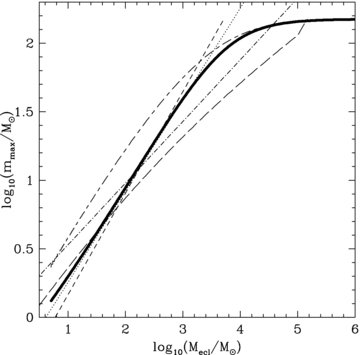
Different relations between the most-massive star and the cluster mass from observations, numerical calculations and theoretical modelling from the literature. The dash–dotted line marks the empirical relation by Larson (2003), the long-dashed line is the Elmegreen (1983) relation, the short-dashed line is the Elmegreen (2000) relation, the dotted line shows the Bonnell et al. (2003) relation, the short-dashed–long-dashed line is the Oey & Clarke (2005) relation and the thick-solid line is the analytical model of Weidner & Kroupa (2004). See text for more details.
Including a fundamental upper mass limit for stars, mmax*= 150 M⊙2 in equations (2) and (3), and using the canonical multipart power-law IMF (Appendix A) Weidner & Kroupa (2004) found the relation visible as a thick-solid line in Fig. 1.
As evident from Fig. 1 these studies arrive at a rather large range of possible mmax–Mecl relations. Weidner & Kroupa (2006) re-investigated this question by compiling a larger number of observational results from the literature and extensive Monte Carlo experiments of different sampling algorithms and found evidence that there exists a non-trivial relation between the mass of a star cluster and the most-massive star in the cluster, a result in principle confirmed by Selman & Melnick (2008). But they conclude that the Weidner & Kroupa (2006) sample is biased by a size-of-sample effect. Furthermore, in the recent literature several claims have been made against such a relation arguing instead for a pure random sampling from the IMF in individual star clusters (Oey, King & Parker 2004; de Wit et al. 2005; Elmegreen 2006; Parker & Goodwin 2007; Maschberger & Clarke 2008; Selman & Melnick 2008). de Wit et al. (2004, 2005) find upto 4 per cent of non-runaway (less than 30 km s−1 space motion) O stars in isolation with no apparent cluster around them or within their lifetime if they would have been ejected from a cluster with a velocity of 6 km s−1– indicating they formed outside a cluster. This result would of course be irreconcilable with a relation between the mass of the most-massive star and the mass of its parent star cluster as has been pointed out by Parker & Goodwin (2007) and Selman & Melnick (2008). While Selman & Melnick (2008) argue that the sample used in Weidner & Kroupa (2006) is biased against random sampling, Parker & Goodwin (2007) find that the observed 4 per cent of allegedly isolated O stars would agree with random sampling from a cluster number distribution function which scales with N2, where N is the number of stars in a cluster. But it should be noted here that the de Wit et al. (2005) result is an upper limit for O stars formed in isolation and that more in-depth observations might reduce this sample. For example, HD 165319, an O9.5 I star from the de Wit et al. (2005) sample of 11 stars which are indicated there as one of ‘the best examples for isolated Galactic high-mass star formation’ has a bow-shock front and is therefore a star ejected from a star cluster, possibly NGC 6611 (Gvaramadze & Bomans 2008). Additionally, according to Schilbach & Röser (2008) further six of the remaining 10 stars are at distances to star clusters only slightly larger than what they may have travelled during their expected lifetimes. But the current large errors of the space motion of these stars do not allow to constrain the birth places of them.
A non-trivial mmax–Mecl relation, and therefore whether or not the stars in star clusters are randomly sampled from the IMF, would also give more insight and understanding of the process of star formation. The formation of massive stars (>10 M⊙) is still not well understood with at least two competing theories (competitive accretion versus single star accretion) having been developed (Bonnell, Bate & Zinnecker 1998; Bonnell et al. 2004; Bonnell & Bate 2006; Tan, Krumholz & McKee 2006; Krumholz et al. 2009). An mmax–Mecl relation could imply that the bulk of the low-mass stars form first and the high-mass stars later. The combined feedback of the massive stars would then halt further star formation.
Here, we will show that the observed distribution of the mass, mmax, of the most-massive star in a star cluster cannot be drawn randomly from the IMF for clusters more massive than 100 M⊙, but there must exist a physical relation between mmax and the birth stellar mass of the cluster, Mecl (the stellar content before gas expulsion but after cessation of star formation).
2 THE DATA
2.1 Sample construction
In order to construct a sufficiently large observational sample to test whether random sampling from the IMF is an acceptable model in star clusters, the available literature was searched for star clusters which are young enough to not to have experienced supernova events and are dynamically rather un-evolved. For the latter, the star clusters should still be embedded in their natal gas cloud or at least be very young, such that gas expulsion would not have effected them strongly (Lada, Margulis & Dearborn 1984; Goodwin 1997; Kroupa, Aarseth & Hurley 2001; Bastian & Goodwin 2006; Goodwin & Bastian 2006; Pellerin et al. 2006; Weidner et al. 2007; Wang et al. 2008). Therefore, only clusters younger than 4 Myr have been included in our sample. Additionally, the young age limits the amount of mass-loss experienced by massive stars due to stellar evolution.
An allegedly suitable sample of objects discussed by Parker & Goodwin (2007) and Maschberger & Clarke (2008) is the one compiled by Testi et al. (1997), Testi, Palla & Natta (1998, 1999) as these authors were explicitly searching for clusters around young A and B stars. We do not use the majority of the clusters from these studies for the following reasons: (a) the majority are too old (>4 Myr for 25 of 35 objects) or they are (b) gas free. The age limit imposed here is given by the short lifetime of massive stars and to limit stellar mass loss of the massive stars. Completely gas-free objects are unsuited for the task of this work as gas expulsion will remove large amounts of stars and therefore reduce the mass of the cluster, Mecl, significantly (Kroupa et al. 2001; Weidner et al. 2007). The exception are four objects which this sample has in common with the near infrared study of young star-forming regions by Wang & Looney (2007) and which are all included in our study. Based on similar arguments Maschberger & Clarke (2008) also excluded the Testi et al. (1997, 1998, 1999) sample from their final statistical analysis.
A very recent additional sample is provided by Faustini et al. (2009). The authors study 26 high-luminosity IRAS sources and find that 22 of them show evidence for clustering. They model nine of these clusters in order to derive cluster masses and the mass of the most massive stars. This sample is included in our study too. But because the results are based on modelling, different symbols for them are used in subsequent plots. Faustini et al. (2009) conclude that the masses of the most-massive star in these clusters are also not reconcilable with random sampling of the stars from the IMF.
2.2 Mass of a cluster versus number of stars in a cluster
The claim has been made (Parker & Goodwin 2007; Maschberger & Clarke 2008) that the number of stars within a star cluster, Necl, gives a better statistical description of the cluster compared with the cluster mass, Mecl, because Necl is an observed quantity and statistically more easily manageable. This is, however, not entirely true as observational biases handicap Necl to a larger extent than Mecl. As the lower mass limit of the observations depend on telescope time, distance of the object, reddening and observed colour range, the different clusters have to be normalized to the same lower mass limit in order to make them comparable. This is done for Necl in the same way as for Mecl– by extrapolating the stars in the observed mass range to a general mass range (0.01–150 M⊙ in this study) with the use of an IMF. Therefore, Necl is not an observed quantity but an estimated one. But the sources for potential error are much larger in the case of Necl than compared with Mecl, as the observed number of stars gives every star the same statistical weight, regardless if it is an M dwarf or an O supergiant. But low-mass stars and brown dwarfs are easy to miss due to being faint but also due to unresolved binarity and crowding of stars (Maíz Apellániz 2008; Weidner, Kroupa & Maschberger 2009). Very young low-mass pre-main sequence (PMS) stars and brown dwarfs are still difficult to model because they are dominated by the unknown accretion history, and magnetic fields and fast rotation have a strong influence (Chabrier, Gallardo & Baraffe 2007; Ribas et al. 2008). Therefore is the observational lower mass limit highly model-dependent and has large errors. Because the IMF is dominated in number by low-mass objects (85 per cent of all stars are below 0.5 M⊙ for the IMF described in Appendix A) uncertainties in the lower mass limit severely affect the Necl estimate. The mass, Mecl, in contrast is far easier to estimate by the number of high-mass stars (Maíz Apellániz 2009). Likewise, the stellar evolution models of massive stars still include large uncertainties. As in the case of low-mass stars, the effects of fast rotation and magnetic fields in these stars are not well understood. Massive stars are small in numbers (6 per cent of all stars are above 1 M⊙) but dominate the cluster in mass (50.7 per cent of the total mass is in stars above 1 M⊙ for a cluster comprised of 0.01–150 M⊙ objects according to the canonical IMF as described in Appendix A). Because of the intrinsic brightness of these objects, they are easy to access observationally and difficult to miss. While the binary frequency might be lower for low-mass stars (∼35 per cent) compared to massive stars (20–80 per cent, Garmany, Conti & Massey 1980; García & Mermilliod 2001; De Becker et al. 2006; Lucy 2006; Apai et al. 2007; Kiminki et al. 2007; Sana et al. 2008; Turner et al. 2008; Weidner et al. 2009), the effect of unresolved binaries is smaller for the mass estimate than for the number estimate. If all stars were in unresolved binaries, Necl would miss 50 per cent of the stars while Mecl would miss only 16–30 per cent, depending on the mass-ratio distribution (Weidner et al. 2009). We therefore choose to study mmax in dependence of Mecl rather than Necl.
2.3 Additional issues
If gas-expulsion already starts early on, before the explosion of supernovae, even the young objects presented here might be affected by mass loss due to the unbinding of stars from the cluster.
One possible additional effect which might deplete very young star clusters especially from massive stars is dynamical ejections after stellar encounters in the dense decoupled cores of massive clusters (Clarke & Pringle 1992; Pflamm-Altenburg & Kroupa 2006). Unfortunately, this effect is impossible to avoid or to correct for reliably and might lead to an additional underestimation of the cluster masses, but it is unlikely that the most-massive star is ejected from the cluster.
Already in Weidner & Kroupa (2006), a first set of young star clusters and their most massive stars were presented. In the current contribution the Weidner & Kroupa (2006) list is included, corrected for a few errors and significantly expanded. The sample of 100 both new and previously published star clusters is shown as Table B1 in Appendix B. The table shows two mass values for the mass of the most-massive star. The one in Column 3 is based on the Vacca, Garmany & Shull (1996) spectral class to stellar mass conversion. In Column 4, additionally, a new spectral class to mass conversion is used. It is based on Martins, Schaerer & Hillier (2005) and Martins & Plez (2006) who provide two new transformations of O-star spectral types into masses, which are both rather similar. One is based on a theoretical effective temperature scale and the other on an observational one. The authors note that their new calibration should represent a significant improvement over previous calibrations, due to the detailed treatment of non-local thermodynamic equilibrium line blanketing in their calculations. Using the new transformation based on the theoretical effective temperature scale (table 1 in Martins et al. 2005), all the clusters with O stars (m≳ 16 M⊙) in Table B1 are re-examined. The resulting new spectral masses are corrected for stellar evolutionary effects (Weidner 2009) and the new masses for the most-massive stars are compiled in Column 4 of the same table. The difference between the old and the new calibration is visualized in Fig. B1 in Appendix B. As is shown there, in all but four cases the new calibration results in stellar masses significantly lower than the old values. Note that the new calibration by Martins et al. (2005) is only provided up to a spectral type of O3. This might not include the most massive stars observed but no general consensus exists in spectral classifying of extremely massive stars. While, traditionally they would be of spectral type O3 some classify them as spectral type O2 or even earlier (Walborn et al. 2002) while others prefer a Wolf–Rayet star classification (for example WN6h; Crowther 2007). In these cases the corrected values based on the Crowther (2007) Wolf–Rayet scheme in Weidner (2009) are used.
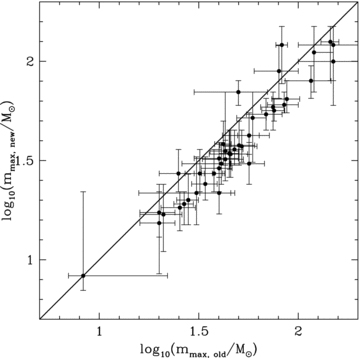
The values for the O-star masses from the old calibration on the abscissa versus the newly calibrated ones on the ordinate. The thick solid line indicates were both values would be the same.
An additional complication in the determination of the masses of the most-massive stars is due to possible binary stellar evolution (BSE). Massive stars are often found in close binaries of rather similar masses (Weidner et al. 2009) and therefore BSE might have affected the evolution and hence the observational parameters of the stars (Wijers, Davies & Tout 1996; Tout et al. 1997; Hurley 2003; Zhang et al. 2005).
Except for a few cases the cluster masses are derived by extrapolating from the given number of stars above a certain mass limit or within certain limits to a mass range of 0.01–150.0 M⊙ with a canonical IMF (see Appendix A).
Several cluster masses given in Carpenter et al. (1993) are used as lower limits only in this study because of incompleteness and uncertain differential reddening.
In Appendix C, notes on some individual clusters can be found.
2.4 Dynamical masses
In recent years, observational techniques allowed to measure masses of very massive stars directly by observing the orbits of massive eclipsing binaries. In Table 1, the dynamical mass estimates for six very massive stars are compared with old and new spectroscopic estimates. Two of these six stars (WR20a A and Θ Orionis C1) happen to be the most massive stars in two clusters (Westerlund 2 and M42). Also shown in Table 1 are the initial masses for these stars, mini new, derived by matching the luminosity and effective temperature of the newly calibrated O star spectral types by Martins et al. (2005) with the values from the Meynet & Maeder (2003) rotating stellar evolution models for massive stars (for details see Weidner 2009). Generally, the new spectroscopic mass estimates from the new calibration agree much better with the dynamical masses than the old spectroscopic mass estimates. For the analysis done in this work for WR20a A and Θ Orionis C1, the dynamical masses are used for the old calibration and mini new for the new one.
For these massive stars in star clusters dynamical mass estimates exist from the orbits of binaries.
| Cluster | Star | Sp Type | mdynamical M⊙ | mold M⊙ | mnew M⊙ | mini new M⊙ | Ref. |
| Trumpler 14/16 | FO15B | O9.5V | 16.0 ± 1.0 | 23.3 ± 2.0 | 16.5 ± 1.5 | 17.9 −3.9/+3.1 | (1) |
| Trumpler 14/16 | FO15A | O5.5V | 30.0 ± 1.0 | 50.4 ± 6.0 | 34.2 ± 3.0 | 37.7 −3.7/+7.3 | (1) |
| M42 | Θ Orionis C1 | O6Vpe | 35.8 ± 7.2 | 45.0 ± 5.0 | 31.7 ± 6.0 | 34.3 −4.3/+4.7 | (2) |
| Trumpler 14/16 | HD93205A | O3V | 56.0 ± 4.0 | 87.6 ± 12.0 | 58.3 ± 10.0 | 64.6 −4.6/+5.4 | (3) |
| Westerlund 2 | WR20a A | WN6ha | 82.7 ± 5.5 | - | - | 121.0 −41.0/+29.0 | (4) |
| NGC3603 | NGC3603-A1 | WN6ha | 116.0 ± 31 | 120.0 ± 15.0 | - | 121.0 −41.0/+29.0 | (5) |
(1) Niemela et al. (2006), (2) Kraus et al. (2009), (3) Morrell et al. (2001), (4) Nazé et al. (2008), (5) Schnurr et al. (2008).
2.5 The cluster sample
Table B1 in Appendex B includes the Weidner & Kroupa (2006) sample of most-massive stars in star clusters together with the new entries compiled here from the literature. Fig. 2 shows the most-massive star versus star-cluster mass relation from this table using the old stellar masses for the O stars. Furthermore, the figure shows the theoretical analytic result (the thick solid line) from Weidner & Kroupa (2004), which numerically solves equations (2) and (3) but with the canonical multipart power-law IMF and assuming a fundamental upper mass limit for stars, mmax*= 150 M⊙ to arrive at a relation for mmax=fana(Mecl).
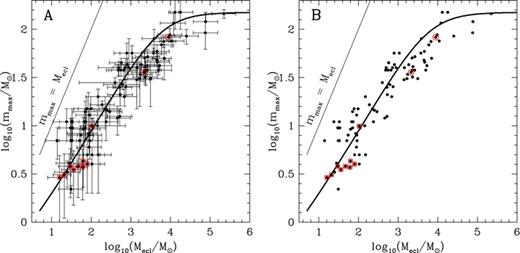
Plot of the most-massive star versus star-cluster mass data using the literature values for the stellar masses and the old effective temperature scale calibration for O stars. Panel A: with error bars and Panel B without error bars. The thick solid line represents the analytic model from Weidner & Kroupa (2004), see also Fig. 1. The literature values with circles around them have dynamical mass estimates for the most-massive star while the ones with boxes are the sample of Faustini et al. (2009) for which the masses of the most-massive stars are only indirectly calculated. The thin solid line marks the identity when a cluster is made of only one star.
The masses of the most-massive stars derived from the new spectral type to mass conversion are shown in Fig. 3 together with the same lines as in Fig. 2.
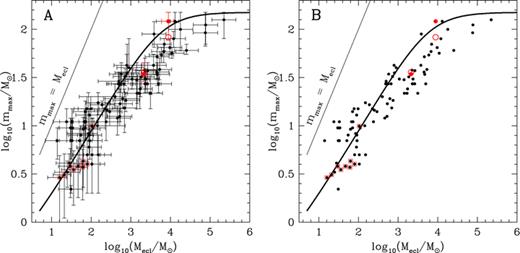
Like Fig. 2 but using the new effective temperature-scale calibration for O stars from Martins et al. (2005) corrected for evolutionary effects to initial masses (Weidner 2009). Panel A: with error bars and Panel B without error bars. The dynamical mass estimates are shown only as open circles as the evolutionary corrected initial masses are used for the actual analyses.
2.5.1 Errors
The error bars for Mecl in Table B1 are either directly taken from the respective literature source or by assuming an uncertainty of 100 per cent in the number of observed stars. For mmax, the errors are again taken either directly from the literature or the spectral type is converted to mass by the Vacca et al. (1996) tables for Column 3 and Martins et al. (2005) for Column 43 and the spectral subtype +1 and −1 is used as the upper and lower limit for the stellar mass,4 respectively. The errors in the distance and age are from the literature only.
3 STATISTICAL ANALYSES

 being the probability density distribution and ξ(m) the IMF as described in Appendix A.
In order to get the number of stars, N, required for equation (7) for a given cluster with Mecl, an array of cluster masses between 5 M⊙ and 106 M⊙ is divided by the mean mass, mmean, of the IMF. For the IMF used here (see appendix A for details) mmean= 0.36 M⊙, if mmin= 0.01 M⊙ and mmax*= 150 M⊙.
Fig. 4 shows the distribution obtained by random sampling (equation 7) for two examples of N= 278 (dash–dotted line) and N= 11111 (solid line). For each N, the five statistical values are calculated.
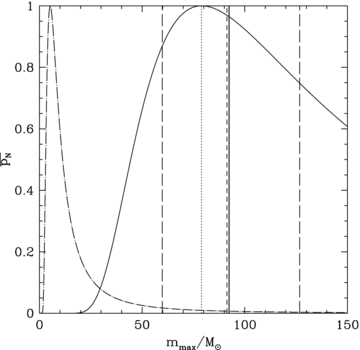
The solid line shows the distribution of the most-massive star for N= 11111 (Mecl≈ 4000 M⊙) and the dash–dotted line is the same for N= 278 (≈100 M⊙) according to equation (7). In this plot, pN is normalized to 1 at the most common (mode) value in order to give both curves the same height. For the N= 11111 case, the following statistical properties are also shown: the vertical dotted line is the mode, the vertical dashed line is the median, the vertical solid line is the expectation value and the two vertical long-dashed lines mark the 1/6th and 5/6th quantiles. See text for further details.
The arithmetic mean or expectation value, marked as a solid vertical line for the N= 11 111 case in Fig. 4, is the sum of all most-massive stars divided by the number of clusters.
The mode value (dotted vertical line in Fig. 4) marks the most common value (the peak in Fig. 4) of the distribution.
The median value (dashed vertical line in Fig. 4) is the value which divides the distribution in two. 50 per cent of the values are above the median while 50 per cent are below.
The 1/6th quantile (the left long-dashed vertical line in Fig. 4) is the value below which 1/6th of data points lie.
The 5/6th quantile (the right long-dashed vertical line in Fig. 4) is the value above which 5/6th of data points lie.
The 1/6th and 5/6th quantiles define the region within which lie two thirds of the most-massive stars lie for random sampling of stars from the IMF (equation 7).
3.1 Completeness of the sample
The completeness of the cluster sample presented here strongly depends on the total number of star clusters expected for the Milky Way (MW) which are younger than 4 Myr. This depends on the assumed current star-formation rate (SFR) of the MW (0.8–13 M⊙ yr−1; Diehl et al. 2006, and references therein), the slope of the embedded cluster mass function (β= 1.8–2.3; Lada & Lada 2003), where dNecl=M−βecl dMecl is the number of just formed embedded clusters with stellar mass in the interval Mecl, Mecl+ dMecl, and the assumed lower mass limit for star clusters (5–100 M⊙; Weidner & Kroupa 2006). With the observationally favoured parameters being SFR= 4.0 M⊙ yr−1, β= 2.0 and Mecl min= 5 M⊙. The total number of young star clusters in the MW lies therefore between 104 and 106 clusters. The majority of these have masses less than 100 M⊙ and any surveys of them are severely incomplete. For a completeness estimate, we therefore restrict ourselves to clusters more massive than 1000 M⊙ as they are far fewer in numbers and more easily identified in the MW. For the whole range of parameters of the MW the number of young star clusters more massive than 1000 M⊙ lies somewhere between 160 and 4452, with 1478 being the value for the observationally favoured parameters. The sample shown in Table B1 includes 30 (−5/+6) clusters which are in the MW and more massive than 1000 M⊙ within the uncertainties. This suggests that between 18.8 per cent (−3.1/+3.7) and 0.7 per cent (±0.1) of all such clusters are in the sample, with 2.0 per cent (−0.3/+0.4) for the favoured parameters. Therefore, one has to keep in mind that any statistical results are possibly limited by the incompleteness of the cluster sample.
3.2 Statistical tests
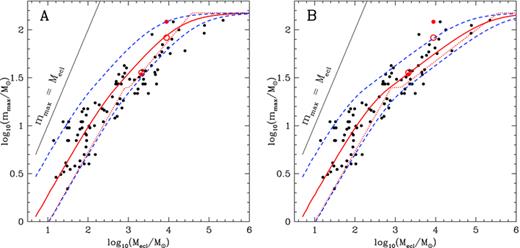
In panel A of Fig. 5 the mode, mean, median and 1/6th and 5/6th quantiles for a fundamental upper mass limit of mmax*= 150 M⊙ are shown together with the data points from Column 4 and the clusters from Column 3 from Table B1 which have not been changed by the recalibration.
Panel A: most-massive star versus cluster mass. The dots are the observed values from Column 4 from Table B1. The two open circles indicate existing dynamical estimates for the present-day mass of the most-massive stars. The boxed data are from the sample of Faustini et al. (2009). The dotted line refers to the mode value for random sampling, the short-dashed line to the median value, the curved solid line marks the mean value and the two long-dashed lines are the 1/6th (lower) and 5/6th (upper) quantiles between which 2/3rd of the data points should lie if they were randomly sampled from the IMF over the mass range 0.01 M⊙ to mmax*= 150 M⊙. The thin solid line to the left marks the identity where the cluster is made-up only of one star. Panel B: the same as Panel A but assuming a fundamental upper mass limit for stars of mmax*= 50 M⊙ instead of 150 M⊙.
Three different statistical tests are applied to the data in order to verify whether or not the observed most-massive stars are consistent with being randomly drawn from the IMF.
3.2.1 Percentage of stars between the 1/6th and 5/6th quantiles
As is visible in this Fig. 5, there is a general change in behaviour of the data points around a cluster mass of about 100 M⊙ and around 1000 M⊙ with respect to what is expected from random sampling. Below the 100 M⊙ limit the data show a larger spread while above 1000 M⊙ the slope of the mmax–Mecl relation changes. Panel A of Fig. 6 shows the percentage of the most-massive stars within the 1/6th and 5/6th quantiles in three samples, one for the clusters below 100 M⊙, one for the clusters between 100 and 1000 M⊙ and one for the ones above 1000 M⊙. Additionally, the figure shows the same numbers for different assumptions on the fundamental upper mass limit (mmax*) for stars. Here, the clusters above 1000 M⊙ (filled and open triangles) are far below the 2/3rd range which would be expected from random sampling. The clusters below 100 M⊙ (filled and open circles) and the intermediate clusters (100–1000 M⊙, filled and open squares) are very tightly within the 1/6th and 5/6th quantiles. About 90 and 78 per cent of the clusters are within the range, respectively. In Panel B of Fig. 6, the same is shown but including the error bars for mmax and Mecl from Table B1 by making the same calculations as before but using the minimal and maximal values for mmax and Mecl. The low-mass clusters are still more tightly distributed within the 1/6th and the 5/6th quantiles than expected. The intermediate- and high-mass clusters seem to be consistent with random sampling when the maximum effect of the errors is applied to the data.
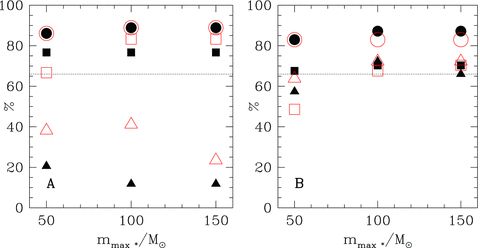
Percentage of most-massive stars within the 1/6th to 5/6th quantiles for three different assumptions of the fundamental upper mass limit, mmax*, of 50, 100 and 150 M⊙. Solid symbols refer to the new O-star calibration in Table B1 and open symbols to the old one. Circles mark the percentages for clusters below 102 M⊙ while squares are for 100 < Mecl≤ 103 M⊙ and triangles mark clusters more massive than 103 M⊙. Panel A: these values do not take into account the errors in Mecl and mmax in Table B1 while in panel B these errors are included. The horizontal dotted line at 66 per cent marks the fraction of stars that ought to lie between the 1/6th and 5/6th quantiles if random sampling between 0.01 M⊙ and mmax* was true.
3.2.2 Distribution around the Median
Also important is the distribution of the mmax obs values around the median of the expected distribution for random sampling. The median is the statistical value for which 50 per cent of the data should lie above and below. For the whole sample, 25.7 per cent are above the median and 74.3 per cent below if one uses the new Martins et al. (2005) O-star mass scale and assumes a fundamental upper mass limit of mmax*= 150 M⊙. In the subsample of clusters below 100 M⊙, there are 56.8 per cent above and 43.2 per cent below the median, for the clusters with 100 < Mecl≤ 1000 M⊙ there are 13.3 per cent above and 86.7 per cent below the median, while for the high-mass clusters 2.9 and 97.1 per cent are above and below the median, respectively. In Fig. 7, the distribution of mmax median–mmax obs new is shown for the whole cluster sample (Panel A) and for the clusters below 103 M⊙ (Panel B). For the old O-star mass scale, the distribution is shown in Fig. 8. The percentages in the case of the old O-star mass scale are 35.6/64.4 per cent for the total sample and 56.8/43.2, 40.0/60.0 and 8.8/91.2 per cent for, respectively, the clusters below 100 M⊙, the clusters with 100 < Mecl≤ 1000 M⊙ and the clusters above 103 M⊙.
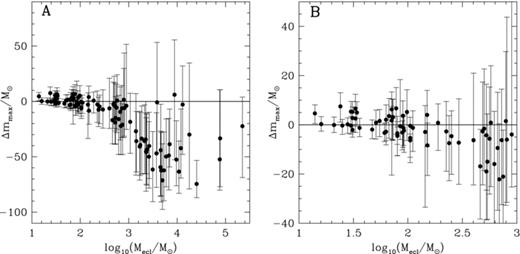
Distance of the observed most-massive star from the expected median for random sampling up to mmax*= 150 M⊙. Here, the new Martins et al. (2005) mass scale is used for O stars. Panel A show the whole sample while panel B contains only the clusters below 103 M⊙. For random sampling over the mass range 0.01–150 M⊙ the data ought to be distributed symmetrically about Δmmax= 0.
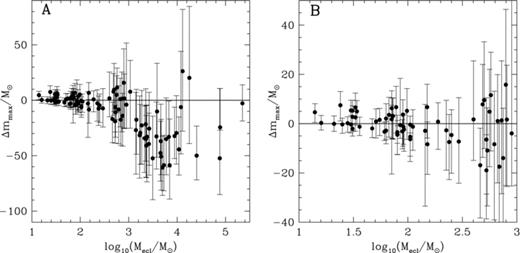
Like Fig. 7 but for the old O-star calibration.
3.2.3 Wilcoxon Signed-Rank Test
The Wilcoxon signed-rank test (Bhattacharyya & Johnson 1977)5 tests whether or not the data are consistent with being symmetrically distributed around the median. It reveals for the new calibration a probability.6p(Mecl≤ 100 M⊙) of 0.014 for clusters with masses smaller or equal to 100 M⊙, a p(100 M⊙ < Mecl≤ 1000 M⊙) of 1.9 × 10⁻⁷ for cluster masses between 100 and 1000 M⊙ and a p(Mecl > 1000 M⊙) of 2.8 × 10⁻⁹ for the clusters above 1000 M⊙. For the old calibrations the probabilities are p(Mecl≤ 100 M⊙) = 0.014, p(100 M⊙ < Mecl≤ 1000 M⊙) = 0.035 and p(Mecl > 1000 M⊙) = 1.2 × 10⁻⁸.
3.3 Dependence on the high-mass IMF slope
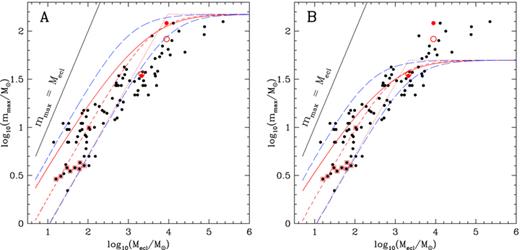
The general assumption in this paper, that the stars in a star cluster follow a universal IMF which is characterized by a Salpeter/Massey slope of 2.35 for all stars above 0.5 M⊙, is strongly supported by almost all observational evidence (see Appendix A for a list of references). However, if the IMF slope for high-mass stars is steeper than 2.35, it is not sure whether or not a fundamental upper mass limit exists, as was pointed out by Oey & Clarke (2005). Fig. 9 shows the mean, median, mode, 1/6th and 5/6th quantiles for two different assumptions of the high-mass slope of the IMF. In Panel A, the slope for stars more massive than 25 M⊙ is changed to α3= 3.0 and in Panel B to α3= 4.1, while α2= 2.35 for stars between 0.5 and 25 M⊙ in both cases. 25 M⊙ was chosen because it is the mmax value of the plateau like feature for clusters with masses between 103 and 4 × 10³ M⊙. Only for a slope as steep as α3= 4.1 are 50 per cent of stars above and below the median. A slope steeper than α3= 3.7 is needed in order to have more than 60 per cent of the stars within the 1/6th and 5/6th quantiles. Such steep slopes for the high-mass IMF within star clusters are clearly ruled out by the current state of observations (Massey 1998; Elmegreen 1999; Kroupa 2001; Larson 2002b).
Like Fig. 5 but the IMF slope above 25 M⊙ is 3.0 (Panel A) and 4.1 (Panel B) instead of the Salpeter value of 2.35. The solid line is the median, the dotted line is the mode and the dashed lines are the 1/6th (lower) and the 5/6th (upper) quantiles.
3.4 Dependence on the environment
Very recently, Pfalzner (2009) studied the dissolution behaviour of young (1–20 Myr) massive star clusters (2000–50 000 M⊙). She found that her sample of 23 clusters can be divided into two groups, loose clusters (Recl > 1 pc) and tight clusters (Recl < 1 pc), where Recl is her estimated cluster radius. The radii of the groups each follow a rather tight sequence with time. While the tight clusters expand from ∼0.5 to 3 pc, the loose ones evolve from 4 to 20 pc on the same time-scale, parallel to the tight ones. Of these 23 clusters, 10 are included in our cluster sample. Five of them are tight clusters ([OBS 2003] 179, Westerlund 2, NGC 3603, Trumpler 14, Arches) and five are loose ones (NGC 7380, NGC 2244, IC 1805, NGC 6611, Cyg OB2). When comparing the most-massive stars against the cluster mass of these two subsets, as is done in Fig. 10, it seems that the clusters which form tighter and are therefore more dense, have on an average a more massive maximal star, while the loose clusters prefer less massive maximal stars. For the tight subset a linear function can be fitted with a slope of 0.09 ± 0.39 and a rather low linear correlation coefficient of 0.35 ± 0.47. The slope for the loose sample is 0.27 ± 0.16, somewhat steeper than for the tight sample within the error bars, but the linear correlation coefficient is much larger, about 0.92 ± 0.08. The combined sample has a slope of 0.22 ± 0.23 with a linear correlation coefficient of 0.52 ± 0.47. Therefore, the difference in slopes might be indicating a physical dependence of the mass of the most massive star not only on the cluster mass (previous sections) but also on the cluster density. But the large error bars make a more definite statement difficult. Also it should be noted here that the Recl estimates for the all the loose clusters of the Pfalzner (2009) sample are the measured median distances of early B type stars in theses clusters (Wolff et al. 2007) and therefore might not be directly comparable to radii arrived at with different methods.
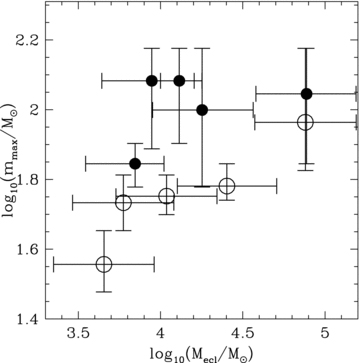
Like Fig. 3 but only the clusters which are in common with the Pfalzner (2009) sample. Filled circles are clusters with radii smaller than 1 pc while the open circles are the clusters with larger radii.
Low-mass young clusters are found to be generally small (≲1 pc, Testi, Palla & Natta 1998; Gutermuth et al. 2005; Testor et al. 2005; Rathborne, Jackson & Simon 2006; Scheepmaker et al. 2007) so it is unclear if and how such a correlation between the most-massive star and the cluster radius extends to lower masses.
3.5 A simple model
Fig. 11 shows σ within the proto-cluster as a function of Mecl. It is compared with the typical velocity of ionized gas, vion, which is about 10–20 km s−1. As is visible in Fig. 11, σ is larger than vion for clusters with masses larger than a couple of hundred M⊙, regardless of the radii and SFEs. Therefore, it seems possible that such clusters are able to retain the ionized gas longer – allowing the stars to accrete further mass. The fact that σ already overcomes vion at rather low Mecl for small Recl and low SFE can be seen as an indication that low-mass clusters might have lower SFEs than massive clusters.

The dashed lines show the dependence of the velocity dispersion, σ, in the cluster on Mecl for a range of cluster radii (0.1–1 pc) and star-formation efficiencies (0.3–0.8). The horizontal lines mark the typical range of velocities for ionized gas, vion(10–20 km s−1), while the vertical lines are the plateau of most-massive stars for Mecl from 1000 to 4000 M⊙. In the shaded region are lying models for which σ is larger than vion and Mecl is larger than 1000 M⊙.
4 RESULTS AND DISCUSSION
We have studied the possible dependence of the mass of the most-massive star, mmax, on the stellar mass, Mecl, of the host birth cluster. To this effect, we have significantly increased the data sample mmax(Mecl).
Using the new spectral-type stellar-mass conversion from Martins et al. (2005) and the here presented sample of most-massive stars in star clusters, it has been shown here that the observed sample divides into three subsamples, the first being clusters with Mecl < 100 M⊙, followed by clusters between 100 and 1000 M⊙ and clusters with Mecl > 1000 M⊙. Furthermore, there is a plateau of constant mmax≈ 25 M⊙ for clusters with masses between 1000 and 4000 M⊙.
Mecl < 100 M⊙: the percentage of stars between the 1/6th and 5/6th quantiles is 89 per cent (83 per cent when taking the error bars into account) which is too tight for random sampling (66 per cent). Such a distribution is highly unlikely with a chance of only 0.2 per cent (0.1 per cent with errors) when calculated from a Binomial distribution. But the distribution around the median and the Wilcoxon singed-rank test are compatible with random sampling at a significance of 2 per cent.
100 < Mecl≤ 1000 M⊙: 77 per cent (70 per cent with errors) of the stars are within the 1/6th and 5/6th quantiles which is somewhat tighter than expected for random sampling (66 per cent). The probability of this to occur is rather high with 8 per cent (13 per cent with errors). But 87 per cent of all clusters are below the random-sampling median where only 50 per cent would be expected and the Wilcoxon singed-rank test gives a very low probability (1.9 × 10⁻⁷) that the data are distributed symmetrically around the median.
Mecl > 1000 M⊙: only 12 per cent of the data points (66 per cent with errors) are in the 2/3rd interval which is far below the expectation from random sampling (66 per cent). The probability for a random occurrence of such a low number with the 2/3rd interval is 4 × 10⁻¹¹. Furthermore 97 per cent of the data points are lower than the median and the Wilcoxon singed-rank test results in a very low probability (2.8 × 10⁻⁹) for a symmetric distribution, too.
The clusters in the mass range below 100 M⊙ are the ones most compatible with the hypothesis of being randomly sampled from the IMF. This is also roughly the range of clusters studied by Maschberger & Clarke (2008). Their result, that the most-massive stars in these clusters could be randomly drawn from a universal IMF, is therefore in accordance with our conclusions. The difference is that here it is shown that this assumption cannot be generalized for more massive/richer clusters.
Selman & Melnick (2008) argue that the claim reached by Weidner & Kroupa (2006), that there exists a mmax–Mecl relation, is due to a size-of-sample effect in the data used by Weidner & Kroupa (2006). We now apply their analyses to our new data set. In appendix A of their paper, they use a method of adding up some clusters of the Weidner & Kroupa (2006) sample to so-called ‘superclusters’ of the same mass as NGC 6530 (about 1000 M⊙ in the new sample presented here). By comparing the mean mass of the synthetic superclusters with the most-massive star of the component clusters, they show that there is no trend for the most-massive stars to be more massive with cluster mass. Here, we repeat the same method with our new sample of clusters. All possible combinations to reach the mass of NGC 6530 from within the sample are used and the most-massive star is plotted over the mean cluster mass, 〈Mecl〉, in Fig. 12. As is seen in the figure, the mass of the most-massive star increases with 〈Mecl〉. The Selman & Melnick (2008) explanation for the Weidner & Kroupa (2006) result therefore fails for the new sample.
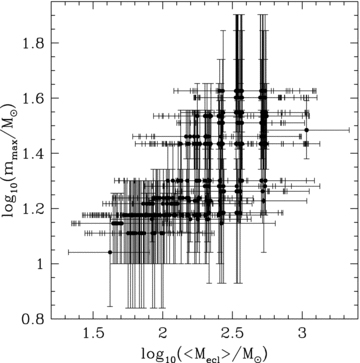
The mass of the most-massive star versus the mean mass of the so-called ‘superclusters’ constructed as in Selman & Melnick (2008). It shows whether or not the observed clusters of higher masses can be made by adding up large numbers of low-mass clusters. The obvious trend of increasing mmax with <Mecl> is a clear indication against such a conclusion.
These results strongly suggest an underlying physical mmax–Mecl relation. They contradict the hypothesis that star clusters are populated with stars by random sampling from the IMF. Only when taking into account the full range of the error bars and a very unlikely low fundamental upper mass limit of mmax*= 50 M⊙ would the complete sample mostly agree with random sampling. But in such a case, no stars above 50 M⊙ would exist, a result clearly disproved by the dynamical mass measurements for the massive stars in Westerlund 2 and NGC 3603 (see Table 1).
The general trend of the most-massive star with cluster mass and the observed plateau between the two cluster mass regimes is therefore most likely a general result of the star-formation process within cluster-forming molecular cloud cores. Several different mechanisms might be responsible for the non-random behaviour of the formation of the most-massive star in star clusters. One such model is explored in Section 3.5, where the velocity dispersion within the cluster-forming cloud core is used as a measure for the binding energy of the cloud, and is compared with typical velocities of ionized gas which acts as a proxy for the radiative feedback of the stars. This simple model is already in qualitative agreement with the data, but more detailed studies of how the radiative and mechanical feedback of massive stars scales differently than the binding energy are needed. This may result in a critical Mecl limit at which the one dominates over the other.
Another possible explanation for the existence of an mmax–Mecl relation might be given by dry mergers. In this scenario, massive stars form in smaller subclusters which are quickly evacuated by their feedback and these subclusters then merge nearly gas free, allowing only for very little additional accretion, that is mass growth. Only for initially very massive giant molecular clouds, more gas might be accreted during and after the merging of the subclusters.
The interesting split of the massive clusters into a tight and a loose subset by Pfalzner (2009, see Section 3.4) can be used as an additional constraint on the mmax–Mecl relation. The loose cluster stars form predominately by free-fall collapse of dense cores with little or no further gas accretion into the cluster. For the tight (high-density) clusters, cluster potential assisted accretion is possible which allows for more massive stars to form in these objects. Also stellar collisions, mergers and competitive accretion might play a role in these dense clusters.
A more detailed study of the possible mechanisms to explain the here presented observational evidence for a physical relation between mmax and Mecl will be presented in a follow-on paper.
As the high-mass regime is most important for the question whether the integrated IMF of a galaxy is similar to the IMF derived locally on star cluster scales or not, this discardation of random sampling naturally leads the IGIMF being steeper than expected from individual star clusters. Since the majority of stars seem to form in star clusters but also these clusters are distributed according to a mass function which is dominated by lower mass clusters, the apparent non-randomness of these clusters lead to fewer OB stars per star in a galaxy than expected from random sampling.7
Random sampling means choosing a number N of stars randomly from the distribution function which is in this case the IMF.
150 M⊙ is believed to be the fundamental upper mass limit for stars with non-zero metallicity (Weidner & Kroupa 2004; Figer 2005; Oey & Clarke 2005; Koen 2006).
The masses are corrected for stellar evolutionary effects as described in Weidner (2009).
For example, for an O4 V star the spectral types O5 V and O3 V are used to determine the lower and upper mass limit.
A short introduction into the test and pre-calculated tables for the probabilities for different N can be found at: http://comp9.psych.cornell.edu/Darlington/index.htm
∼0.1 is the highest probability the Wilcoxon signed-rank test allows for.
The IGIMF concept is discussed in great detail in Kroupa & Weidner (2003) and Weidner & Kroupa (2005) and subsequent papers.
We thank Jan Pflamm-Altenburg and Thomas Maschberger for several lengthy discussions on statistical methods. We also thank Vasili Gvaramadze for pointing out the work of Martins et al. (2005) on the recalibration of the masses of massive stars and Nick Moekel for further discussions. This work made use of the Webda and the Simbad web based data bases. This work was financially supported by the Chilean FONDECYT grant 3060096 and the CONSTELLATION European Commission Marie Curie Research Training Network (MRTN-CT-2006-035890).
REFERENCES
Appendices
APPENDIX A: THE STELLAR INITIAL MASS FUNCTION
The basic assumption underlying our approach is the notion that all stars in every cluster are drawn from this same universal parent IMF, which is consistent with observational evidence (Elmegreen 1999; Kroupa 2001).
It should be noted here that, while not indicated in equation (A2), there is evidence of a maximal mass for stars (mmax≤mmax*≈ 150M⊙; Weidner & Kroupa 2004), a result confirmed by several independent studies (Figer 2005; Oey & Clarke 2005; Koen 2006).
APPENDIX B: THE CLUSTER SAMPLE
Literature data for the empirical cluster masses (Mecl), maximal star masses (mmax,obs) within these clusters, cluster ages (age), distances (D), the numbers of stars above or within certain mass limits (in M⊙), the name and the spectral type of the most-massive star and references for the data.
| Designation | Mecl (M⊙) | mmax obs old (M⊙) | mmax obs new (M⊙) | Age (Myr) | D (pc) | No. of stars | Id mmax | Sp Type | Ref. |
| IRAS 05274+3345 | 14 −7/+15 | 7.0 ± 2.5 | 1.0 | 1800 | 15 > 0.24 | - | B2 | (1) | |
| Mol 139 | 16 ± 8 | 2.9 ± 2.0 | <1 | 7300 | - | - | - | (2) | |
| Mol 143 | 21 ± 10 | 3.1 ± 2.0 | <1 | 5000 | - | - | - | (2) | |
| IRAS 06308+0402 | 24 −13/+25 | 11.0 ± 4.0 | 1.0 | 1600 | 16 > 0.37 | - | B0.5 | (1) | |
| VV Ser | 25 −13/+27 | 3.3 ± 1.0 | 0.6 | 440 | 24 > 0.3 | VV Ser | B9e | (3) | |
| VY Mon | 28 −15/+29 | 4.1 ± 1.0 | 0.1 | 800 | 26 > 0.3 | VY Mon | B8e | (3) | |
| Mol 8A | 30 ± 15 | 3.8 ± 2.0 | <1 | 11500 | - | - | - | (2) | |
| IRAS 05377+3548 | 30 −15/+32 | 9.5 ± 2.5 | 1.0 | 1800 | 31 > 0.24 | - | B1 | (1) | |
| Ser SVS2 | 31 −16/+31 | 2.2 ± 0.2 | 2.0 | 259 ± 37 | 50 > 0.17 | BD 01° 3689 | A0 | (4) | |
| Tau-Aur | 31 −18/+36 | 7.0 ± 2.5 | 1-2 | 140 | 123 > 0.02 | HK Tau/G1 | B2 | (5) | |
| IRAS 05553+1631 | 31 −16/+33 | 9.5 ± 2.5 | 1.0 | 2000 | 28 > 0.28 | - | B1 | (1) | |
| IRAS 05490+2658 | 33 −17/+36 | 7.0 ± 2.5 | 1.0 | 2100 | 30 > 0.29 | - | B2 | (1) | |
| IRAS 03064+5638 | 33 −17/+36 | 11.0 ± 4.0 | 1.0 | 2200 | 27 > 0.31 | - | B0.5 | (1) | |
| IRAS 06155+2319 | 34 −18/+35 | 9.5 ± 2.5 | 1.0 | 1600 | 38 > 0.21 | - | B1 | (1) | |
| Mol 50 | 36 ± 18 | 3.5 ± 2.0 | <1 | 4900 | - | - | - | (2) | |
| Mol 11 | 47 ± 20 | 3.8 ± 2.0 | <1 | 2100 | - | - | - | (2) | |
| IRAS 06058+2138 | 51 −27/+54 | 7.0 ± 2.5 | 1.0 | 2000 | 26 > 0.49 | - | B2 | (1) | |
| NGC 2023 | 55 −28/+58 | 8.0 ± 2.0 | 3.0 | 400 | 21 > 0.6 | HD 37903 | B1.5V | (6) | |
| Mol 3 | 61 ± 20 | 3.7 ± 2.0 | <1 | 2170 | - | - | - | (2) | |
| Mol 160 | 63 ± 20 | 4.3 ± 2.0 | <1 | 5000 | - | - | - | (2) | |
| NGC 7129 | 63 −33/+104 | 9.2 ± 3.0 | 0.1 | 1000 | 53 > 0.3/3 > 3 | BD 65° 1637 | B3e | (7) | |
| IRAS 06068+2030 | 67 −35/+70 | 11.0 ± 4.0 | 1.0 | 2000 | 59 > 0.28 | - | B0.5 | (1) | |
| IRAS 00494+5617 | 71 −37/+74 | 9.5 ± 2.5 | 1.0 | 2200 | 58 > 0.31 | - | B1 | (1) | |
| IRAS 05197+3355 | 72 −38/+75 | 11.0 ± 4.0 | 1.0 | 3200 | 34 > 0.50 | - | B0.5 | (1) | |
| Cha I | 80 −46/+91 | 5.0 ± 3.0 | 2.0 | 170 ± 10 | 237 > 0.04 | HD 96675 | B6IV/V | (8) | |
| V921 Sco | 71 −36/+429 | 14.0 ± 4.0 | 0.1-1 | 800 | 33 > 0.5 | V921 Sco | B0e | (7) | |
| IRAS 05375+3540 | 73 −38/+78 | 11.0 ± 4.0 | 1.0 | 1800 | 74 > 0.24 | - | B0.5 | (1) | |
| IRAS 02593+6016 | 78 −41/+81 | 15.0 ± 5.0 | 1.0 | 2200 | 61 > 0.31 | - | B0 | (1) | |
| Mol 103 | 80 ± 20 | 4.0 ± 2.0 | <1 | 4100 | - | - | - | (2) | |
| NGC 2071 | 80 −44/+89 | 4.0 ± 2.0 | 1.0 | 400 | 105 > 0.2 | V1380 Ori | B5 | (9) | |
| MWC 297 | 85 ± 60 | 8.3 −1.3/+13.7 | 8.3 −1.3/+13.7 | 0.1-1 | 250 or 450 | 24 > 0.3 | - | B1.5V or O9e | (3) |
| IC 348 | 89 −46/+92 | 6.0 ± 1.0 | 1.3 | 310 | 173 > 0.1 | BD 31°643 | B5V | (10) | |
| BD 40° 4124 | 90 −49/+106 | 12.9 −6.0/+ 2.0 | 0.1-6 | 1000 | 74 > 0.3 /3 > 3 | BD 40° 4124 | B2e | (3) | |
| ρ Oph | 91 −46/+93 | 8.0 ± 1.0 | 0.1-1 | 130 ± 20 | 78 > 0.3 | ρ Oph | BIV | (11) | |
| IRAS 06056+2131 | 92 −49/+97 | 7.0 ± 2.5 | 1.0 | 2000 | 85 > 0.28 | - | B2 | (1) | |
| IRAS 05100+3723 | 98 −51/+103 | 15.0 ± 5.0 | 1.0 | 2600 | 63 > 0.38 | - | B0 | (1) | |
| R CrA | 105 −55/+114 | 4.0 ± 2.0 | 1.0 | 130 | 55 > 0.5 | R CrA | A5eII | (12) | |
| NGC 1333 | 105 −54/+111 | 5.0 ± 1.0 | 1-3 | 250 | 134 > 0.2 | SSV 13 | - | (13) | |
| Mol 28 | 105 ± 20 | 9.9 ± 2.0 | <1 | 4500 | - | - | - | (2) | |
| IRAS 02575+6017 | 111 −57/+116 | 9.5 ± 2.5 | 1.0 | 2200 | 91 > 0.31 | - | B1 | (1) | |
| W40 | 144 −80/+576 100 | 10.0 ± 5.0 | 1-2 | 600 | 3 > 4 | IRS 2a | - | (14) | |
| σ Ori | 150 −76/+155 | 20.0 ± 4.0 | 17.3 −4.3/+4.7 | 2.5 | 360 ± 60 | 140 ± 10 (0.2-1.0) | σ Ori A | O9-9.5V | (15) |
| NGC 2068 | 151 −86/+169 | 5.0 ± 3.0 | 1.0 | 400 | 192 > 0.2 | HD 38563A | B4V | (16) | |
| NGC 2384 | 189 −95/+192 | 16.5 ± 1.5 | 1.0 | 2100 | 7 > 3 | HD 58509 | B0.5III | (17) | |
| Mon R2 | 225 −117/+236 | 15.0 ± 5.0 | 0-3 | 830 ± 50 | 309 > 0.15 | IRS 1SW | B0 | (18) | |
| IRAS 06073+1249 | 239 −120/+242 | 11.0 ± 4.0 | 1.0 | 4800 | 25 > 1.47 | - | B0.5 | (1) | |
| Trumpler 24 | 251 −131/+291 | 14.5 ± 2.5 | 1.0 | 1140 | 4 > 5 | GSC 7872-1609 | WN | (19) | |
| IC 5146 | 293 −226/+305 | 14.0 ± 4.0 | 1.0 | 900 | 238 > 0.3/5 > 3 | BD 46° 3474 | B0e | (20) | |
| HD 52266 | 400 ± 350 | 28.0 ± 3.5 | 20.0 −5.0/+7.0 | <3.0 | 1700 ± 1000 | 4 ± 2 > 4 | HD 52266 | O8-9V | (21) |
| HD 57682 | 400 ± 350 | 28.0 ± 3.5 | 20.0 −5.0/+7.0 | <3.0 | ? | 4 ± 5 > 4 | HD 57682 | O8-9V | (21) |
| Alicante 5 | 461 −234/+516 | 12.0 ± 4.0 | <3.0 | 3600 +600/-400 | 22 > 2.5 | A47 | B0.7V | (22) | |
| Cep OB3b | 485 −243/+497 | 37.7 ± 5.0 | 27.2 −5.2/+8.8 | 3.0 | 800 ± 100 | 12 > 4 | HD 217086 | O7Vn | (23) |
| HD 153426 | 500 ± 350 | 40.0 ± 6.5 | 28.9 −6.9/+7.1 | <3.0 | ? | 5 ± 4 > 4 | HD 153426 | O6.5-7V | (21) |
| NGC 2264 | 525 −267/+537 | 25.0 ± 5.0 | 27.2 −5.2/+8.8 | 3.0 | 760 ± 100 | 1000 > 0.08 | S Mon /HD 47839 | O7Ve | (24) |
| Sh2-294 | 525 −267/+540 | 12.5 ± 2.5 | 4.0 | 3200 | 155 > 0.7 | S294B0.5V | B0.5V | (25) | |
| RCW 116B | 536 −276/557 | 21.0 ± 5.0 | 16.9 −5.9/+7.1 | 2.5 | 1100 | 102 > 0.95 | - | B1V-O8V | (26) |
| NGC 6383 | 561 −281/+563 | 37.7 ± 5.0 | 27.2 −5.2/+8.8 | 2.0 | 1300 ± 100 | 21 > 3 | HD 159176 | O7V + O7V | (27) |
| Alicante 1 | 577 −290/+583 | 45.0 ± 5.0 | 34.3 −8.3/+10.7 | 2-3 | 4000 ± 400 | 38 > 2.0 | BD 56° 864 | O6V | (28) |
| HD 52533 | 621 −417/+1077 | 26.7 ± 3.0 | 19.1 −4.1/+2.9 | <3.0 | ? | 15 ± 5 > 4 | HD 52533 | O8.5-9V | (21) |
| Sh2-128 | 666 −342/+736 | 37.7 ± 5.0 | 27.2 −5.2/+8.8 | 2.0 | 9400 | 7 > 7 | - | O7V | (29) |
| NGC 2024 | 690 −350/+706 | 20.0 ± 4.0 | 15.3 −6.8/+8.7 | 0.5 | 400 | 309 > 0.5 | IRS 2b | O8V − B2V | (30) |
| HD 195592 | 725 −364/+757 | 40.0 ±10.0 | 32.4 −6.4/+6.6 | <3.0 | ? | 18 ± 3 > 4 | HD 195592 | O6-6.5V | (21) |
| Sh2-173 | 748 −395/+901 | 25.4 ± 5.0 | 18.3 −4.3/+3.7 | 0.6-1.0 | 2500 ± 500 | 7 > 7 | BD 60° 39 | O9V | (31) |
| DBSB 48 | 792 −416/+1126 | 56.6 ± 15.0 | 42.3 −8.3/+12.7 | 1.1 | 5000 ± 700 | 5 > 10 | - | O5V | (32) |
| NGC 2362 | 809 −409/+823 | 43.0 ± 7.0 | 35.3 −5.3/+34.7 | 3.0 | 1390 ± 200 | 353 > 0.5 | τ CMa | O9Ib | (33) |
| Pismis 11 | 896 −448/+938 | 40.0 −0.0/+40.0 | 3-5 | 3600 +600/-400 | 43 > 2.5 | HD 80077 | B2Ia | (22) | |
| NGC 6530 | 1075 −545/+1097 | 56.6 ± 11.0 | 30.5 −6.5/+8.5 | 2.3 | 1350 ± 200 | 620 > 0.4 | HD 165052 | O6.5V | (34) |
| FSR 1530 | 1410 −707/+1581 | 30.0 ± 15.0 | <4.0 | 2750 ± 750 | 35 > 4 | [M81]I-296 | - | (35) | |
| Berkeley 86 | 1440 −730/+1470 | 40.0 ± 8.0 | 21.7 −4.7/+7.3 | 3-4 | 1700 | 340 > 0.8 | HD 193595 | O8V(f) | (36) |
| NGC 637 | 1682 −854/+1726 | 30.8 ± 15.0 | 21.7 −6.7/+11.3 | 4.0 | 2160 | 583M⊙ > 1.6 | - | ≈O8 | (37) |
| W5Wb | 1734 −874/+1757 | 34.1 ± 5.0 | 24.1 −4.1/+8.9 | 2.0 | 2000 | 300 > 1 | BD 60° 586 | O7.5V | (38) |
| Stock 16 | 1857 −955/+2045 | 43.0 ± 10.0 | 32.1 −7.1/+7.9 | 4.0 | 1650 | 16 > 8 | HD 115454 | O7.5III | (39) |
| ONC | 2124 −1078/+2175 | 35.8a± 7.2 | 34.3 − 5.7/+10.7 | <1.0 | 414 ± 7 | 3500 (0.1 − 30) | Θ Orionis C1 | O6Vpe | (40) |
| RCW 38 | 2251 −1132/+2276 | 50.4 ± 10.0 | 37.7 −7.7/+12.3 | <1.0 | 1700 | 2000 > 0.25 | IRS 2 | O5.5V | (41) |
| Bochum 2 | 2284 −1302/+3523 | 37.7 ± 4.0 | 27.2 −5.2/+8.8 | 2-4 | 2700 | 4 > 16 | BD 00° 1617B | O7V | (42) |
| Berkeley 59 | 2310 −1168/+2417 | 37.7 ± 4.0 | 27.2 −5.2/+8.8 | 2.0 | 1000 | 41 > 5 | BD 66° 1675 | O7V | (43) |
| IC 1590 | 2376 −1245/+2799 | 41.0 ± 5.2 | 30.5 −6.5/+8.5 | 3.5 | 2900 | 14 > 10 | BD 55° 191 | O6.5V | (44) |
| W5E | 2614 −1323/+2667 | 37.7 ± 5.0 | 27.2 −5.2/+8.8 | 2.0 | 2000 | 400 − 500 > 1 | HD 18326 | O7V | (38) |
| W5Wa | 2651 −1338/+2690 | 52.0 ± 10.0 | 37.3 −6.3/+7.7 | 2.0 | 2000 | 400 − 500 > 1 | HD 17505 | O6.5III | (38) |
| NGC 1931 | 3128 −1564/+3163 | 30.8 ± 15.0 | 21.7 −6.7/+11.4 | 4.0 | 3086 | 848M⊙ > 2.39 | - | ≈O8 | (37) |
| LH 118 | 3746 −1918/+4077 | 56.6 ± 7.0 | 42.3 −8.3/+12.7 | 3.0 | 48500 | 28 > 9 | LH 118-241 | O5V | (45) |
| NGC 2103 | 3853 −1937/+3905 | 80.0 ± 20.0 | 89.3 −24.3/+30.7 | 1.0 | 48500 | 26 > 10 | Sk −71° 51 | O2V((f*)) | (46) |
| NGC 7380 | 4527 −2290/+4611 | 47.8 ± 5.0 | 36.0 −6.0/+9.0 | 2.0 | 3700 | 42 (6–12) | HD 215835 | O5.5-6V((f)) | (47) |
| NGC 6231 | 4595 −2312/+4676 | 59.0 ± 10.0 | 51.9 −20.9/+18.1 | 1.0 | 1600 | 51 > 7 | HD 152248 | O7Ib | (48) |
| RCW 106 | 4681 −2375/+4871 | 45.7 ± 10.0 | 34.1 −8.1/+10.9 | 2.5 | 1100 | 41 > 8 | - | O5.5-6.5V | (49) |
| NGC 6823 | 4983 −2584/+5685 | 37.7 ± 4.0 | 27.2 −5.2/+8.8 | 2-4 | 1900 | 42 > 8 | BD 22° 3782 | O7V(f) | (50) |
| RCW 121 | 5323 −2671/+5390 | 42.0 ± 4.0 | 38.3 −8.3/+11.7 | 4.2 | 1600 | 96 > 5 | - | O6V-O5V | (51) |
| NGC 2244 | 5946 −3029/+6102 | 68.9 ± 14.0 | 54.1 −9.1/+10.9 | 1.9 | 1500 | 54 (6 − 12) | HD 46223 | O4V(f) | (52) |
| NGC 2122 | 6764 −3416/+6960 | 74.7 ± 10.0 | 58.8 −13.8/+11.2 | 3.0 | 48500 | 52 > 9 | HD 270145 | O6I(f) | (53) |
| [OBS 2003] 179 | 7000 ± 3500 | 50.0 ± 20.0 | 70.0 ± 10.0 | 2-5 | 7900 | 10 > 16 | Obj 4 | Ofpe/WN9 | (54) |
| Westerlund 2 | 8845 −4456/+9009 | 82.7a± 5.5 | 121.0 −43.8/+29.0 | 1-2 | 8000 | 29 > 16.5 | WR20a A | WN6ha | (55) |
| RCW 95 | 9670 −4840/+9720 | 87.6 ± 14.0 | 64.6 −9.6/+15.4 | 1.5 | 2400 | 136 > 6 | - | O3V | (56) |
| IC 1805 | 10885 −5528/+11137 | 75.6 ± 10.0 | 56.5 −6.5/+8.5 | 2.0 | 2350 | 99 (6 − 12) | HD 15558 | O4-5III(f) | (47) |
| NGC 6357 | 11978 −6430/+11979 | 115.9 ± 30.0 | 79.8 −14.8/+15.2 | 1.0 | 2560 | 38 > 16.5 | HDE 319718A | O3If | (57) |
| NGC 3603 | 1.3 × 10⁴± 3000 | 150.0 ± 50.0 | 121.0 −41.0/+29.0 | 0.7 | 6000 | - | NGC 3603-B | WN6ha | (58) |
| Trumpler 14/16 | 17890 −8945/+18676 | 150.0 ± 50.0 | 99.8 −39.8/+50.2 | 1.7 | 2500 | 64 > 16 | η Carina | LBV | (59) |
| NGC 6611 | 25310 −12659/+25503 | 85.0 ± 15.0 | 60.4 −5.6/+9.6 | 1.3 | 1800 | 460 > 5 | HD 168076 | O4III | (60) |
| Cyg OB2 | 75890 −38453/+78716 | 92.0 −25.0/+58.0 | 2.0 | 1700 | 8600 > 1.3 | Cyg OB2-12 | B8Ia | (61) | |
| Arches | 77225 −39250/+77225 | 120.0 −0.0/+30.0 | 111.0 −41.0/+39.0 | 2.5 | 7620 | 196 > 20.1 | N4 | WN7-8h | (62) |
| R 136 | 222912 −112104/+224426 | 145.0 ± 15.0 | 125.4 −45.4/+24.6 | 1-2 | 48500 | 8000 > 3 | R136a1 | O2If*/WN4.5 | (63) |
aDynamical mass estimates from binary orbits exist for these stars.
References for Table B1.
References for Table B1.
APPENDIX C: NOTES ON INDIVIDUAL STAR CLUSTERS
C1 MWC 297
Depending on the uncertain distance the spectral type of the brightest star is either O9e (450 pc; Hillenbrand et al. 1992) or B1.5V (250 pc; Drew et al. 1997). Wang & Looney (2007) assume the O9e spectral type and assign the star a mass of 26.5 M⊙. This mass estimate is rather odd as older literature gives 22 (Hanson, Howarth & Conti 1997) or 25.4 (Vacca et al. 1996) M⊙ for a O9 star and the new Martins et al. (2005) calibration yields 18 M⊙. Here, we assume the newer distance of 250 pc and therefore the spectral type B1.5V but include the mass of an O9V star as an upper limit (22 M⊙ for the old calibration and 18 M⊙ for the new one).
C2 Pismis 11
It is not certain whether HD 80077 is part of this star cluster or not (Marco & Negueruela 2009). If it is, it would be one of the brightest stars in the MW. Because it is an evolved star (B2Ia), the precise initial mass is not known, only that it should be above 40 M⊙.
C3 NGC 2244
Bonatto & Bica (2009) give a mass of 625 M⊙ for this cluster from fitting a King profile to the MS and PMS stars they found. But when using the number of B0 to B3 stars (54 between 6 and 12 M⊙ M⊙) from Wolff et al. (2007), an IMF extrapolation yields a cluster mass of about 6000 M⊙. A reason for this discrepancy is currently not known.
C4 γ Velorum Cluster
Jeffries et al. (2009) studied a group of several hundred PMS stars around the massive binary γ2 Vel (WC8 + O7.5V) in the Vela OB2 association. They concluded that it is a young (≈7 Myr) low-mass (250–360 M⊙) cluster with a very massive star (initial mass for the WC8 star >40 M⊙). This object has not been included because of its age and the possible mass loss from the cluster due to gas expulsion.
C5 Trumpler 14/16
Trumpler 14 and Trumpler 16 are believed to be one single cluster optically divided by a large patch of gas and dust (Oey & Clarke 2005). Some studies do not consider η Carina as part of this cluster. If η Car is not part of the cluster then the O3If* star HD 93129AB (67+ M⊙) would be the most-massive star in the cluster.
C6 Cyg OB2
The star Cyg OB2−12 is an evolved star (B8Ia) and is considered to be one of or maybe even the brightest star in the MW. Negueruela et al. (2008) estimate its initial mass with 92 M⊙. The region contains 8600 stars earlier than F3, some 2600 OB stars and around 120 O-stars and has been described by Knödlseder (2000) as a possible young globular cluster within the MW disk.
C7 R 136
There is some debate in the literature whether or not extremely massive stars (>80 M⊙) might or might not look like Wolf–Rayet stars even while they still burn hydrogen in their cores (Crowther 2007). Therefore, the spectral type of the most-massive star (R136a1) might be either O2If* or WN4.5. But this has little consequences for the mass estimate for this star as it is based on a detailed spectral analysis (Massey & Hunter 1998). The mass estimate for the cluster, 2.2 × 10⁵ M⊙, is for R 136 only. The cluster contains about 8000 stars between 3 and 120 M⊙ and 39 O3If* stars. The whole region of 30 Doradus is believed to hold a total of 4.5 × 10⁵ M⊙ in stars (Bosch, Terlevich & Terlevich 2009).
C8 Cl 1806−20
The cluster and its most massive star, LBV 1806−20, one of the brightest stars in the MW, have not been included because the cluster is known to host a pulsar (SGR 1806−20) and is therefore most probably too old for the current study. Additionally, very little is known about its stellar population besides the LBV, the pulsar, an OB supergiant and three Wolf–Rayet stars as this cluster is on the far side of the Galaxy (D≈ 15 000 pc) and heavily dust obscured (Figer et al. 2005).
C9 Quintuplet
This massive cluster (∼1.2 × 10⁴ M⊙; Figer et al. 1999; Liermann, Hamann & Oskinova 2009) hosts the Pistol star which is one of the brightest and most massive stars in the Galaxy (150+ M⊙?) but is believed to be 4–6 Myr old and therefore too old for this study.
C10 Westerlund 1
Another massive cluster (>104 M⊙; Brandner 2008) with about 150 O-stars. It houses an X-ray pulsar (Muno et al. 2006) and is therefore not included into this study as it is too old (4–5 Myr).
