


Abstract
We use three-dimensional smoothed particle hydrodynamic simulations to investigate the collapse of low-mass pre-stellar cores and the formation and early evolution of protostellar discs. The initial conditions are slightly supercritical Bonnor–Ebert spheres in rigid rotation. The core mass and initial radius are held fixed at MO= 6.1 M⊙ and RO= 17 000 au, and the only parameter that we vary is the initial angular speed ΩO. Protostellar discs forming from cores with ΩO < 1.35 × 10⁻¹³ s−1 have radii between 100 and 300 au and are quite centrally concentrated; due to heating by gas infall on to the disc and accretion on to the central object, they are also quite warm,  , and therefore stable against gravitational fragmentation. In contrast, more rapidly rotating cores form discs which are less concentrated and cooler, and have radii between 400 and 1000 au; as a consequence they are prone to gravitational fragmentation and the formation of multiple systems. We derive a criterion that predicts whether a rigidly rotating core having given MO, RO and ΩO will produce a protostellar disc which fragments whilst material is still infalling from the core envelope. We then apply this criterion to core samples for which MO, RO and ΩO have been estimated observationally. We conclude that the observed cores are stable against fragmentation at this stage, due to their low angular speeds and the heat delivered at the accretion shock where the infalling material hits the disc.
1 INTRODUCTION
Stars form from the gravitational collapse of pre-stellar cores. We expect that, to a first approximation, angular momentum is conserved minutely during the early stages of collapse, and this leads to the formation of a protostellar disc and/or to fragmentation into a multiple system. Thus, understanding the formation and evolution of protostellar discs is a critical stage linking the initial conditions within pre-stellar cores to the final outcome of the star formation process.
In this paper, we simulate the collapse of isolated, rigidly rotating cores, using the three-dimensional OpenMP-parallelized smoothed particle hydrodynamics (SPH) code vine (Nelson, Wetzstein & Naab 2009; Wetzstein et al. 2009). All cores have the same mass and the same initial density profile, given by a Bonnor–Ebert sphere (BES) (Ebert 1955; Bonnor 1956); they are distinguished only by their angular momentum. We study the influence of core angular momentum on the properties of the protostellar discs and protostars that condense out of such discs. In a companion paper (Walch et al. 2009), we explore and contrast the properties of protostellar discs and protostars condensing out of turbulent cores having the same net angular momenta as the rigidly rotating cores considered here.
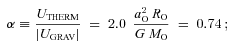
Previous numerical work on the collapse and fragmentation of cores has demonstrated that the critical ingredients are the net amount of angular momentum and its distribution, the initial density profile and the treatment of thermodynamics (for a summary see Goodwin et al. 2006). For example, Miyama, Hayashi & Narita (1984) and Burkert & Bodenheimer (1993) examine the evolution of cores with a uniform initial density and an isothermal equation of state. They find that the outcome depends on the parameters α≡UTHERM/|UGRAV| and β≡UROT/|UGRAV|, where UTHERM, UGRAV and UROT are the thermal, gravitational and rotational energies of the initial core. Specifically, Miyama et al. (1984) only find fragmentation for αβ < 0.12.
However, observations of pre-stellar cores suggest that they are centrally condensed and well represented by a Bonnor–Ebert profile (Alvés, Lada & Lada 2001; André et al. 2004), which is the equilibrium configuration for an isothermal cloud. Centrally condensed clouds appear to be more stable against fragmentation than cores with a uniform density (Lynden-Bell 1964; Boss 1993; Burkert & Bodenheimer 1996). For a review see Bodenheimer et al. (2000).
To date, only the parameter studies of the collapse of BES have been performed using grid codes. Matsumoto & Hanawa (2003) investigate the collapse of 3 M⊙ critical BES with the density enhanced by 10 per cent. They invoke a barotropic equation of state and investigate different total angular momenta, different rotation laws and bar mode perturbations of different strengths. Their simulations use a nested grid with mirror symmetry about the equatorial plane, and fine resolution in the centre (the location of the primary protostar) but quite coarse resolution in the outer parts (the disc region), particularly in the vertical direction. They conclude that fragmentation requires ΩCtFF > 0.05, where ΩC and tFF are the initial angular speed and freefall time at the centre of the core; this is equivalent to a lower limit on β. The study of disc fragmentation by Nelson (2006) suggests that these results may be compromised by poor vertical resolution.
Banerjee, Pudritz & Holmes (2004) investigate the collapse of a 2.1 M⊙ core and a 168 M⊙ core, using the flash amr code. The cores are initially BES with the density enhanced everywhere by 10 per cent, and then a 10 per cent m= 2 bar perturbation superimposed; they are initially in rigid rotation. In order to capture the thermodynamics more realistically, they use the tabulated molecular-line cooling prescription of Neufeld, Lepp & Melnick (1995). They perform only one simulation of a low-mass core, which has ΩCtFF= 0.2 and produces a bar; they suggest that this bar might subsequently fragment if the simulation was followed further.
Boss et al. (2000) have demonstrated that core fragmentation is highly sensitive to the treatment of thermodynamics. However, although Krumholz, Klein & McKee (2007) have performed three-dimensional AMR simulations of 100 M⊙ and 200 M⊙ collapsing cores with radiative transfer, there has as yet been no comprehensive parameter study of low-mass collapsing cores using a realistic treatment of the gas thermodynamics. This paper is an attempt to perform such a study.
In Sections 2 and 3, we describe the initial conditions, the numerical code and the constitutive physics. In Sections 4 and 5, we present in detail the evolution of cores with, respectively, low and high ΩO and in Section 6 we describe how the evolution changes as ΩO is increased between these limits. In the Appendix, we develop an analytic model, and derive a condition for fragmentation based on the initial parameters of a core. In Section 7, this criterion is applied to a sample of observed cores, and it is shown that they are all stable against disc fragmentation. In Section 8, we summarize our main conclusions.
2 INITIAL CONDITIONS
2.1 The initial core density profile
 . The core must be contained by an external pressure
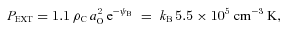
2.2 The initial velocity field
 , the initial velocity field is then
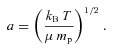
Our choice of representative values of ΩO is based on two constraints. (i) The total specific angular momenta in low-mass cores are typically of the order of 1021 cm2 s−1 (Goodman et al. 1993). (ii) The non-thermal velocity dispersions in low-mass cores are usually subsonic and at most transonic (e.g. Barranco & Goodman 1998; André et al. 2007). Therefore, the rotational velocity at the edge of the core should not be much greater than aO. The values of ΩO that we consider are listed in Table 1; the equator of the fastest spinning core rotates at Mach 1.5.
Column 1 gives the ID of the simulation, and Column 2 gives the initial rotational frequency, ΩO. Column 3 gives the time at which the first protostellar object forms, tO, and Column 4 gives the time at which 28 per cent of the mass is either in the protostellar disc or in protostars, t28. Column 5 gives the mass of the primary protostar at this juncture, M★, and Columns 6 and 7 give the mass, MD, and radius, RD, of the protostellar disc at the same time. Column 8 indicates whether the disc fragments.
| Run | ΩO | tO | t28 | M★ | MD | RD | F |
| 1 | 0.6 | 94.5 | 114.8 | 0.53 | 1.17 | 250 | N |
| 2 | 0.8 | 94.5 | 115.4 | 0.31 | 1.39 | 344 | N |
| 3 | 1.0 | 96.5 | 118.4 | 0.25 | 1.45 | 433 | N |
| 4 | 1.2 | 96.5 | 119.2 | 0.23 | 1.47 | 567 | N |
| 5 | 1.5 | 98.5 | 123.3 | 0.17 | 1.53 | 739 | Y |
| 6 | 1.6 | 102.4 | 126.7 | 0.24 | 1.46 | 1091 | Y |
| 7 | 1.8 | 104.4 | 130.4 | 0.16 | 1.54 | 952 | Y |
3 NUMERICAL METHOD AND CONSTITUTIVE PHYSICS
3.1 The vine code
The simulations have been performed with the Tree-SPH code vine. A full description of vine can be found in Wetzstein et al. (2009) and Nelson et al. (2009). vine is parallelized with OpenMP directives. It invokes a leapfrog integrator, and individual particle time-steps with a Courant-Friedrichs-Lewy (CFL) tolerance parameter of 0.1. Gravitational accelerations are estimated using a tree, with opening angle θ= 0.005 (Springel, Yoshida & White 2001). The gravitational softening length equals the hydrodynamical smoothing length (Bate & Burkert 1997), which is adapted so that each particle has  neighbours. Hydrodynamical forces are treated with periodic boundary conditions, but gravitational forces are not. Artificial viscosity is treated using the standard prescription of Gingold & Monaghan (1983) with αAV= 1 and βAV= 2, plus the Balsara switch (Balsara 1995). We have experimented with time-varying viscosity (Morris & Monaghan 1997), but find that it makes no significant difference.
3.2 Equation of state and molecular-line cooling
In solving the energy equation we adopt the following procedure. At low densities, ρ < ρCRIT= 10−13 g cm−3, we use the cooling rates computed by Neufeld et al. (1995), with the constraint that the temperature is not allowed to fall below T= 9 K. At high densities, ρ > ρCRIT, we switch off the radiative cooling, and the gas then evolves adiabatically. Neufeld et al. (1995) have computed the equilibrium abundances of key molecules and atoms (CO, H2O, H2, HCl, O2, C and O), and the resulting net cooling rate due to line emission, Λ, as a function of density and temperature, using the local velocity gradient method to treat optical-depth effects. Neufeld has kindly supplied these rates in the form of a look-up table for densities in the range  and temperatures in the range 10 ≤ (T/K) ≤ 2500. Most previous work in this field has used a barotropic equation of state and therefore does not treat thermal inertia effects (e.g. Goodwin, Whitworth & Ward-Thompson 2004; Bate 1998; Matsumoto & Hanawa 2003), although Banerjee et al. (2004) use the same procedure as used by us. By invoking line cooling we hope to capture more realistically the thermal behaviour of low-density material as it falls on to the protostellar disc and then spirals into the central protostar. Ideally radiative cooling should also take account of continuum emission from dust, in the regime where the gas and dust are thermally coupled, for example by using the algorithm developed by Stamatellos et al. (2007b). Unfortunately, the computational machinery to treat both the line cooling regime and the dust-cooling regime does not exist yet. We are currently developing an algorithm to combine these regimes.
3.3 Resolution
The core is modelled with 430 000 SPH particles, each having mass mSPH= 1.4 × 10⁻⁵ M⊙. Following Bate & Burkert (1997), the minimum resolvable mass is therefore  . For comparison, the minimum possible Jeans mass (corresponding to ρ=ρCRIT and T= 9 K) is 1.5 × 10⁻³ M⊙. Therefore, the Jeans mass is always resolved. In addition, there are 24 000 ambient particles exerting the external pressure that contains the core (see equation 3). These particles also have mass mSPH= 1.4 × 10⁻⁵ M⊙, but they have much higher temperature, and their density is adjusted so that they fill the space between the core and the periodic boundaries. We do not use sink particles. Instead, we limit the CPU time by imposing a minimum smoothing length, hMIN= 2 au. Consequently, we are able to resolve the details of the protostellar disc, both radially and vertically, but not the central protostar.
3.4 Definitions
Any SPH particle whose density rises above ρ★= 10−11 g cm−3 is presumed to be part of a protostar. The primary protostar is the one that forms first, at the centre of the core, and tO is its time of formation. Values of tO are given in Table 1. tO increases monotonically with ΩO, because more rapidly rotating cores take longer to reach the critical density, ρ★. We define the disc to be all material with density in the range 10−16 g cm−3≤ρ≤ 10−11 g cm−3, since in general this material has |vφ| ≫ |vr| (where vφ and vr are the azimuthal and radial components of velocity).
The evolution of a core can usefully be divided into two distinct phases. During the Isothermal Collapse Phase, radiative cooling is very efficient and the gas temperature is roughly constant. Throughout most of the isothermal phase centrifugal acceleration is a secondary effect, and the core collapses on an approximately freefall time-scale. The Protostellar Phase starts as soon as a disc forms. The pattern of evolution during the Protostellar Phase depends critically on ΩO. In cores with high ΩO, (i) formation of the primary protostar is delayed until a substantial disc has built up, and (ii) the outer disc is prone to fragment producing secondary protostars. Since the Protostellar Phase is shorter than the Isothermal Collapse Phase, we give times in the form t=tO+Δt, so that Δt is time measured from the moment when the primary protostar forms.
Simulations are compared at time t28, which is defined to be when 28 per cent of the core mass (i.e. ∼1.7 M⊙) has density ρ > 10−16 g cm−3, i.e. it is either in the disc or in a protostar. 28 per cent is the typical efficiency of star formation observed in cores (e.g. Motte, Andre & Neri 1998; Alves, Lombardi & Lada 2007). In order to follow the simulations further, we would need to relax the imposition of adiabaticity at densities ρ > 10−13 g cm−3, so that the energy dissipation resulting from the redistribution of angular momentum can be radiated away. Without this radiation the long-term viscous evolution of the disc is inhibited.
4 A LOW ANGULAR MOMENTUM CORE
In this section, we describe the evolution of a low angular momentum core, having ΩO= 0.6 × 10⁻¹³ s−1, and hence jO= 1.1 × 1021 cm2 s−1 and β= 0.014. This is Run 1.
4.1 The Isothermal Collapse Phase
Fig. 1 shows the density profile at various times during the Isothermal Collapse Phase of Run 1. The collapse is roughly spherically symmetric (at least until the late stages) and approximately self-similar: the central region with a flat density profile shrinks, both in radial extent and in mass. The infalling envelope with ρ∝ |r|−2 extends ever further inwards. Density profiles are computed by arranging the particles in order of increasing |r|, then averaging the density of contiguous sets of 100 particles; evidently this works only as long as departures from spherical symmetry are small.
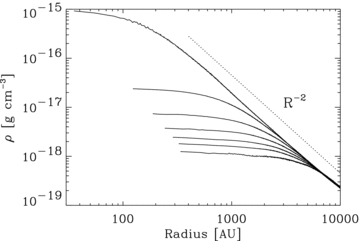
Radial-density profiles during the Isothermal Phase of Run 1. Reading from the bottom, profiles are shown at t= 0, 41, 51, 61, 71, 81 and 91 kyr. The axes are logarithmic, and the dotted line gives a slope of −2.
4.2 The Protostellar Phase
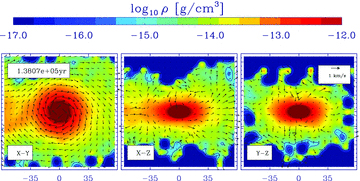
Fig. 2 shows velocity vectors superimposed on false-colour images of the density field on 400 × 400 au2 slices through the centre of the core during Run 1. These images correspond to times from just before the formation of the primary protostar at t=tO to t=t28. They show the formation of the primary protostar and its attendant protostellar disc. The density field is computed on a 64 × 64 grid by first evaluating the column density, Σ, through a slice having thickness Δ= 10 au, and then setting ρ=Σ/Δ. The velocity field is computed in an analogous way, but on a coarser 20 × 20 grid.
The density on 400 × 400 au2 slices through the centre of the core during Run 1. The left- and right-hand columns show slices at  y= 0, respectively. The times shown are (a) tO− 1.9 kyr, (b) tO+ 6.2 kyr and (c) tO+ 18.2 kyr. The density scale ranges from 10−18 to 10−13 g cm−3, and contours are plotted at 10−16, 3 × 10⁻¹⁶ and 10−15 g cm−3. Velocity vectors are superimposed, and the insets show a 1 km s−1 vector.
4.3 Density
Fig. 3(a) shows radial-density profiles on the equatorial plane, ρ(r, z= 0), from Run 1. Most of the mass interior to 10 au is in the primary protostar. Outside this the disc extends to beyond 100 au, with ρ∝r−2.5. After t=tO+ 8.1 kyr, the edge of the disc is very sharp.
Profiles from Run 1 at times tO+ 0.2 kyr (i.e. just after the primary protostar appears), tO+ 4.2 kyr, tO+ 8.1 kyr (i.e. the stage at which the disc becomes well established), tO+ 12.1 kyr, tO+ 16.0 kyr and tO+ 19.9 kyr (the end of the simulation). (a) The radial-density profile on the equatorial plane, ρ(r, z= 0). The axes are logarithmic, and a line with slope − 2.5 is shown to mimic the run of density in the disc between 10 and 200 au. The key gives the line-styles used to represent the different times. (b) The radial- temperature profile on the equatorial plane, T(r, z= 0). The axes are logarithmic, and a line with slope − 0.6 is shown to mimic the run of temperature in the disc between 10 and 200 au. (c) The radial-velocity profile on the equatorial plane, vr(r, z= 0). The velocity axis is linear, and velocity is given in units of the local sound speed. The radius axis is logarithmic. (d) The azimuthal velocity profile on the equatorial plane, vφ(r, z= 0). The axes are logarithmic, and lines with slopes of −1/2 and −1/4 are included to show that in the disc vφ∝r−1/4, corresponding to non-Keplerian differential rotation. Note that this plot has a larger radial extent than the others. (e) The radial profile of the disc aspect ratio,  . Both axes are linear.
4.4 Temperature
Fig. 3(b) shows radial-temperature profiles on the equatorial plane, T(r, z= 0), from Run 1. Throughout most of the disc, the run of temperature on the mid-plane approximates to T∝r−0.6. This is an intermediate between the scaling expected for a thin, non-self-gravitating, steady-state α-disc [which is heated by viscous dissipation, has a negative vertical temperature gradient, dT/d|z| < 0, and TEFF∝r−3/4 (Shakura & Syunyaev 1973)] and the scaling inferred from observations of protoplanetary discs around classical T Tauri stars [which are mainly heated by stellar irradiation, have a positive vertical temperature gradient, dT/d|z| > 0 and typically TEFF∝r−1/2 (Dullemond, Dominik & Natta 2001)]. Our simulations pertain to an earlier stage when the disc is self-gravitating and should be described as protostellar rather than protoplanetary. At this stage the infalling gas is heated impulsively when it encounters the accretion shock at the boundary of the disc; evidence for shock heating can be seen in the temperature spikes at the outer edge of the disc, in Fig. 3(b). Since the rate of infall on to the disc exceeds the rate of accretion through the disc and on to the primary protostar, the heating at the accretion shock dominates the energy budget of the disc. Subsequently, the gas is heated further by compression and viscous dissipation as it spirals inwards and on to the primary protostar, and therefore the vertical temperature gradient is negative, dT/d|z| < 0. Consequently, we anticipate that, as a disc adjusts from being protostellar to being protoplanetary, the 10 μm silicate feature will switch from absorption to emission, as the sign of the vertical temperature gradient changes from negative to positive.
4.5 Radial velocity
Fig. 3(c) shows radial-velocity profiles on the equatorial plane, normalized to the local isothermal sound speed, vr(r, z= 0)/a(r, z= 0), from Run 1. Once the disc is well established (i.e. by t=tO+ 8.1 kyr), the gas in the equatorial plane is in freefall, until it hits the accretion shock at the edge of the disc (100–200 au) at ∼ Mach 4. The gas away from the equatorial plane hits the accretion shocks bounding the disc above and below even faster, because these shocks are even deeper in the gravitational potential well of the core. Thus, the gas entering the disc is typically shock-heated to at least 100 K. The radial velocity of the gas in the disc is very tiny because the effective viscosity arising from gravitational torques is small, and therefore the gas takes many orbits to migrate inwards.
4.6 Azimuthal velocity
Fig. 3(d) shows azimuthal velocity profiles on the equatorial plane, vφ(r, z= 0), from Run 1. Throughout the disc, the gas is in approximate centrifugal balance; because the disc is massive and self-gravitating, this results in a profile with vφ(r, z= 0) ∝r−1/4[significantly flatter than a purely Keplerian  . Outside the disc, the infalling matter changes from its initial solid-body vφ(r, z= 0) ∝r to vφ(r, z= 0) ∝r−1, as it falls inside ∼6000 au.
4.7 Scaleheight
 , from Run 1. The aspect ratio is almost constant, at a value
  . Thus, the disc is neither flat nor flaring; rather the iso-density surfaces are approximately conical. Since the mid-plane density varies as ρ(r, z= 0) ∝r−5/2 and the scaleheight varies as
  , the surface density of the disc satisfies Σ(r) ∝r−3/2. [This is very similar to what is inferred for protoplanetary discs by Dullemond et al. (2001), but our discs are much younger and more massive.] It follows that the mass of the disc out to radius r is roughly MDISC(r) ∝r1/2, and hence the equilibrium azimuthal velocity should approximate to
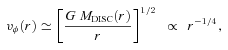
4.8 Disc growth
Fig. 4 shows the growth of the primary protostar, M★(t), and the growth of the disc, MD(t). The growth rates are roughly constant at  and
and  ; hence the disc grows faster than the primary protostar. The disc is marginally Toomre unstable (Toomre 1964, see Fig. 5), to the extent that weak spiral arms develop and contribute to the inward transport of material through the disc and on to the primary protostar. However, the disc is not self-regulating, in the sense that the rate of transport through the disc does not adjust so that
  . The disc is quite concentrated: typically more than 60 per cent of the disc mass has density ρ > 10−13 g cm−3. Radiative cooling times in the disc are sufficiently long so that the disc undergoes gravo-acoustic oscillations in the vertical direction, in response to the continuing infall of matter.
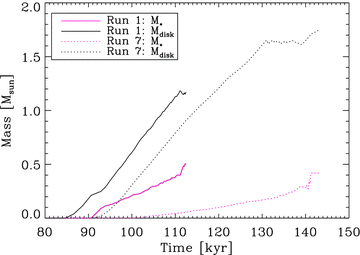
The masses of the primary protostar, M★(t) (magenta), and the protostellar disc, MD(t) (black), as a function of time, for Runs 1 and 7.
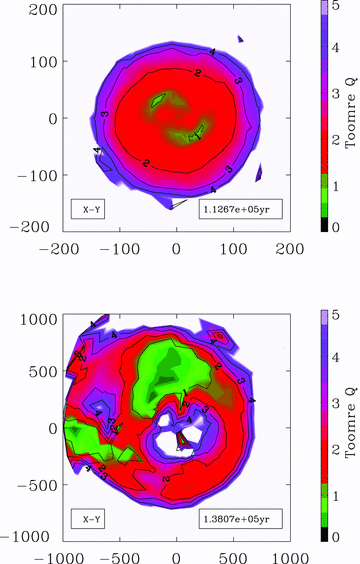
The Toomre parameter, QT, calculated for the face-on projections of Run 1 at t0+ 18.3kyr (left-hand plot), and Run 7 at t0+ 21.5 kyr (right-hand plot).
5 A HIGH ANGULAR MOMENTUM CORE
In this section, we describe the evolution of a high angular momentum core, having ΩO= 1.8 × 10⁻¹³ s−1, and hence jO= 3.3 × 1021 cm2 s−1 and β= 0.13. This is Run 7.
5.1 The Isothermal Collapse phase
The Isothermal Collapse Phase of Run 7 proceeds in the same way as for Run 1, except that, due to the higher angular momentum, departures from spherical symmetry occur sooner and are more extensive. As a result, the Isothermal Collapse Phase ends with the formation of a protostellar disc, and the primary protostar does not form for another 15 kyr, by which stage the disc extends to 700 au.
5.2 The Protostellar Phase
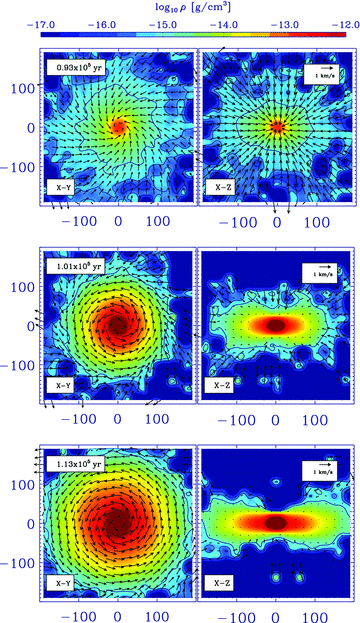
Fig. 6 shows velocity vectors superimposed on false-colour images of the density field on 2000 × 2000 au2 slices through the centre of the core during Run 7. These images correspond to times from just before the formation of the primary protostar at t=tO to t=t28. They show the growth and fragmentation of the protostellar disc. Densities and velocities are computed as in Fig. 2. The features that distinguish this high-ΩO run (Run 7) from the low-ΩO one discussed in the preceding section (Run 1) are (i) that the primary protostar grows much more slowly and acquires most of its mass via the disc (rather than by direct infall), and (ii) that the outer parts of the disc are able to fragment creating secondary protostars.
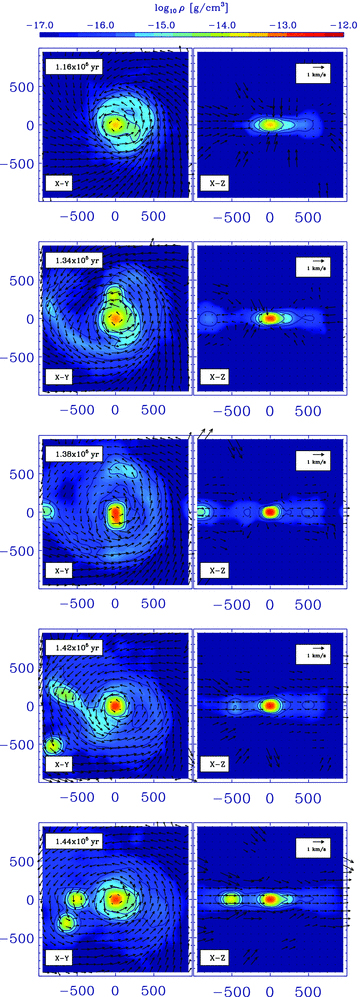
The density on slices through the centre of the core during Run 7. The left-hand (respectively right-hand) column shows slices at z= 0 (respectively y= 0). The times shown are (a) tO+ 11.8 kyr; (b) tO+ 29.7 kyr; (c) tO+ 33.7 kyr; (d) tO+ 33.7 kyr, zoomed to show the first long-lived fragment; (e) tO+ 38.0 kyr and (f) tO+ 40.0 kyr. In all cases the slices are 2000 × 2000 au2. The density scale ranges from 10−17 to 10−12 g cm−3, and contours are plotted at 10−16, 3 × 10⁻¹⁶ and 10−15 g cm−3. Velocity vectors are superimposed, and the insets show a 1 km s−1 vector.
5.3 Density
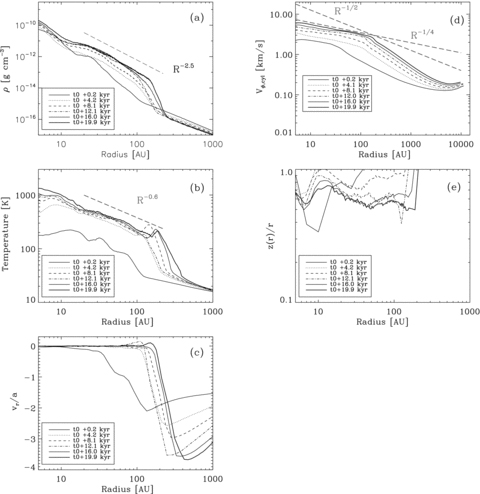
Fig. 7(a) shows azimuthally averaged radial-density profiles on the equatorial plane, ρ(r, z= 0) from Run 7. Most of the mass interior to 10 au is in the primary protostar. Outside this the disc extends to ∼100 au with ρ∝r−1.5, and then from ∼100 to ∼1000 au with ρ∝r−2.0. The disc in Run 7 is far more extended than that in Run 1, and its density profile is significantly shallower. The spikes superimposed on the density profiles are due to spiral arms and fragments condensing out of the disc.
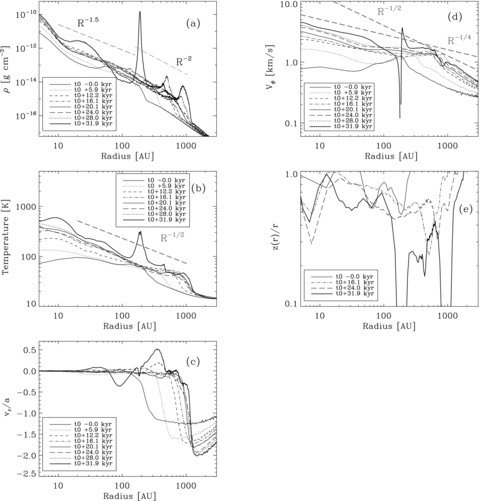
Profiles from Run 7 at times tO (i.e. the moment at which the primary protostar forms), tO+ 5.9 kyr, tO+ 12.2 kyr, tO+ 16.1 kyr, tO+ 20.1 kyr, tO+ 24.0 kyr, tO+ 28.0 kyr and tO+ 31.9 kyr (the end of the simulation). (a) The radial-density profile on the equatorial plane, ρ(r, z= 0). The axes are logarithmic, and lines with slopes −1.5 and −2.0 are shown to mimic the run of density in the disc from 10 to 100 au, and from 100 to 1000 au, respectively. The key gives the line-styles used to represent the different times. (b) The radial-temperature profile on the equatorial plane, T(r, z= 0). The axes are logarithmic, and a line with slope − 0.5 is shown to mimic the run of temperature in the disc between 10 and 1000 au. (c) The radial-velocity profile on the equatorial plane, vr(r, z= 0). The velocity axis is linear, and velocity is given in units of the local sound speed. The radius axis is logarithmic. (d) The azimuthal velocity profile on the equatorial plane, vφ(r, z= 0). The axes are logarithmic, and lines with slopes of −1/2 and −1/4 are included to show that in the disc vφ∝r−1/4, corresponding to non-Keplerian differential rotation. (e) The radial profile of the disc aspect ratio,  . The axes are linear.
5.4 Temperature
Fig. 7(b) shows radial-temperature profiles on the equatorial plane, T(r, z= 0), from Run 7. Throughout most of the disc, the run of temperature on the mid-plane approximates to T∝r−0.5, which is very similar to Run 1. However, in Run 7 the temperatures are lower. There are two reasons for this. First, because the disc is more extended, the material hitting the accretion shock at the boundary of the disc has fallen less far into the gravitational potential well of the core and is therefore moving more slowly; it is therefore not heated so much in the accretion shock. Secondly, again because the disc is more extended and therefore has lower surface density, but also because it is cooler, its cooling radiation can escape more readily. This in turn is the main reason why the disc in Run 7 is more prone to fragmentation. Since the rate of infall on to the disc greatly exceeds the rate of accretion on to the primary protostar (see below), the heating at the accretion shock again dominates the energy budget of the disc. Further heating by compression and viscous dissipation ensures that the vertical temperature gradient is negative,  . However, because the outer disc is very cool, we only expect to see the 10 μm feature in absorption from the inner disc. The spikes superimposed on the temperature profiles are due to fragments condensing out of the disc and being heated by compression.
5.5 Radial velocity
Fig. 7(c) shows radial-velocity profiles on the equatorial plane, normalized to the local isothermal sound speed, vr(r, z= 0)/a(r, z= 0), from Run 7. The gas in the equatorial plane is close to freefall until it hits the accretion shock at the outer edge of the disc. Because the disc is so extended, the material hitting the accretion shock is not moving very fast; for example, at the outer edge of the disc it is moving with vr < Mach 2. Thus, the gas entering the disc is only heated mildly. The radial velocity of the gas in the disc is small, although there are significant perturbations in the vicinities of fragments.
5.6 Azimuthal velocity
Fig. 7(d) shows azimuthal velocity profiles on the equatorial plane, vφ(r, z= 0), from Run 7. Throughout the disc the gas is in approximate centrifugal balance, but because the gravitational field is dominated by the mass of the disc, rather than the mass of the primary protostar, the profile is significantly flatter than Keplerian, i.e. 0 ≲ (− d ln vφ/d ln r) ≲ 0.25, except for where it is perturbed by a forming fragment. Outside the disc, the infalling matter changes from its initial solid-body vφ(r, z= 0) ∝r to vφ(r, z= 0) ∝r−1, as it falls inside ∼10 000 au.
5.7 Scaleheight
Fig. 7(e) shows radial profiles of the disc aspect ratio,  , from Run 7. The aspect ratio is almost constant at a value
  within the inner disc (r < 200 au), and it falls off slightly at larger radii, where it is strongly perturbed by spiral arms and fragments. Again, it is neither flat nor flaring; the iso-density surfaces are approximately conical. Since the mid-plane density follows 1.5 ≲ (−d ln ρ/d ln r) ≲ 2.0 and the scaleheight varies as
  , the surface density of the disc follows 0.5 ≲ (−d ln Σ/d ln r) ≲ 1.0, and the disc mass follows 0.5 ≲ (d ln MDISC/d ln r) ≲ 1.0. The azimuthal velocity should approximate to
  , hence 0 ≲ (− d ln vφ/d ln r) ≲ 0.25, as indeed it does (see Fig. 7d), modulo the fluctuations due to forming fragments.
5.8 Disc growth
Fig. 4 shows the growth of the primary protostar, M★(t), and the growth of the disc, MD(t), in Run 7. Until the disc starts to fragment, and then a fragment merges with the primary protostar, the growth rates are roughly constant at  and
and  . Thus, the disc not only forms before the primary protostar, but also grows much faster.
5.9 Fragmentation
Because the disc is massive, extended and cool, it becomes Toomre unstable (QT≲ 1; see Fig. 5), and strong spiral arms develop. Where the cooling time in the disc is shorter than the dynamical times, the disc fragments (Gammie 2001; Rice et al. 2003). The disc is only weakly concentrated: typically less than 20 per cent of the disc mass has density ρ > 10−13 g cm−3, and most of this dense gas is located in the spiral arms and fragments.
5.10 Individual fragments
The first fragment condenses out at t∼tO+ 30 kyr at ∼200 au. This fragment can be seen in Figs 6(b) and 8. At its inception, this fragment has mass ∼0.05 M⊙. Subsequently, it grows in mass, but at the same time it spirals inwards and at t∼tO+ 38 kyr it merges with the primary protostar. Two further fragments condense out at t∼tO+ 40 kyr, at ∼400 au and ∼600 au (see the fourth and fifth panel of Fig. 6). The simulation is terminated soon after their formation, so it is unclear whether they also merge with the primary protostar, or whether they survive as secondary companions.
The density field on 140 × 140 au2 slices through the centre of the first fragment to form during Run 7. The slice thickness is 6 au and the time shown is tO+ 33.7 kyr. The density scale ranges from 10−17 to 10−12 g cm−3, and contours are plotted at 10−16, 3 × 10⁻¹⁶ and 10−15 g cm−3. Velocity vectors are superimposed, and the insets show a 1 km s−1 vector.
5.11 Circum-fragmentary discs
Fig. 8 shows velocity vectors superimposed on false-colour images of the density field in 140 × 140 au2 slices through the first fragment to form. Densities and velocities are computed as in Fig. 2, but using co-ordinates measured relative to the centre of mass of the fragment. We see that the fragment is surrounded by a well-defined, rotationally supported circum-fragmentary disc (CFD). Very similar discs are found around the other fragments. Typically they have radii between ∼40 and ∼60 au.
5.12 Transport of angular momentum
Although most of the core mass infalls directly on to the disc, the spiral arms in the disc are effective at transporting angular momentum outwards, by means of gravitational torques, thereby allowing material to spiral inwards and accrete on to the primary protostar. Fragmentation further enhances the transport of angular momentum. This is because CFDs rotate in the same sense as the mother disc. Consequently, on the inside of a CFD (i.e. the side closest to the primary protostar) the shear between the material in the CFD and the material in the mother disc acts to slow down the material in the mother disc, thereby reducing its angular momentum. Conversely, on the outside of the CFD (i.e. further from the primary protostar), the shear between the material in the CFD and the material in the mother disc acts to speed up the material in the mother disc, thereby increasing its angular momentum.
5.13 Merging
Efficient transport of angular momentum by the CFD may cause a fragment to spiral inwards and merge with the primary protostar. However, it is possible that the inspiral is being artificially accelerated by our imposition of adiabaticity at densities ρ > 10−13 g cm−3, since this forces a fragment and its CFD to remain hot, extended and therefore very dissipative, rather than allowing them to continue contracting towards protostellar densities.
5.14 Disc mineralogy
Whereas in Run 7 the azimuthally averaged disc temperature never rises above ∼200 K, in Run 1 it rises above ∼500 K, and locally it reaches ∼800 K, sufficiently high to produce crystalline silicates. Thus, we might expect crystalline silicates to be present in discs forming from low-ΩO cores, and hence to give rise to characteristic features in the SEDs of single protostars. Conversely, we might expect crystalline silicates to be rare in the cold, extended discs forming from high-ΩO cores, and hence their characteristic features should be weak in – or even absent from – the SEDs of multiple protostars. The existence of a link between the amount of crystalline dust which can be found in protoplanetary discs and the initial conditions within the parental molecular cloud core has already been suggested by Dullemond, Apai & Walch (2006).
6 CORES WITH INTERMEDIATE ANGULAR MOMENTA
Referring now to the complete ensemble of Runs (1–7) (see Fig. 9), we note that, as ΩO increases, there is an essentially monotonic shift in the outcome; small departures from monotonicity at high values of ΩO can be attributed to the stochastic nature of fragmentation. Key parameters are presented in Table 1.
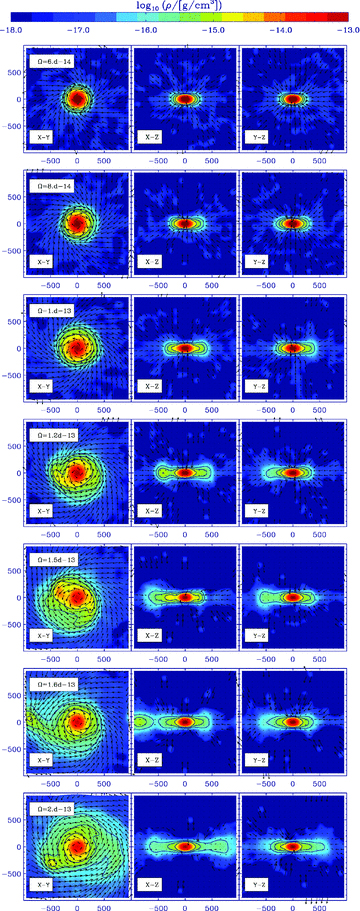
Disc formation as a function of core angular momentum. For all seven runs, we show the density of the discs within slices of thickness 10 au about the disc mid-plane (z= 0) at tfinal on the same scale. From top (Run 1) to bottom (Run 7) the core rotation Ω0 and thus the total initial core angular momentum are increasing.
For low ΩO, a substantial primary protostar is formed, surrounded by a compact, thick, hot disc; the disc is unable to fragment and simply accretes on to the primary protostar. As ΩO is increased, the growth rate of the primary protostar decreases, not least because it acquires an increasing fraction of its mass via the disc (rather than by direct infall). At the same time the disc becomes more massive, more extended and cooler. Eventually, for ΩO > 1.35 × 10⁻¹³ s−1 (Runs 5, 6 and 7), the disc becomes unstable against fragmentation, i.e. it satisfies both the Toomre and Gammie conditions (Toomre 1964; Gammie 2001). We are unable to ascertain whether all the resulting fragments merge with the primary protostar or whether some of them survive as secondary companions.
As ΩO increases, the time, tO, at which the primary protostar forms, increases, and its subsequent growth rate,  , decreases. Consequently, the overall pattern of accretion shifts from one in which the primary protostar forms first, and then the protostellar disc (low ΩO), to one in which the disc forms before the primary protostar (high ΩO).
Fig. 5 shows the Toomre parameter, QT, calculated for the face-on projections of Run 1 at t0+ 18.3 kyr (the left-hand plot), and Run 7 at t0+ 21.5kyr (the right-hand plot). In the warm, compact disc from Run 1, the lowest values of QT are in the range 1 ≲QT≲ 3, so that the disc develops weak spiral arms that transport angular momentum by exerting gravitational torques, but it does not fragment (cf. Lin & Pringle 1990; Laughlin & Bodenheimer 1994; Lodato & Rice 2004; Mejía et al. 2005). In the cool, extended disc from Run 7, QT falls below 1, leading to the growth of massive spiral arms and then fragmentation. This is consistent with recent findings of Rafikov (2005), Matzner & Levin (2005), Whitworth & Stamatellos (2006), Stamatellos, Hubber & Whitworth (2007a), Kratter, Matzner & Krumholz (2008), Rice & Armitage (2009), Clarke (2009), who suggest that in the inner disc (r≲ 50 au) fragmentation is highly unlikely, whereas it is possible at larger radii.
7 COMPARISON WITH OBSERVATIONS
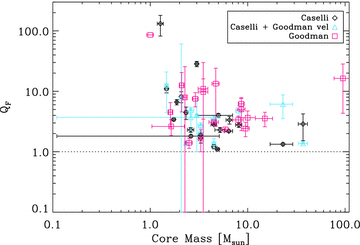
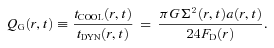
The parameter QF (see equation 13) is plotted against core mass, MO, for the core samples of Goodman et al. (1993), Barranco & Goodman (1998) and Caselli et al. (2002). Cores with QF < 1 are predicted to undergo disc fragmentation.
Although a few cores have QF∼ 1, none has QF < 1. We infer that none of these cores is strongly pre-disposed to fragment whilst material is still infalling from the core envelope. The observed angular speeds are too small, and the strong heating at the accretion shock (where the infalling envelope material meets the disc) acts to stabilize the disc.
This inference must be qualified as follows. (i) The core parameters used are very uncertain, in particular the core masses. (ii) Many of the cores appear already to have formed protostars (as evidenced by their association with IRAS sources), and even those that have not may already be in an advanced state of collapse. Therefore, the observed values of RO and ΩO may not be ‘initial’ in the sense we have defined them. (iii) Our simulations do not take account of the low levels of turbulence observed in such cores. (iv) We do not rule out the possibility that at a later stage, once infall ceases, some of these protostellar discs cool and fragment, particularly if more efficient cooling due to dust operates.
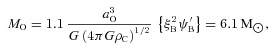
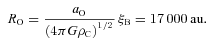
8 CONCLUSIONS
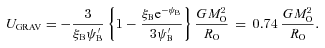
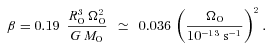
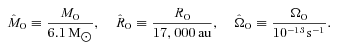
We have performed simulations of the collapse of rigidly rotating pre-stellar cores. Each core is initially a mildly supercritical BES (ξB= 6.9), with its density increased by 10 per cent, and contained by external pressure. The gas is pure molecular hydrogen with T= 28 K (hence the isothermal sound speed is 0.34 × 105 cm s−1), the initial central density is ρC= 10−18 g cm−3, the core mass is MO= 6.1 M⊙, its initial radius is RO= 17 000 au and its external pressure is PEXT=kB 5.5 × 105 cm−3 K. The initial angular speed is varied from ΩO= 0.6 × 10⁻¹³ s−1 to ΩO= 1.8 × 10⁻¹³ s−1 (corresponding to 0.013 < β < 0.12).
A slowly rotating core collapses to form a relatively massive primary protostar, and then a protostellar disc grows around this protostar. The disc is massive, but quite hot and compact, and so it does not fragment; it simply accretes on to the primary protostar. There is some observational evidence for the existence of massive discs (e.g. Eisner et al. 2005; Rodríguez et al. 2005; Greaves et al. 2008; Mann & Williams 2009). However, the phase we have simulated is short lived and still deeply embedded in the parental core, so our discs would be rather hard to observe. We conjecture that such discs will show signatures of crystalline silicates out to disc radii of several au.
A rapidly rotating core collapses initially to form a protostellar disc, and then a protostar condenses out at the centre. The protostar acquires almost all its mass via the disc, and therefore it grows quite slowly. The disc is extended, cool and thin, and tends to fragment.
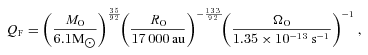
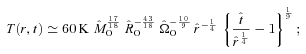
On the basis of an analytic model, we obtain a condition on the mass, initial radius and initial angular speed of a core (equation 13) such that its protostellar disc will fragment, whilst material is still infalling from the core envelope. Applying this condition to observed samples of cores, we predict that such fragmentation is unlikely.
In a companion paper (Walch et al., in preparation), we explore how these results are fundamentally changed if a pre-stellar core is turbulent, but has the same net angular momentum as the cores modelled here.
We thank D. Neufeld for providing the cooling tables. SW performed this work with support from the International Max-Planck Research School, the DFG Cluster of Excellence Origin and Structure of the Universe (www.universe-cluster.de) and the Marie Curie RTN Constellation (MRTN-CT-2006-035890). We thank the referee for his/her detailed and thoughtful comments, which were very helpful.
REFERENCES
Appendix
APPENDIX A: Analytic model
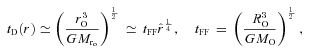
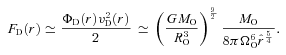
 ‘interior to it’ in the disc, and ends up at radius r with angular speed ΩD(r) =ΩOr2O/r2. Centrifugal balance then requires that
 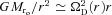 , and hence

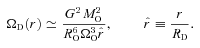
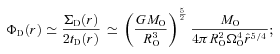
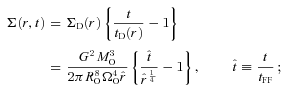
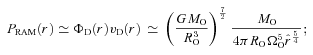
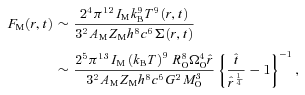
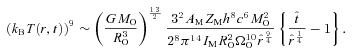

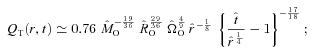
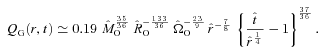
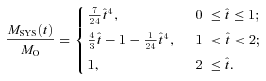
 ), MSYS≃ 0.29MO, and since this is very close both to the juncture when the disc is most unstable and to the juncture at which we compare simulations with different ΩO, we will evaluate the stability of the discs at this time too. At t=tFF, the disc is complete out to RD/16, and is just starting to form at RD, so between these radii the disc is actively accreting. From equation (A17), we see that the accreting disc is most unstable (Toomre QT∼ 1.07) at RD/16, and this is basically where the simulated discs with high ΩO tend to fragment. The condition for the disc to be able to cool fast enough to fragment at RD/16 (i.e. Gammie QG < 1) then reduces to
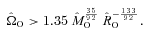
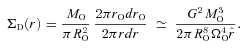
 but not for
  . It also indicates how the criterion for fragmentation scales with core mass and radius, and we exploit this to analyse observed cores in Section 7. The analytic model also accords well with the simulations in predicting that fragmentation should occur near RD/16, which for those discs that fragment is between ∼200 and ∼700 au (cf. Matzner & Levin 2005; Rafikov 2005; Whitworth & Stamatellos 2006).