


Abstract
The intent of this study is to determine the nature of the star and associated nebulosity S 235 B, which are located in a region of active star formation still heavily obscured by the parent molecular cloud. Low-resolution (R= 400) long-slit spectra of the star and nebulosity, and medium- (R= 1800) and high-resolution (R= 60 000) spectra of the central star are presented along with the results of Fabry–Perot interferometric imaging of the entire region. Based on the long-slit and Fabry–Perot observations, the nebulosity appears to be entirely reflective in nature, with the stellar component S 235 B★ providing most of the illuminating flux. The stellar source itself is classified here as a B1V star, with emission-line profiles indicative of an accretion disc. S 235 B★ thus belongs to the relatively rare class of early-type Hebrig Be stars. Based on the intensity of the reflected component, it is concluded that the accretion disc must be viewed nearly edge-on. Estimates of the accretion rate of S 235 B★ from the width of the Hα profile at 10 per cent of maximum intensity, a method which has been used lately for T Tauri stars and Brown Dwarfs, appear to be inconsistent with the mass outflow rate and accretion rate implied from previous infrared observations by Felli et al., suggesting this empirical law does not extend to higher masses.
1 INTRODUCTION
Located near the large star-forming complex S 235, the nebulosity S 235 B is associated with a separate, much younger, deeply embedded infrared (IR) cluster (Hodapp 1994), called the S 235 A-B cluster. At a distance of ≈1.8 kpc (Nakano & Yoshida 1986) and an angular size of 20 arcsec in Hα, the S 235 B nebulosity can be estimated to have a physical size on the order of 35 000 au. A stellar component, denoted S 235 B★, is visible towards the nebulosity in the optical and coincides with Two Micron All Sky Survey (2MASS) and UKIRT Infrared Deep Sky Survey (UKIDSS) point sources, which are the brightest near-IR sources in the cluster.
Glushkov, Denisyuk & Karyagina (1975) first noted the broad and asymmetrical nature of the double-peaked Hα emission in S 235 B, along with the absence of [N ii] and [S ii] lines characteristic of emission nebulae. Felli et al. (2006) suggest that the strong Brγ emission, together with weak 3.6 cm continuum emission, can be explained by an ionized envelope around a lower luminosity star. However, this is at odds with the large mass loss of 4 × 10⁻⁶ M⊙ yr−1 found in the same work, which would imply a fairly luminous star.
Even with all the available data, S 235 B has remained unexplained for the 35 years since its discovery by Glushkov, Denisyuk & Karyagina (1974). Many previous studies (Tokunaga & Thompson 1979; Krassner et al. 1982; Felli et al. 1997 among others) have assumed that the hydrogen line emission is nebular in nature. However, the broad double-peaked Hα line profile and lack of other nebular emission lines suggest that such an assumption is erroneous. Consequently, determinations of extinction and parameters of the S 235 B nebula and star based on this assumption should be regarded with caution.
Given that S 235 B★ is the brightest object in the S 235 A-B cluster in all optical and near-IR broad-bands from U to K, it is a good candidate for the most massive star in the cluster. The correlation between cluster mass and the most massive member of the cluster shown by Weidner & Kroupa (2006) makes the clarification of the nature of S 235 B and its central star especially attractive for understanding the S 235 A-B cluster as a whole.
The observations presented in this paper show S 235 B★ to be an early-type (B1V) Herbig Be (HBe) star surrounded by an accretion disc. A fundamental question of such objects is the rate at which material is accreted. Given the mass inferred from the spectral type (>10 M⊙), S 235 B★ is likely already on the main sequence. While an empirical relation has been found between accretion rates and Hα line widths of less massive pre-main sequence stars such as T Tauri stars (TTs) and brown dwarfs (Natta et al. 2004), the applicability of this to more massive main sequence stars remains unclear. This question is examined for the case of S 235 B★ in Section 3.3.
2 OBSERVATIONS AND DATA REDUCTION
All observations were made on the 6 m Large Altazimuth Telescope (BTA) of the Special Astrophysical Observatory of the Russian Academy of Sciences (SAO RAS). Fabry–Perot interferometry (FPI) and slit spectroscopy were performed using the Spectral Camera and Optical Reducer for Photometric and Interferometric Observations (SCORPIO) focal reducer (Afanasiev & Moiseev 2005) and the 2048 × 2048 EEV 42-40 CCD. High-resolution echelle spectroscopy was performed using the Nasmyth Echelle Spectrometer (NES) echelle spectrometer (Panchuk et al. 2009) at the Nasmyth focus of the telescope and the 2048 × 2048 Loral CCD.
2.1 Fabry–Perot images
Fabry–Perot scanning interferometry was performed 2008 February 13. A 6.1 × 6.1 arcmin2 area of the S 235 A-B cluster, including S 235 A and S 235 B, was covered with a seeing of 2.0 arcsec. The total exposure time was 6480 s. The desired spectral range in the vicinity of the Hα line was isolated using a narrow-band filter (FWHM = 15 Å). The width of the free spectral interval between neighbouring orders of interference was 13 Å (600 km s−1). The FWHM resolution of the interferometer was 0.8 Å (35 km s−1) for a 0.37 Å/channel scale. Image sampling was 0.70 arcsec per pixel.
36 successive interferograms of the area were taken with different gaps between the plates of the interferometer. Ghost images which appear in the plates of the interferometer were removed using the algorithms described by Moiseev & Egorov (2008). The observational data were reduced using an idl-based software package (Moiseev 2002; Moiseev & Egorov 2008). After primary reduction, night skyline subtraction and wavelength calibration, the observations were reduced into the form of a data cube, where each pixel in the field of view contains a 36-channel spectrum. The final angular resolution corresponds to 2.3 arcsec seeing. To increase the signal-to-noise ratio in regions with low surface brightness, the data were smoothed with a two-dimensional Gaussian to an angular resolution of 2.8 arcsec.
2.2 Slit spectra
Medium-resolution slit spectroscopy was conducted in the period 2007 October 31 to 2007 November 2 using the multislit mode of SCORPIO, and low-resolution spectroscopy was conducted 2008 January 13–14 using the long-slit mode of SCORPIO. The slit size is 1.2 × 18 arcsec2 in multislit mode and 1.0 arcsec × 6 arcmin in long-slit mode. Effective exposure times were 5400 and 2700 s for the multislit and long-slit observations, respectively. A single 60 s exposure was used for Hα in the long-slit mode, which was saturated in longer exposures. The spectral range for the medium-resolution spectra is 6000–6900 Å, with a resolution of 5 Å, while the range for the low-resolution spectra is 3800–7200 Å, with a resolution of 10 Å. The position angle of the long slit was 104°. The long-slit position is overlaid on an R image obtained on the 6 m in the inset of Fig. 1. Detected spectral features are shown in Table 1.
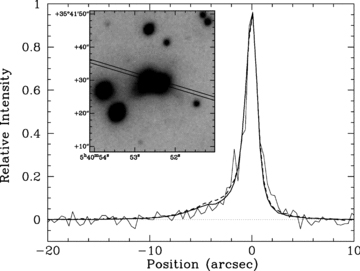
Continuum-subtracted spatial intensity profile for the Hα emission line (thick solid line) and the He i 6678 absorption line (thin solid line), and the continuum emission (thick dashed line) interpolated at the centre of Hα. All lines have been scaled to the same relative intensity. The inset shows the position of the long slit overlaid on an R image of S 235 B.
Detected spectral features. Where available, wavelength information from the medium-resolution spectra is used (indicated by blank lines in the wavelength range of 6000–6900 Å). Aw sign indicates a weak detection. Wavelengths of feature bands taken from Hernández et al. (2004); Fe ii from Meinel et al. (1968).
| Feature | Central wavelength (Å) | Detected wavelength (Å) |
| Hγ | 4340.5 | 4340.9 |
| Hβ | 4861.3 | 4860.9 |
| Fe ii | 5018.4 | 5016.6 |
| Fe ii | 5169.0 | 5166.1 |
| Unidentified | … | 5269.15 |
| Unidentified | … | 5326.94 |
| He i+ Na i+ TiO | 5876 | 5888.4 |
| O i | 6300.30 | 6299.18 |
| Fe ii | 6318.0 | 6317.2 |
| O i | 6363.8 | 6363.2 |
| Fe ii | 6383.7 | 6383.7 |
| Hα | 6562.8 | 6562.1 |
| He i | 6678.2 | 6680.1 |
| He i+ TiOw | 7066 | 7073.1 |
The slit spectra were reduced and calibrated using standard iraf1 tasks. Detector response was corrected for with standard star observations taken on the same night, giving flux-calibrated data. Spatial profiles of spectral lines in the long-slit spectra were made by integrating the intensity along the dispersion axis at each pixel along the position axis using the iraf task sbands. These apertures were chosen to include the entire width of the line with as little continuum emission as possible. Apertures for determination of the continuum contribution to the line emission were selected on either side of the line, with the contribution at the centre of the line calculated by linear interpolation.
2.3 Echelle spectra
High-resolution spectroscopy around Hα was carried out on 2007 September 30 using the NES instrument, with an effective exposure time of 10 800 s and a resolution of 0.1 Å (4.6 km s−1) in the range of 5200–6700 Å. Because of the exceptionally low brightness of this object (R≈ 16) for high-resolution spectroscopy, an image slicer was used instead of the standard entrance slit, which increases the amount of incident light on the entrance of the spectrograph by three times. A Th-Ar lamp was used for wavelength calibration. All data reduction, including bias-subtraction, removal of scattered light, flat-fielding, cosmic-ray removal and wavelength calibration was done in eso-midas using a custom package for extracting echelle spectra taken with an image slicer (Naidenov, Panchuk & Yushkin 2007).
3 RESULTS
3.1 S 235 B nebulosity
The nature of the optical nebulosity which makes up S 235 B has not been conclusively established in previous works (see e.g. Glushkov et al. 1975; Felli et al. 2006). The long-slit optical spectroscopic observations presented here provide a means to clarify the nature of the S 235 B nebula, be it emission, reflection or some combination of the two.
Fig. 1 shows the intensity profiles for the He i 6678 line, which is in absorption, and Hα, which is in emission. For comparison, the continuum emission interpolated at the centre of Hα is overlaid. The presence of a stellar absorption line in the nebulosity is a clear indication of a reflection component. Furthermore, the continuum emission closely matches the He absorption, with only small differences near −5 arcsec. This implies that the observed continuum originates almost entirely in S 235 B★. Similar phenomena have been observed in other gaseous regions, for example, the He ii 4686 line is observed in absorption in the Orion Nebula (Peimbert & Goldsmith 1972).
The shape of the spatial intensity profile for Hα does not differ from that of the continuum interpolated from neighbouring wavelengths. This implies that all of the observed Hα emission originates at or near the star, with the extended Hα emission due to reflection. The nebula is thus concluded to be purely reflective in nature. Furthermore, Fig. 2 shows Hα radial velocity profiles for several apertures in S 235 B; the position of the absorption peak, as well as the qualitative behaviour of the double-peaked emission, does not significantly change anywhere in the nebulosity.
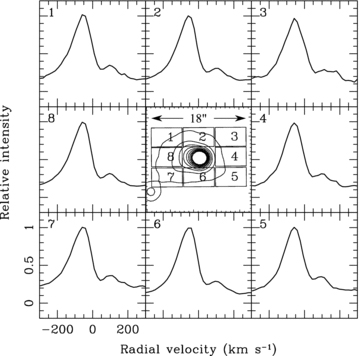
Profiles of Hα intensity averaged over eight different apertures, with a size of 5 × 10 arcsec each. The central image shows contours of the FPI data at 6562 Å. All profiles are scaled to a relative intensity of 1.0 and cover a range of radial velocities from −300 to 300 km s−1. The number in the top left of the profiles is the aperture number.
The strength of the reflection component compared to the direct line-of-sight emission from the star, as seen in Fig. 1, indicates that the direct component must be heavily absorbed, probably by the presence of a circumstellar disc with a high-inclination angle relative to the line of sight. This is also supported by the high visual extinction of AV≈ 8–12 mag derived by Felli et al. (1997).
3.2 S 235 B★
By comparing the S 235 B★ spectrum (Fig. 3) with those from an atlas of Be stars (Hubert-Delplace & Hubert 1979), the star is determined to be of type B1V. The main criteria for this comparison were the presence of the Fe ii emission lines at 5018 and 5169 Å, the He i (5876 Å) line and Na i (5890/96 Å) doublet in absorption, and an absence of other strong features. The star which best satisfies these criteria is HD 200120, which has a spectral type of B1V. Krassner et al. (1982) determined that the spectral type for a single ‘exciting source’ of the S 235 B nebula should be about B0-0.5, under the assumption that the observed hydrogen emission is nebular in nature. This apparent agreement with the spectral type found here should be regarded as fortuitous coincidence at best, as the S 235 B nebula itself does not appear to show any emission component, with all the observed emission being due purely to reflection.
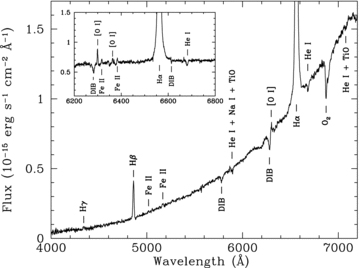
Low-resolution (long-slit) spectrum of S 235 B, with the medium-resolution (multislit) spectrum shown in the inset. Identified features are listed in Table 1.
The spectral type, emission-line spectrum, surrounding nebulosity and location within an active star-forming region all qualify S 235 B★ as a HBe star according to the original definition given by Herbig (1960). S 235 B★ also shows a large H−K excess in the 2MASS data, which is both strong evidence for an accretion disc and becoming an additional criterion for defining Herbig Ae/Be (HAeBe) stars (Waters & Waelkens 1998). The 2MASS H−K excess is found to be E(H−K) = 1.04 in the photometric system used by Bessell & Brett (1988), where the intrinsic colour for a main-sequence B1V star was taken from Kenyon & Hartmann (1995). Classification of S 235 B★ as a HBe star is also supported by the presence of Fe ii lines in emission at 5018 and 5169 Å (multiplet 42), as well as 6318 and 6384 Å, which are noted to occur in HAeBe stars (Meinel, Aveni & Stockton 1968; Hernández et al. 2004). The forbidden lines [O i] 6300, 6364 Å have also been found to occur in many HAeBe candidate objects. Vieira et al. (2003) found that forbidden lines ([O i] and/or [S ii]) occur in 54 per cent of B stars (compared with 30 per cent of A stars) in their list of 131 HAeBe candidates.
The shape of the Hα spectral profile (Fig. 4) can be classified as type III using the classification scheme presented in Reipurth, Pedrosa & Lago (1996), i.e. there are two peaks, with the secondary peak having less than half the strength of the primary, and is suggestive of ongoing accretion processes around the star (Muzerolle et al. 2003). Both Reipurth et al. (1996) and Vieira et al. (2003) found this to be the second most common class for HAeBe stars, containing 20 per cent of the stars in their samples. Furthermore, Manoj et al. (2006) found that the equivalent width of the Hα emission line and derived ages for HAeBe stars are correlated, with younger stars having larger equivalent widths. Of the 43 stars in their sample with an equivalent width greater than 20 Å, 84 per cent are younger than 3 Myr. S 235 B★ has an Hα equivalent width of −250 Å in the low-resolution spectrum (Fig. 3), which far exceeds the widths from the sample of Manoj et al. (2006). This implies a very young age (<3 Myr) for S 235 B★.
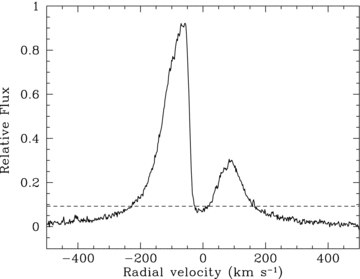
Hα echelle spectrum. The dashed line indicates the level at 10 per cent of the maximum intensity, which has a width of 400 km s−1.
As outlined in Section 3.1, the S 235 B nebulosity appears to be purely reflective in nature. In order to assess whether this agrees with expectations for a B1V star, the gas density that would result inside a Strömgren sphere (Strömgren 1939) with a radius of 900 au (0.5 arcsec at 1800 pc, i.e. just below the spatial resolution of the observations) was calculated, using the ionizing flux found from an appropriate model atmosphere (Kurucz 1979). The expected gas density was found to be ∼1 cm−3, which is much lower than the expected interstellar medium (ISM) density. Thus, any ionized region around S 235 B★ would be much smaller than 900 au in radius, and thus remain spatially unresolved in the observations presented.
3.3 Accretion rate of S 235 B★
While the interplay of accretion and outflow processes in the formation of hydrogen emission-line profiles is not yet fully understood, several methods exist for estimating the strengths of both these processes. Of particular interest for these observations is the technique developed by Natta et al. (2004), who showed a correlation between Hα line widths at 10 per cent of maximum intensity and mass accretion rates  over a range of masses (0.04–0.8 M⊙), covering very low-mass objects (VLMOs), brown dwarfs (BDs), and TTs. van den Ancker (2005) showed that the empirical relation between accretion luminosity and Brγ luminosity for HAeBe stars matches that of TT stars. In the light of this, it is reasonable to propose that the
  relation found by Natta et al. (2004) can be used to obtain a rough estimate of the mass accretion rate in HAeBe stars.
In order to test the plausibility of this relationship for a massive HBe star, it is necessary to obtain an estimate of the accretion rate by at least one other method. Calvet et al. (2004, equation 3) derived a relation between Brγ luminosity L(Brγ) and accretion luminosity Lacc as determined from UV veiling for a sample of objects up to about 4 M⊙ in mass and with L(Brγ) up to about 3 × 10⁻³ L⊙. This relation was subsequently used by Garcia Lopez et al. (2006) to find accretion rates for a sample of HAe stars, up to a mass of about 5 M⊙; it must be noted, however, that the three stars with L(Br γ) ≳ 0.1–0.2 L⊙ were excluded from this analysis because of concerns over the validity of equation (3) from Calvet et al. (2004) in this regime.
Previous observations in the near-IR by Felli et al. (1997) measured Brγ in S 235 B, with an integrated flux of F(Br γ) = (2.0 ± 0.4) × 10−12 erg s−1 cm−2. At a distance of 1800 pc, this corresponds to a Brγ line luminosity of LBrγ= 0.2 L⊙. Although the large extinction observed in S 235 B★ is clearly not interstellar in nature, assuming a standard interstellar reddening law (Rieke & Lebofsky 1985) and value of AV≈ 10 mag found by Felli et al. (1997) would increase this by about three times. Using a Brγ luminosity of 0.2–0.6 and equation (3) of Calvet et al. (2004) gives an accretion luminosity of Lacc= 190–500 L⊙. For a B1V star with a mass of 13 M⊙ and a radius of 5 R⊙, this corresponds to a mass accretion rate2 of  .
.
The width of the Hα line at 10 per cent of the maximum intensity is found to be 400 km s−1. From fig. 3 of Natta et al. (2004), this corresponds to a mass accretion rate for S 235 B★ of  . This is consistent with accretion rates for many other HAeBe stars (see e.g. Muzerolle et al. 2004; van den Ancker 2005; Garcia Lopez et al. 2006), yet differs by three orders of magnitude from the accretion rate derived from the Brγ emission. The accretion rate derived from the Brγ flux above is comparable with the mass-loss rate of 4 × 10⁻⁶ M⊙ yr−1 derived by Felli et al. (2006), which suggests that the relation between the width of the Hα emission at 10 per cent intensity and the mass accretion rate (Natta et al. 2004) does not hold for high-mass stars. The accretion rate in this object is, therefore, probably much higher than indicated by the Hα width, and closer to that obtained from the Brγ flux, although the validity of both techniques for luminous, massive objects has not been thoroughly tested.
4 DISCUSSION AND CONCLUSIONS
Using low- and medium-resolution spectra, S 235 B★ was classified as a B1V star. Its location in a region of active star formation, the presence of the nearby nebulosity S 235 B, the Balmer emission lines in the stellar spectrum and the large H−K excess firmly establish its character as an HBe star. Furthermore, the Fabry–Perot observations and long-slit spatial intensity profiles of the Hα, He i 6678 and continuum emission show that the S 235 B nebulosity is reflective in nature, with S 235 B★ as the illuminating source.
Many previous studies of the S 235 B region have determined the visual extinction to this object based on the Balmer emission lines, which erroneously assume this emission to be nebular in nature. At the same time, Krassner et al. (1982) derived AV≈ 6–7 mag based on the (B−J) and (B−I) colours for a B0 star. Combined with the derivations from Balmer lines of hydrogen, the range of estimates of AV for this object span an enormous range, from at least 6 to 19 mag. Reflection and effects of disc geometry no doubt complicate the matter further, and any conclusions which depend on the amount of reddening should be regarded very cautiously.
The B1V spectral classification of S 235 B★ implies that it belongs to a rare class of objects, namely early-type HBe stars. In the list of 131 HAeBe candidates composed by Vieira et al. (2003), only 18 stars have a spectral type of B1 or earlier, with only 10 of those having a ‘well-determined’ spectral type. Krassner et al. (1982) measured a B magnitude of 17.8 ± 0.3 mag for this object, making it by far the dimmest HAeBe star compared with the lists composed by Hernández et al. (2004) and Vieira et al. (2003), where such faint stars would have been excluded by their selection criteria. However, as this work shows, the nature of such dim HAeBe stars and surrounding nebulosities can still be adequately explored in the optical using standard techniques.
Some small deviations from a perfect reflection scenario can be seen in the Hα and He i 6678 near −5 arcsec in the spatial intensity profiles in Fig. 1. A possible explanation for this is that different positions in the surrounding dust cloud are reflecting different views of the star and disc, changing the relative intensity of the emission from each. This could also explain the variations of the Hα intensity profiles at different positions in the nebula visible in the FPI data (Fig. 2). Furthermore, there is evidence for time variability of the Hα profile in S 235 B. Glushkov et al. (1975) reported that the blue component of the Hα intensity profile was 1.5 times as intense as the red component in their observations with a spectral resolution of 1 Å (45 km s−1). The FPI observations presented in this paper have a comparable resolution of 0.8 Å (35 km s−1), and the blue component is 3.5 times as intense as the red component. Vieira et al. (2003) reports that of the 22 HAeBe stars observed more than once over 9 years, 13 showed significant changes in their Hα profiles. Changes in the shape of the Hα emission profile would take months to propagate out to distances of 10–20 000 au. Prolonged observations of such propagations as they occur in S 235 B, or other HAeBe stars situated near large reflection nebulae, would allow for detailed analysis of the structure of the surrounding dust.
While the Brγ flux and Hα width can both potentially provide an estimation of accretion rates/luminosities for certain classes of objects, the applicability to more massive stars of the empirical relation between Hα width and accretion rate found by Muzerolle, Calvet & Hartmann (1998) remains unclear. Given the extensive amount of high-resolution observations of Hα profiles for HAeBe stars, and the apparent coincidence of the correlation between accretion luminosities found by UV excess and Brγ flux for both TT and HAeBe stars by van den Ancker (2005), this question should be investigated further.
iraf is distributed by the National Optical Astronomy Observatories, which are operated by the Association of Universities for Research in Astronomy, Inc., under cooperative agreement with the National Science Foundation.
The accretion luminosity and accretion rate are related by  .
.
Special thanks to Evgenii Chentsov for insight about spectral features, to Arjan Bik and Aurora Sicilia-Aguilar for useful discussions, and Sergei Dodonov for conducting the echelle observations. The observations presented in this paper were made using the 6 m Large Altazimuth Telescope (BTA) of the Special Astrophysical Observatory of the Russian Academy of Sciences. This research was supported in part by the Russian Foundation for Basic Research, grant 07-02-00628-a.
REFERENCES
