


Abstract
High-resolution submillimetre (submm) imaging of the high-redshift radio galaxy (HzRG), 4C 60.07, at z= 3.8, has revealed two dusty components of roughly equal integrated flux. Spitzer imaging shows that one of these components (‘B’) is coincident with an extremely red active galactic nucleus (AGN), offset by ∼4 arcsec (∼30 kpc) from the HzRG core. The other submm component (‘A’) – resolved by our synthesized beam and devoid of emission at 3.6–8.0μm – lies between ‘B’ and the HzRG core. Since the radio galaxy was discovered via its extremely young, steep-spectrum radio lobes and the creation of these lobes was likely triggered by the interaction, we argue that we are witnessing an early-stage merger, prior to its eventual equilibrium state. The interaction is between the host galaxy of an actively fuelled black hole (BH) and a gas-rich starburst/AGN (‘B’) marked by the compact submm component and coincident with broad CO(4–3) emission. The second submm component (‘A’) is a plume of cold, dusty gas, associated with a narrow (∼150 km s−1) CO feature, and may represent a short-lived tidal structure. It has been claimed that HzRGs and submillimetre-selected galaxies (SMGs) differ only in the activity of their AGNs, but such complex submm morphologies are seen only rarely amongst SMGs, which are usually older, more relaxed systems. Our study has important implications: where a galaxy's gas reservoir is not aligned with its central BH, CO may be an unreliable probe of dynamical mass, affecting work on the co-assembly of BHs and host spheroids. Our data support the picture wherein close binary AGN are induced by mergers. They also raise the possibility that some supposedly jet-induced starbursts may have formed co-evally (yet independently of) the radio jets, both triggered by the same interaction. Finally, we note that the HzRG host would have gone unnoticed without its jets and its companion, so there may be many other unseen BHs at high redshift, lost in the sea of ∼5 × 10⁸ similarly bright Infrared Array Camera (IRAC) sources – sufficiently massive to drive a >1027-W radio source, yet practically invisible unless actively fuelled.
1 INTRODUCTION
Radio galaxies are believed to host actively fuelled, spinning black holes (BHs) which power their immense radio luminosities and fashion their characteristic double lobes (Fanaroff & Riley 1974; Rees 1978; Blandford & Payne 1982; McCarthy 1993). High-redshift examples of the phenomenon [high-redshift radio galaxies (HzRGs)] have often been identified as ultrasteep-spectrum (USS) emitters in radio surveys1 (e.g. Bornancini et al. 2007) and are thus selected during their extreme youth (≤10 Myr; Blundell & Rawlings 1999). Nowadays, a wealth of unequivocal evidence also links HzRGs with very massive galaxies in the early Universe. Near- and mid-infrared (IR) observations show that HzRGs are associated with the most massive stellar populations at any given redshift (Best, Longair & Röttgering 1998; Seymour et al. 2007). Direct evidence of vast reservoirs of atomic and molecular hydrogen has also been established, via observations of strong H i absorption against luminous, morphologically complex Lyα haloes – often extending 100–200 kpc from the central radio galaxy – and via detections of CO and dust (Hippelein & Meisenheimer 1993; Papadopoulos et al. 2000; Archibald et al. 2001; De Breuck et al. 2003, 2005; Reuland et al. 2003, 2004; Klamer et al. 2005; Villar-Martín et al. 2006).
If HzRGs pinpoint the most massive galaxies out to the highest redshifts then we expect these systems to signpost the most massive peaks in the primordial Universe and to evolve into today's brightest galaxies – cD-type ellipticals.2 In accord with these expectations, the environments of HzRGs are overdense in a rich variety of galaxy types, including submillimetre (submm)-selected galaxies (SMGs). The first example, still the most striking, is the field of 4C 41.17 at z= 3.8 (Ivison et al. 2000; Greve et al. 2007), and Stevens et al. (2003) presented low-resolution submm imaging of a further six HzRGs. Some of these displayed evidence of extended (∼5–20 arcsec, ∼30–150 kpc) dust emission (and UV emission; Hatch et al. 2008), suggesting that starbursts in HzRGs differ from the compact events seen in local ultraluminous IR galaxies (ULIRGs) and, indeed, in the general z∼ 1–3 SMG population as probed by high-resolution CO and submm radio continuum imaging (≲0.5 arcsec, or ≲4 kpc; Chapman et al. 2004; Tacconi et al. 2006, 2008; Biggs & Ivison 2008; Younger et al. 2008b), i.e. that the mechanism for the formation of these very massive galaxies may be fundamentally different to that of ≳L★ galaxies forming from SMGs (Smail et al. 2004).
Probing the size and morphology of the rest-frame far-IR emission in HzRGs is thus a key piece in the puzzle of galaxy formation. With the ∼14-arcsec [Full width at half-maximum (FWHM)] spatial resolution usually available, we have been unable to distinguish between entirely different modes for the formation of the most massive galaxies. One could imagine HzRG host galaxies assembling via a massive, widespread burst with a low overall star formation density, or within multiple gas-rich subcomponents destined to merge. Evidence from mm interferometric imaging has been enlightening, though the need for imaging on a range of spatial scales is often evident: De Breuck et al. (2005) found evidence for two gas components in the 4C 41.17 system whilst Papadopoulos et al. (2000) argued for a galaxy-wide starburst in another HzRG, 4C 60.07, with gas being consumed on a scale of ∼30 kpc, and for a gas reservoir more commensurate with local ULIRGs in another, 8C 1909+722.
4C 60.07 is a powerful double-lobed Fanaroff–Riley II (FR II) radio galaxy – one of the brightest of the HzRGs observed by Archibald et al. (2001) and Reuland et al. (2004) in the submm waveband. The radio spectrum of 4C 60.07 is unremarkable at low frequencies, with a spectral index, α=−0.9 between 38 and 178 MHz (where Sν∝να), but its spectrum steepens at higher frequencies, reaching α=−1.6 between 4.9 and 15 GHz, hence its selection as an USS radio emitter and its eventual identification with an RVega∼ 23.2 galaxy at z= 3.7887 ± 0.0007 (Chambers et al. 1996; Röttgering et al. 1997; Reuland et al. 2007).
In this paper we present submm interferometry of 4C 60.07, utilizing the Submillimetre Array (SMA)3 (Ho, Moran & Lo 2004) at a wavelength of 890 μm with a spatial resolution of ∼2 arcsec and high astrometric precision – the first high-resolution submm continuum image of an unmistakably massive galaxy at z∼ 4, sensitive to dust on the scales predicted by existing single-dish imaging. The primary goal was to determine the size and nature of the emission. Is it diffuse, or is it due to multiple discrete, compact objects whose total flux density can account for the high S850 μm seen by Submillimetre Common User Bolometer Array (SCUBA)?
In the next section we describe an extensive set of observations and the associated analysis. Presentation of the reduced images follows in Section 3, with our interpretation of those data and discussion of their implications in Sections 4 and 5.
2 OBSERVATIONS
2.1 SMA
Data were obtained4 on Mauna Kea, Hawaii, during 2007 March and October using the SMA's ‘compact’ configuration (baselines as long as 113 m during March and 70 m during October – see Fig. 1) and the 345-GHz receivers, with 2 GHz of bandwidth in each of the upper and lower sidebands, as outlined in Table 1. The pointing centre was RA 05:12:54.80, Dec. +60:30:51.7 J2000 and observations of 4C 60.07 were interspersed with ∼5-min scans of the phase calibrator, 4C 50.11, a 2.3-Jy source located 14° from the target. The October data also included observations of 8C 0716+714 (1 Jy, 17°) – to calibrate those data taken when the target was setting – and NVSS J044923+633208 (0.3 Jy, 4°) to check the quality of the phase referencing. The position of NVSS J044923+633208 was found to be accurate to ≲0.1 arcsec.
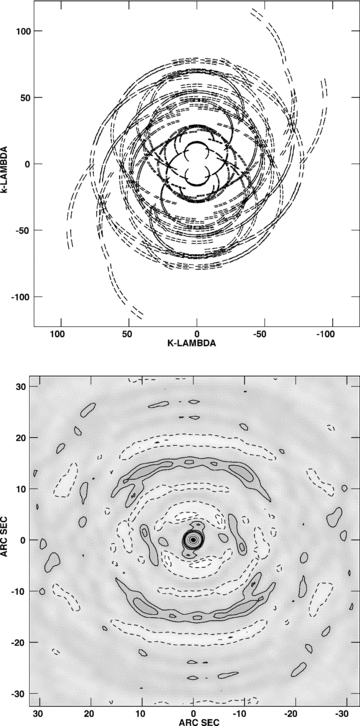
Top: coverage in the uv plane of SMA data acquired on 2007 March 2 and October 23. Bottom: grey-scale representation of the dirty beam, with contours at −10, −5, 5, 10, 15, 20, 40, 60 and 80 per cent of the peak.
Observations of 4C 60.07 with the SMA.
| Date (2007) | Track length (min) | Conditions (τ225 GHz) | Comment |
| February 20 | 216 | 0.167 ± 0.012 | Unsuitable |
| March 2 | 257 | 0.063 ± 0.012 | Adequate |
| March 3 | 268 | 0.108 ± 0.008 | Marginal |
| October 23 | 441 | 0.053 ± 0.004 | Excellent |
| Date (2007) | Track length (min) | Conditions (τ225 GHz) | Comment |
| February 20 | 216 | 0.167 ± 0.012 | Unsuitable |
| March 2 | 257 | 0.063 ± 0.012 | Adequate |
| March 3 | 268 | 0.108 ± 0.008 | Marginal |
| October 23 | 441 | 0.053 ± 0.004 | Excellent |
All calibration was carried out using mir, a set of idl-based routines specifically developed for data from the SMA. The main steps consisted of flagging noisy or corrupted data, converting the data to units of flux density using antenna system temperatures, determining the bandpass (with observations of 3C 454.3 or 3C 279) and, finally, calibrating the antenna complex gains (phase and amplitude) and interpolating the calibrator solutions on to the target. The absolute flux scale is estimated to be accurate to 10 per cent. The data were then read into the Astronomical Image Processing Software (aips) package where they were imaged.
The duration of our October track was 7.35 h, with around 1 mm of precipitable water vapour (pwv). The resulting noise level was 1.4 mJy beam−1, with a [2.4 × 2.2] arcsec2 FWHM synthesized beam for naturally weighted uv data. The SMA Beam Calculator and Sensitivity Estimator5 had predicted a synthesized beam profile of [2.2 × 2.1] arcsec2 FWHM and an rms noise level of 1.41 mJy beam−1, for a 7.5-h track with a 20° minimum elevation and 1 mm of pwv, and so appears to function adequately.
We experimented with several permutations of data. All combinations resulted in images with the same basic characteristics. Although combining all the data yielded the lowest noise, 1.19 mJy beam−1, we opted to use only those data taken in genuine ‘submm weather’(τ225 GHz < 0.1), on October 23 and March 2, since experience suggests only these produce adequate representations of the submm sky. The resulting noise level was 1.38 mJy beam−1, before cleaning, with a synthesized beam measuring [2.25 × 2.07] arcsec2 FWHM with the major axis at position angle (PA) 78°. Employing 100 iterations of the clean algorithm, with a gain of 0.1, in a region of radius 45 arcsec centred on the radio galaxy (nine times the area contained within the SMA's primary beam), resulted in a 20 per cent reduction in the measured noise. The source structure and flux density were unaffected.
2.2 Spitzer
4C 60.07 was observed with Spitzer6 (Werner et al. 2004) in all the broad-band filters available in the Multiband Imaging Photometer for Spitzer (MIPS; Rieke et al. 2004) and Infrared Array Camera (IRAC; Fazio et al. 2004) bands, 3.6–8.0 and 24–160 μm, respectively, in 2004 October, i.e. during the cold portion of the mission (programme identification: 3329; Seymour et al. 2007).
The IRAC data consist of a short sequence of four dithered 30-s frames centred on 4C 60.07 in each of the four bands. We eliminated scattered light, column pull down, residual images and multiplexer bleed from the individual exposures by hand, then mosaiced these cosmetically superior frames using iracproc (Schuster, Marengo & Patten 2006) with 0.86-arcsec pixels (half the area of the native IRAC pixels).
The Infrared Spectrograph (IRS; Houck et al. 2004) also took two 61-s exposures at 16 μm in the 4C 60.07 field, using ‘peak-up imaging’ mode, prior to it being offered to the community. We use the image reduced by Seymour et al. (2007) here.
The reduction of the 24-μm data was based on version S16.1.0 of the MIPS pipeline. We used an object-masked median stack of all the MIPS exposures of 4C 60.07 to compensate for structure arising from residual images. The remaining structure in the backgrounds was eliminated using imsurfit in iraf and the resulting mosaics were created with 1.2-arcsec pixels.
The IRAC, IRS and MIPS data are aligned to less than 0.5 arcsec, conservatively.
For IRAC and MIPS, photometric measurements were made using 4.9- and 7.0-arcsec-diameter circular apertures, respectively, correcting to total flux via the standard aperture correction.7 The flux did not vary significantly for apertures ranging from 6 to 9 arcsec. At all wavelengths, apertures were centred on the 4.5-μm centroid.
2.3 Optical and near-IR observations
An I-band image was obtained during 2000 November 1 using the 4.2-m William Herschel Telescope's (WHT8) Mosaic Camera, which comprises two EEV 4096 × 2048 detectors with 0.236-arcsec pixels (Tulloch 2000). The 3σ limiting magnitude in a 4.9-arcsec-diameter aperture is IVega= 24.8.
We also utilize the K′ imaging of van Breugel et al. (1998), a 1-h exposure taken using Near-Infrared Camera (NIRC; Matthews & Soifer 1994) on the 10-m Keck I telescope during 0.65-arcsec seeing, with a 3σ limiting magnitude in a 4.9-arcsec-diameter aperture of K′Vega= 22.0.
2.4 Radio observations
Pseudo-continuum data were obtained at 1.4 GHz during 2001 January using the National Radio Astronomy Observatory's (NRAO) Very Large Array (VLA) in its A configuration (programmes AD432 and AI84). The raw data were flagged, calibrated and imaged following the technique described by Biggs & Ivison (2006) and the resulting images have a synthesized beam size of [1.4 × 1.1] arcsec2 at a PA of 26°.
We obtained still higher resolution continuum images, with 100-MHz bandwidths centred at 4.7 and 8.2 GHz (programme AC374) and synthesized beam sizes of ∼0.5 and ∼0.3 arcsec FWHM from the NRAO's9 Data Archive System.10
We also reduced the 24-GHz continuum data taken by Greve, Ivison & Papadopoulos (2004) to explore CO J= 1–0 emission from 4C 60.07 for the velocity range of the broad CO(4–3) component found by Papadopoulos et al. (2000): +455 ± 312 km s−1. These were obtained between 2001 October and 2003 March and include five, two and two tracks of data in the D, C and DnC configurations, respectively (programmes AI88, AI93 and AI104). Combining these data with a natural weighting scheme (robust= 5) yielded a [2.6 × 2.4] arcsec2 synthesized beam (FWHM), at PA 102°, and σ= 11.9 μJy beam−1 after 100 iterations of the clean algorithm in aipsimagr with a gain of 0.1 – more than twice as deep as the maps presented by Greve et al. (2004) who used only the highest resolution data.
We used several methods to quantify the CO J= 1–0 emission. First, we aped the approach of Greve et al. (2004): we imaged the two 50-MHz-wide intermediate frequencies (IFs), representing ‘continuum only’ (IF1, σ= 15.7 μJy beam−1) and ‘continuum plus line’ (IF2, σ= 15.9 μJy beam−10, then subtracted IF1 clean components from the uv data base for IF2, after checking the position and integrated flux density of the brightest lobe in IF1 and IF2. The dirty image made using the continuum-subtracted data has σ= 16.0 μJy beam−1. For our second method, we subtracted a dirty image of IF1 from one of IF2, yielding a  noisier map than the first method (σ= 23.5 μJy beam−1). For our third method, we repeated the second method for each of the nine observational epochs, tapering the data to produce a ∼5-arcsec (FWHM) beam. The noise-weighted combination of these nine images yielded σ= 30.0 μJy beam−1. The three methods gave a consistent picture in which the peak flux density due to broad-line CO J= 1–0 emission centred on any of the prominent IR or radio components can be no greater than 0.05 mJy beam−1, and no greater than 0.12 mJy in total (both 3σ).
2.5 Submm observations
Observations using the SCUBA (Holland et al. 1999) on the 15-m James Clerk Maxwell Telescope (JCMT) at a wavelength of 850 μm were described by Stevens et al. (2003). We have returned to those data, and the 450-μm data obtained simultaneously, reducing them afresh with the software described by Ivison (2006), though without the shift-and-add technique since 4C 60.07 was not detected at high signal-to-noise ratio (S/N) in individual scans. The resulting images, smoothed with 7-arcsec Gaussians to yield point spread functions with FWHM of ∼10 and ∼15 arcsec at 450 and 850 μm, are shown in Fig. 2. No positional corrections have been applied. Another faint SMG11 lies to the north, with its reference beams visible, well outside the primary beam of the SMA's 6-m antennas at 345 GHz (30 arcsec FWHM).
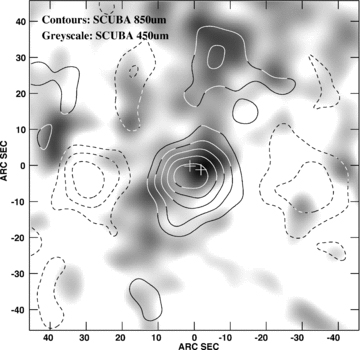
Grey-scale representation of 4C 60.07 observed using SCUBA (Section 2.5) at 450 μm, superimposed with contours of the 850-μm image (shown in its original form by Stevens et al. 2003) plotted at −6, −4, −2, 2, 4, 6, 8, 10 ×σ, where σ is the noise level. The reference beams can be seen, due to the east–west chopping and nodding of the secondary mirror on the JCMT. The positions of the components detected by our SMA imaging, discussed later, are shown as crosses.
3 RESULTS
3.1 Submm morphology and flux density
As stated earlier, 4C 60.07 is extremely bright at submm wavelengths, with S850 μm= 23.8 ± 3.5 mJy, as measured via fully sampled jiggle maps with SCUBA (Fig. 2). Using SCUBA's photometry mode, which was insensitive to emission larger than the telescope beam, the measured flux density was 17.11 ± 1.33 mJy beam−1– the brightest of 47 radio galaxies observed by Archibald et al. (2001) and Reuland et al. (2004).
Our new, high-resolution submm interferometry, shown in Fig. 3, reveals unambiguously that the emission first detected using SCUBA is spread over a region larger than the ≲500 pc (≲0.1 arcsec at z= 3.8) usually encountered in local ULIRGs (Downes & Solomon 1998), or even the ≲4 kpc (≲0.5 arcsec) usually encountered in SMGs (e.g. Younger et al. 2007, 2008a; Biggs & Ivison 2008, cf. SMM J094303+4700 and SMM J123707+6214 in Tacconi et al. 2006, 2008). Two submm components are revealed, hereafter ‘A’ and ‘B’. Component ‘A’ is the easternmost and northernmost (see Table 2), lying 1.2 arcsec south of the flat-spectrum radio core that has hitherto been presumed to host the active galactic nucleus (AGN) driving 4C 60.07's prodigious radio luminosity. ‘A’ and ‘B’ lie 3.3 arcsec apart (24 kpc in the plane of the sky) and have similar integrated flux densities (S890 μm= 8.7 and 7.8 mJy). Hereafter, ‘A’, ‘B’ and the radio core will be the principal components discussed.
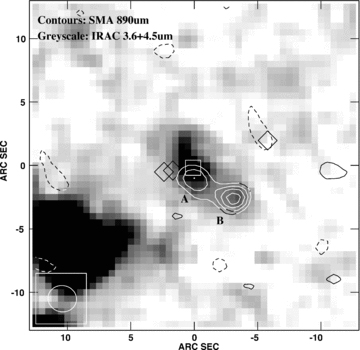
Grey-scale representation of the Spitzer averaged 3.6- and 4.5-μm images of 4C 60.07. Superimposed on the IRAC data is the high-resolution SMA 890-μm image of 4C 60.07, with contours plotted at −2.5, 2.5, 3.5, 4.5, 5.5 and 6.5 × 1.1 mJy beam−1, the rms noise level. The size and shape of the SMA's synthesized beam is shown in the bottom left-hand corner of this plot. The FWHM of the SMA's primary beam extends slightly beyond the extent of the image, to ∼30 arcsec FWHM. The position of the radio core – as seen at 4.7 and 8.2 GHz – is shown by a square; those of the steep-spectrum hotspots are labelled with diamonds; the submm components, ‘A’ and ‘B’, are labelled. The IR, radio and submm images are aligned to better than 0.5 arcsec, conservatively.
Submm and radio positions in the 4C 60.07 system.
| Characteristic | Value | Comment |
| RA (J2000) | 05:12:55.13 ± 0.04 | North-east SMA component ‘A’ |
| Dec. (J2000) | +60:30:49.8 ± 0.3 | |
| PeakaS890 μm | 6.34 ± 1.36 mJy | |
| TotalaS890 μm | 8.72 ± 2.93 mJy | |
| RA (J2000) | 05:12:54.71 ± 0.03 | South-west SMA component ‘B’ |
| Dec. (J2000) | +60:30:48.8 ± 0.2 | |
| PeakaS890 μm | 7.86 ± 1.39 mJy | |
| TotalaS890 μm | 7.83 ± 2.40 mJy | |
| RA (J2000) | 05:12:55.147 ± 0.003 | Radio core, 4.7 GHz |
| Dec. (J2000) | +60:30:51.01 ± 0.02 | |
| RA (J2000) | 05:12:55.154 ± 0.004 | Radio core, 8.2 GHz |
| Dec. (J2000) | +60:30:51.03 ± 0.03 |
a Measured using a twin-Gaussian fit to the dirty image.
Component ‘A’ is marginally resolved by our ∼2-arcsec synthesized beam, with a size reported by jmfit in aips of [2.2 × 0.4] arcsec2 at PA = 78°; its peak S890 μm is lower than that of ‘B’, but its integrated S890 μm is marginally higher. The total S890 μm of these two submm components, 16.6 ± 3.8 mJy, the equivalent of 18.7 ± 4.3 mJy at 850 μm (applying a +13 per cent correction for a 55-K grey body with emissivity index, +1.5). This is consistent with the 23.8 ± 3.5 mJy measured by SCUBA at 850 μm at the ∼1σ level.
The submm morphology appears consistent with that seen at lower S/N using the Plateau de Bure Interferometer (PdBI) of the Institut de Radio Astronomie Millimétrique (IRAM) at 240 GHz (Fig. 4; Papadopoulos et al. 2000) and confirms the extended nature of the dust emission. The measured size, even taking both components together, is significantly smaller than the [11 × 4]-arcsec2 deconvolved size estimated by Stevens et al. (2003), and the single-dish and interferometric flux densities would allow up to 5 mJy of emission distributed on scales larger than those probed by the SMA. Overall, our observations show little compelling evidence for the galaxy-wide starburst reported by Papadopoulos et al. (2000) or Stevens et al. (2003).
![Grey-scale representation of the uniform-weighted, velocity-integrated CO(4–3) emission from 4C 60.07, as detected using IRAM PdBI with a [8.9 × 5.5] arcsec2 synthesized beam by Papadopoulos et al. (2000), superimposed with contours of their 240-GHz (1.25-mm) continuum image, plotted at −2.5, 2.5, 3.5, 4.5, 5.5 and 6.5 × 0.58 mJy beam−1, the rms noise level, with the shape and size of the somewhat elongated 240-GHz synthesized beam shown in the bottom left-hand corner. The image is centred on the position of the radio core – seen at 4.7 and 8.2 GHz – which is labelled with a square; those of the steep-spectrum hotspots are labelled with diamonds; submm components, ‘A’ and ‘B’ (see Fig. 3), are marked with crosses.](https://oup.silverchair-cdn.com/oup/backfile/Content_public/Journal/mnras/390/3/10.1111_j.1365-2966.2008.13811.x/1/m_mnras0390-1117-f4.jpeg?Expires=1750232073&Signature=nInaHR2HfP2eUKWwsrm2Qq2al3xolotwuPruQsoECR~iRoq2NFo7T7SzK5mv6PObiArmB9g5GlfDmRjDbNN6H8EBUFztMCQ5AkAGIqnuldWjonZ92h8o3FRoRBbZhk5CcWjfPikN6LbB4Hc80dPHOjz4oH94T26M2EbTvbMdQKeQouKpqj0eL0u0ZmKBljhu59099OdCcQ2Oh-KAkr3CHcALgPIdcYPlgT84aecC1QJC9~IIK0jmNADXCaUfuxwHJyUUj8kc6YvwRk9juEiNmoJeimrq5O3x0wlU8SJblpmUooEsMx6B~cfwa2jK3MJRc3BF6N79-rgZSJbDp1v5pg__&Key-Pair-Id=APKAIE5G5CRDK6RD3PGA)
Grey-scale representation of the uniform-weighted, velocity-integrated CO(4–3) emission from 4C 60.07, as detected using IRAM PdBI with a [8.9 × 5.5] arcsec2 synthesized beam by Papadopoulos et al. (2000), superimposed with contours of their 240-GHz (1.25-mm) continuum image, plotted at −2.5, 2.5, 3.5, 4.5, 5.5 and 6.5 × 0.58 mJy beam−1, the rms noise level, with the shape and size of the somewhat elongated 240-GHz synthesized beam shown in the bottom left-hand corner. The image is centred on the position of the radio core – seen at 4.7 and 8.2 GHz – which is labelled with a square; those of the steep-spectrum hotspots are labelled with diamonds; submm components, ‘A’ and ‘B’ (see Fig. 3), are marked with crosses.
3.2 CO morphology
Papadopoulos et al. (2000) found the CO J= 4–3 line emission from 4C 60.07 to be bright and broad, even by the standards now known for SMGs (Neri et al. 2003; Greve et al. 2005). They describe two distinct CO(4–3) components in their relatively low spatial resolution PdBI data cube (Fig. 4). Together, these cover ≳1000 km s−1.
One CO(4–3) component is spans only ∼150 km s−1 FWHM. Its position is consistent with that of the putative AGN core – taken to be the flat-spectrum radio source between the steeper-spectrum hotspots seen most clearly at 1.4 GHz – and it is ∼220 km s−1 blueward of the systemic (He ii) velocity of the AGN's host galaxy. Greve et al. (2004) detected gas glowing in CO(1–0), coincident in velocity with the narrow CO(4–3) emission, and consistent spatially. On the basis of dynamical mass limits, Papadopoulos et al. (2000) argued that this narrow component has yet to form the bulk of its eventual stellar mass.
The second CO(4–3) component lies ∼700 km s−1 redward and ∼7 arcsec south-west of the narrow component and spans ≳550 km s−1 FWHM, with emission likely extending to lower frequencies, beyond the observed band (Papadopoulos et al. 2000). Greve et al. (2004) report CO(1–0) in the velocity range of this broad CO(4–3) component, with a peak flux density of 0.27 ± 0.05 mJy, but offset spatially by ∼4 arcsec to the north-east, lying just west of the radio core.
However, our re-analysis of the data used by Greve et al. to explore the broad CO component, together with a much larger set of data taken with shorter baselines, have revealed no CO(1–0) emission above 0.05 mJy beam−1 (Fig. 5). The total CO(1–0) flux, integrated over the velocity range to which these data are sensitive (+455 ± 312 km s−1), is 3σ < 0.07 Jy km s−1. Adopting XCO= 0.8 (K km s−1pc−1)−1M⊙ (Downes & Solomon 1998), this translates into  , less than half of the mass determined on the basis of the CO J= 4– 3 emission by Papadopoulos et al. who assumed a 4–3/1–0 line ratio of r43= 0.45, and less than the mass determined for the narrow CO(1–0) component seen blueward of our passband by Greve et al. (2004). This suggests variations in the bulk gas properties across the 4C 60.07 system.
![Grey-scale representation of the 24-GHz continuum emission from 4C 60.07 superimposed with contours of the CO(1–0) emission in the velocity range of the broad CO(4–3) component detected with IRAM PdBI by Papadopoulos et al. (2000)(+455 ± 312 km s−1) as imaged using the VLA with a [2.6 × 2.4] arcsec2 synthesized beam (shown, bottom left). The CO(1–0) data shown are the average of the first two methods described in Section 2.4. Contours are plotted at −2, 2 and 3 × 18.4 μJy beam−1, the rms noise level. The emission coincident with component ‘B’ has an overall significance, using a Gaussian fit with size fixed to that of the synthesized beam, of ≲2σ. The image is centred on the position of the radio core, which is labelled with a square; those of the steep-spectrum hotspots are labelled with diamonds; submm components, ‘A’ and ‘B’ (see Fig. 3), are marked with crosses.](https://oup.silverchair-cdn.com/oup/backfile/Content_public/Journal/mnras/390/3/10.1111_j.1365-2966.2008.13811.x/1/m_mnras0390-1117-f5.jpeg?Expires=1750232073&Signature=hsW55EmKHn6~5HRg4bhQnm7pAsMWN5FbB8dZRSv4KUm5vGb5m6pvdGXTjZo4jRKsjprPb1BzEnRvZRFRZuW4ll-bJ3~aiiwhZherUAbch-fbCHtq0smXyrpqkn37RmyX41Zswa3XhURlcNGUKalqP5kDJokWc2ddLxlDDXYwppLJhsgSN4efSVvloee0mrWrJcT~-a3Yj-qKYOCw2fk4l6ziQTpN9rkHYH1asZZOF0Av-hQlPx7cnpvoXVkcMpXh97mwGgh8ygargfsQtGTs1-ttMfDlv3hQtr66B9p4ERyuFgQBOxjfVmk4FlIq~VUOuYcspwO6-ORWZDnExbi0dg__&Key-Pair-Id=APKAIE5G5CRDK6RD3PGA)
Grey-scale representation of the 24-GHz continuum emission from 4C 60.07 superimposed with contours of the CO(1–0) emission in the velocity range of the broad CO(4–3) component detected with IRAM PdBI by Papadopoulos et al. (2000)(+455 ± 312 km s−1) as imaged using the VLA with a [2.6 × 2.4] arcsec2 synthesized beam (shown, bottom left). The CO(1–0) data shown are the average of the first two methods described in Section 2.4. Contours are plotted at −2, 2 and 3 × 18.4 μJy beam−1, the rms noise level. The emission coincident with component ‘B’ has an overall significance, using a Gaussian fit with size fixed to that of the synthesized beam, of ≲2σ. The image is centred on the position of the radio core, which is labelled with a square; those of the steep-spectrum hotspots are labelled with diamonds; submm components, ‘A’ and ‘B’ (see Fig. 3), are marked with crosses.
3.3 Comparison of IR, submm and radio positions
We first concern ourselves with the new data from the SMA. The most unexpected aspect of the SMA, Spitzer and VLA imaging (Fig. 3) is the offset between the primary sites of submm emission and that of the radio core's synchrotron.12 The submm components lie 10–30 kpc (on the plane of the sky) from the radio core – a larger distance than can be understood via the positional uncertainties (≪4 kpc; see Table 2 and Section 2). The large offsets often seen between single-dish submm detections and their radio or IR counterparts (Ivison et al. 2007) are not expected here, due to the small SMA synthesized beam and accurate phase-referenced interferometric positions. It is clear, therefore, that the radio galaxy is not associated directly with rest-frame far-IR emission.13
Fig. 6 shows how the morphology of the 4C 60.07 system changes as we move from rest frame 0.2 μm (UV), via rest frame 0.5 μm (∼V), 0.8 μm (∼R), 0.9 μm (∼I), 1.2 μm (∼J), 1.7 μm (∼H) and 3.3 μm (∼L) to rest frame 5.0 μm (∼M), i.e. λobs= 0.9–24 μm. The rest frame UV emission is centred on the radio core. In rest frame V, a red object (‘K’) becomes visible, 2.2 arcsec north-northeast (NNE) of the core; the core emission covers ∼2 arcsec and there is only low-level flux from the submm components. ‘K’ makes contributions in rest frame R and I(λobs= 3.6–4.5 μm) and the emission coincident with submm component ‘B’ strengthens. By the time we reach the rest frame J and H filters at λobs= 5.8–8.0 μm, ‘B’ has become the dominant component, with only very weak emission associated with the radio core and ‘K’. Component ‘A’ appears to be devoid of significant mid-IR emission, with less than 4, 6, 26 and 39 μJy (3σ) at λobs= 3.6, 4.5, 5.8 and 8.0 μm. At λobs= 24 μm we see emission along the orientation of the submm components, ‘A’ and ‘B’, with little room for a significant contribution from the radio core (Fig. 6). (The MIPS 24-μm filter transmits between 4.3 and 5.4 μm – rest frame to half power – and so misses the strongest polycyclic aromatic hydrocarbon (PAH) features; e.g. Desai et al. 2007.)
![Grey-scale representations of WHT I (Section 2.3), Keck K′ (van Breugel et al. 1998) and Spitzer images of 4C 60.07 from 0.9 to 24 μm, using a linear stretch from 0 to 10σ, where σ is the pixel noise (0–20σ at 24 μm, where we have remapped the image into 0.86-arcsec pixels to match the IRAC images, 2.9× smaller linearly than is necessary to fully sample the 24-μm point spread function). The WHT and Keck images have been smoothed with a 0.3-arcsec Gaussian. The Keck image has been rotated slightly to match the US Naval Observatory (USNO)-based astrometry of the WHT I-band image. In each image, two crosses show the positions of the SMA submm peaks and the approximate rest-frame wavelength (in μm) is shown in parentheses. The images are centred on the position of the radio core, labelled with a square, while those of the steep-spectrum hotspots are labelled with diamonds. Each image is [25 × 25] arcsec2.](https://oup.silverchair-cdn.com/oup/backfile/Content_public/Journal/mnras/390/3/10.1111_j.1365-2966.2008.13811.x/1/m_mnras0390-1117-f6.jpeg?Expires=1750232073&Signature=qcIkqdqXpv48V-ozIAiLWTReflef7NStMHj3UDQY8ALPv2oXbfwQHRVCwW1A7UZ42-fBy5xLvDKxbAuaJdO02X1rv84PtDmwcsXyq5IjTKjiftBLcjBDcxy6Yy9zijilHW1coT9oKvu-PYYe45HScoT370ENKNeNslWAtd3bBMCxUUclpfVO2Z86qVSL2D2Imhq3tWAl0ug8Pw5rgYhE9PfGt7z4YlNpY1b9qCJfTbrkHw3M7KPZrJavyRNaxDHTYNIFWC63w8ZMR9pqtIPhsYtAEpKubRQVix0Ss0S-7WGkPhrhhCqFys9KAeG0suY40~Qm2orn4MIPj1baEmuI3Q__&Key-Pair-Id=APKAIE5G5CRDK6RD3PGA)
Grey-scale representations of WHT I (Section 2.3), Keck K′ (van Breugel et al. 1998) and Spitzer images of 4C 60.07 from 0.9 to 24 μm, using a linear stretch from 0 to 10σ, where σ is the pixel noise (0–20σ at 24 μm, where we have remapped the image into 0.86-arcsec pixels to match the IRAC images, 2.9× smaller linearly than is necessary to fully sample the 24-μm point spread function). The WHT and Keck images have been smoothed with a 0.3-arcsec Gaussian. The Keck image has been rotated slightly to match the US Naval Observatory (USNO)-based astrometry of the WHT I-band image. In each image, two crosses show the positions of the SMA submm peaks and the approximate rest-frame wavelength (in μm) is shown in parentheses. The images are centred on the position of the radio core, labelled with a square, while those of the steep-spectrum hotspots are labelled with diamonds. Each image is [25 × 25] arcsec2.
3.4 Clues from SEDs via IR diagnostic plots
We have extracted I and 3.6–8.0 μm flux densities for the two components, the radio core and ‘B’, that dominate the rest-frame optical–IR emission from the 4C 60.07 system, and adopted other measurements from Chambers et al. (1996) and van Breugel et al. (1998). The different noise levels at 3.6–8.0 μm in Fig. 6 make it difficult to judge the spectral energy distribution (SED) shapes, so we plot both of the dominant components in Fig. 7 and list the flux densities in Table 3. The rest-frame UV–V emission from the core is resolved. At rest frame R and I(λobs= 3.6–4.5 μm) we see a blend of emission from the core and ‘K’; since our photometry is appropriate for point sources, the true flux densities are probably ∼20 per cent higher than those shown. Component ‘B’ is barely resolved (3.1 arcsec FWHM), so its photometry ought to be accurate. The 24-μm emission is a blend, with component ‘B’ contributing less than half. The total14 flux density at 24 μm is 0.97 ± 0.05 mJy.
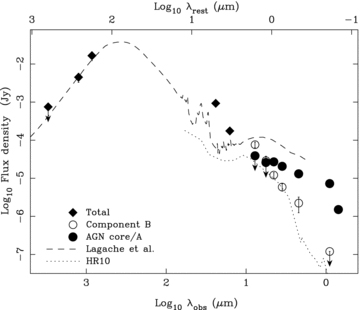
SEDs of the two main components of 4C 60.07 from the optical to the submm, with component ‘B’ represented by open circles and the AGN core by filled circles. Beyond 8 μm we show total flux densities, as diamonds. The dotted line is the SED of the z= 1.44 ERO, HR 10 (Elston, Rieke & Rieke 1988; Stern et al. 2006), normalized in flux with respect to 4C 60.07 at rest frame 185 μm (only the well-sampled optical/IR SED is plotted); the dashed line is the SED of a model 1013-L⊙ starburst (Lagache, Dole & Puget 2003).
Mid-IR flux densities.
| Isophotal wavelength (μm) | Flux density (μJy) | |
| Core/‘A’ | ‘B’ | |
| 3.535 | 20.6 ± 1.4 | 5.9 ± 1.3 |
| 4.502 | 27.0 ± 2.0 | 12.1 ± 2.0 |
| 5.65 | 3σ < 26.0 | 29.0 ± 9.0 |
| 7.74 | 3σ < 39.0 | 76.0 ± 13.0 |
| 16.0 | 175 ± 33 | |
| 24.0 | 930 ± 100 | |
| Isophotal wavelength (μm) | Flux density (μJy) | |
| Core/‘A’ | ‘B’ | |
| 3.535 | 20.6 ± 1.4 | 5.9 ± 1.3 |
| 4.502 | 27.0 ± 2.0 | 12.1 ± 2.0 |
| 5.65 | 3σ < 26.0 | 29.0 ± 9.0 |
| 7.74 | 3σ < 39.0 | 76.0 ± 13.0 |
| 16.0 | 175 ± 33 | |
| 24.0 | 930 ± 100 | |
AGN SEDs rise as a power law between 1 and 10 μm (rest frame), while starbursts have flatter SEDs at rest frame 1–3 μm which rise at longer wavelengths (e.g. Ward et al. 1987; Donley et al. 2007). At z= 3.8, IRAC probes rest frame 0.8–1.7 μm, so S8.0 μm/S4.5 μm is a powerful AGN diagnostic, particularly when plotted against a probe of the >3-μm slope, such as S24 μm/S8 μm (Ivison et al. 2004; Lacy et al. 2004; Magdis et al. 2008).
If the 3.6–5.8 μm emission associated with the radio galaxy core is associated with starlight then we might expect that emission to continue through to λobs= 7.7 μm– near the isophotal wavelength of the IRAC 8.0-μm filter, which corresponds to the 1.6-μm stellar bump at z∼ 3.8. We do not see this, but using the IRAC photometry to constrain rest-frame H-band luminosities and assuming LH/M∼ 2, the stellar mass is poorly constrained: <1012M⊙, cf. (2.8 ± 1.2) × 1011M⊙ in Seymour et al. (2007), who found the H-band light to be 95 per cent stellar. We note that a much larger L/M (and hence lower stellar mass) is plausible, via fine-tuning of age and initial mass function, and there is probably a contribution to the rest-frame near-IR light from the AGN. Our limit is therefore likely to be very conservative, but is consistent with a large mass of ∼0.2–1 Gyr old stars in the radio galaxy host according to a simple Starburst99 model (Vázquez & Leitherer 2005). Already revealed as an AGN by its radio emission, the core does not have the optical–IR continuum characteristics of an AGN.
In contrast, the SED of component ‘B’ climbs steeply to λobs∼ 8.0 μm. It is fit well by a Sν∝ν−3.3 power law: an extremely red galaxy, akin to HR 10 (= ERO J164502+4626.4) at z∼ 1.4 which has excellent coverage of its SED – see Fig. 7 (Dey et al. 1999; Stern et al. 2006). The value of S8.0 μm/S4.5 μm seen for component ‘B’ (6.3 ± 1.5, or [4.5]–[8.0]= 2.0) is unusual: redder than any SMG in the SCUBA Half Degree Extragalactic Survey (SHADES) sample (Ivison et al. 2007), and ranking with the reddest of the 8-μm-selected objects explored by Magdis et al. (2008). These diagnostics are typically used for objects at z∼ 2, however, so we should explore whether the colour remains extreme at z∼ 4. Does it exhibit similar rest-frame optical/near-IR colours to HR 10? For z= 1.4, S3.6 μm/S2.2 μm is close to S8.0 μm/S4.5 μm at z= 3.8. HR 10 has S3.6 μm/S2.2 μm∼ 2.35 ± 0.24, so although HR 10 is redder than component ‘B’ at rest frame ≲1 μm, it is not nearly as red at rest frame 1–10 μm which means that component ‘B’ can be categorized as an obscured AGN with little room for ambiguity.
4 A TOY MODEL OF THE 4C 60.07 SYSTEM
It is tempting to invoke a complex, many-component system and to speculate that this form of interaction may be related to radio loudness and the formation of the most massive galaxies, with implications for the form and role of feedback. However, we must not forget the origins of our target: 4C 60.07 was selected initially as a USS emitter and its radio activity is thus inescapably young, ≤10 Myr (Blundell & Rawlings 1999). We are therefore seeing a system that is probably out of equilibrium.
Can we marry together all the data for the 4C 60.07 system – in particular the radio and submm interferometry, both continuum and spectral line (CO), and the mid-IR imaging? These characteristics are presented schematically in Fig. 8.
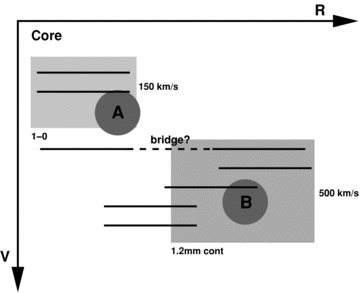
Schematic of 4C 60.07. The horizontal axis is a spatial vector on the sky, starting at the radio core and running through ‘A’ and ‘B’. The vertical axis shows relative velocity, where available. Black lines shown the extent of CO(4–3) channel maps from Papadopoulos et al. (2000)– the dashed line represents the emission that spans both components (note the velocity gap between it and the 150 km s−1 component). Components ‘A’ and ‘B’ are marked by circles at arbitrary velocities. The upper box represents the CO(1–0) map of the narrow component (Greve et al. 2004), while the lower box represents the 1.2-mm continuum, its velocity chosen to match that of the broad component.
In our favoured model, 4C 60.07 comprises a far-IR luminous starburst triggered by a galaxy–galaxy interaction. That more than one component is involved is inescapable, given the morphologies evident in the submm and mid-IR wavebands. Of the myriad components in the system, we identify the radio core as one with significant mass, since it appears to comprise a relatively large BH (capable of driving the radio lobes) and a host galaxy that is visible in rest-frame UV, V, R and I. Since it lacks rest-frame far-IR emission, we suspect the radio galaxy host has exhausted (or driven away) its supply of molecular gas. Certainly, little H2 is evident via its most sensitive available tracers, dust and CO. We identify component ‘B’ as the other high-mass component, as evident from its very broad CO(4–3) line emission – a dusty, gas-rich galaxy, as evident from the submm emission, undergoing a huge burst of star formation. Component ‘B’ is very heavily enshrouded in the dust that betrays its presence in the submm waveband, visible elsewhere in its SED only longward of rest-frame R, probably via a buried AGN with a power-law SED (Section 3.4).
What of component ‘A’? The key piece of evidence is its narrow CO linewidth, seen in both J= 4–3 and 1–0. Papadopoulos et al. (2000) believed this emission was associated with the radio galaxy host but our high-resolution SMA imaging, together with the high-resolution CO(1–0) observations of Greve et al. (2004), betray an association with component ‘A’. We believe that ‘A’ is a bridge of cold material tidally stripped from the massive, gas-rich starburst/AGN (‘B’) towards the host of the radio core – an analogue of the scenario seen in some local ULIRGs, but on a more massive scale. This is in accord with its observed characteristics: the submm component has no counterpart at mid-IR wavelengths, is resolved on a scale of ∼2 arcsec (∼15 kpc) and its gas – consistent spatially for CO(1–0) and CO(4–3) – has a very low velocity dispersion (∼150 km s−1).
5 CONCLUDING REMARKS
New, high-resolution submm imaging of the HzRG, 4C 60.07, at z= 3.8, reveals two clumps of emission separated by 3.3 arcsec (∼25 kpc). Although one clump is resolved by our ∼2-arcsec beam, both are relatively compact (≲15 kpc) and there is little evidence for a galaxy-wide starburst on larger scales from our observations.
Previously thought to comprise two gas-rich starbursts, one centred on the radio galaxy, we discover an extra level of complexity due to the misalignment of the submm emission and the radio core. Given the extreme youth of HzRGs, we interpret the 4C 60.07 system as an early-stage merger, with its radio jets and a nearby gas-rich starburst/AGN both induced by the interaction. We interpret a second clump of dust, resolved by our submm imaging and coincident with very narrow CO emission, as a plume of cold, dusty gas in a tidal stream, seen in a non-equilibrium state. It is separated spatially from the radio galaxy, which may have exhausted its supply of fuel.
Recent work on the z= 4.7 quasar BR 1202−0725 (Klamer et al. 2004) on LH 850.7 (Ivison et al. 2002) and on Minkowski's object (Croft et al. 2006) has suggested that some starbursts are induced by the interaction of a radio galaxy jet with a large gas reservoir. The story we are seeing unfold in the 4C 60.07 system raises the possibility that some of these jets may have been triggered by the interaction that led to the starburst, rather than the starburst being triggered by the jet.
When a BH is spatially offset from the gas and dust of its host system, as seen in 4C 60.07, this has implications for the calculation of its dynamical mass (via the extent of its CO, spatially and in velocity) and related claims about the co-assembly of BHs and host spheroids at high redshift (e.g. Walter et al. 2003, 2004), regardless of whether the system in question is a disc or a merger.
Our observations of 4C 60.07 bring to mind scaled-up versions of the NGC 4038/4039 (‘Antennae’; Wang et al. 2004) and VV 114 (Frayer et al. 1999) systems – early-stage mergers where the bulk of the star formation occurs in an obscured ‘overlap region’ between two gas-rich nuclei. In NGC 4038/4039 this region displays a heavily enhanced star formation rate yet contains little stellar mass (∼10 per cent of the total; Wang et al. 2004). In 4C 60.07, the galaxy nuclei correspond to the radio core and ‘B’, and the overlap region is ‘A’. There are also similarities between 4C 60.07 and HE 0450−2958, one of the objects originally thought to have been caught during its transition from a ULIRG into an optically bright quasar (Hutchings & Neff 1988; Sanders et al. 1988; Canalizo & Stockton 2001) but now believed to be a gas-rich spiral in collision with – and stimulating optical activity in – an unobscured quasar hosted by a gas-poor elliptical (Papadopoulos et al. 2008).
At z≳ 3, where quasars are becoming rarer, a binary quasar with a small separation (<1 arcmin) has yet to be found (at 2 < z < 3, tens are known; Kochanek, Falco & Muñoz 1999; Mortlock, Webster & Francis 1999; Hennawi et al. 2006). The 4C 60.07 system contains two AGN and, although not strictly speaking a ‘binary quasar’, it does support the argument made by Djorgovski (1991) that the high number of binary quasars on small angular separations – orders of magnitude more than that predicted by an extrapolation of the quasar correlation function power law – is due to the triggering of AGN during mergers (see also Alexander et al. 2003; Smail et al. 2003; Iono et al. 2006).
We would not have been aware of the BH that presumably drives the immense radio luminosity of 4C 60.07 were it not for the interaction that triggered both the FR II radio activity and the nearby starburst. Is there an unseen population of BHs at high redshift – invisible unless actively fuelled, yet sufficiently massive to drive a >1027-W radio source? Aside from its rare radio properties, the SED of 4C 60.07's host galaxy is not particularly unusual, and such objects would be impossible to sift from the ∼5 × 10⁸ similarly bright IRAC sources in the sky.
Reuland et al. (2007) claim that HzRGs and SMGs differ only in the activity of their AGNs. Why, then, are complex submm morphologies the exception rather than the rule in typical SMGs? The answer lies in the youth of the 4C 60.07 system, as set by its selection as a USS radio emitter. We see 4C 60.07 in the first throes of a violent interaction, probably within a few Myr of its latest burst of activity commencing, whereas analysis of the rest-frame optical properties of SMGs show that they are typically ≥10× older than HzRGs –∼100 Myr (Smail et al. 2004; Swinbank et al. 2006) – and are therefore more likely to display more relaxed morphologies. This provides a ready explanation for the extended nature of the submm emission seen towards the Stevens et al. (2003) sample of HzRGs, which is at odds with the compact emission seen for most SMGs (Younger et al. 2007, 2008a; Biggs & Ivison 2008). Since these HzRGs will all be youthful, we expect non-equilibrium morphologies to be commonplace, though not necessarily the complex dual-AGN signature seen in 4C 60.07. It is not the activity of their AGNs that mark HzRGs as different from SMGs, it is their youth. The possibility that HzRGs differ from SMGs has many implications. It would be desirable to make similar observations of a larger sample of HzRGs at a resolution similar or better than that employed here.
Recent studies of rest-frame far-IR emission, either directly (Tacconi et al. 2006; Younger et al. 2007, 2008a) or via the far-IR/radio correlation (Chapman et al. 2004; Biggs & Ivison 2008), have highlighted the importance of high spatial resolution. Single-dish observations – with SCUBA2 (Holland et al. 2006), Herschel (Griffin et al. 2007) or SPICA (Swinyard & Nakagawa 2008) – will often provide an ambiguous or misleading picture. Our work re-inforces this view: we have spent a decade assuming that the radio core of 4C 60.07 dominates the rest-frame far-IR emission when the emission is, in fact, associated with a gas-rich companion. We must await sensitive interferometers such as the Atacama Large Millimetre Array (ALMA; Wootten 2003) to probe the interactions that drive many aspects of galaxy evolution, and design future missions, such as the Far-Infrared Interferometer (FIRI; Helmich & Ivison 2008), with the ability to probe a large range of spatial scales.
USS sources, with α < −1 where Sν∝να, were often found to lack identifications on photographic plates (e.g. Tielens, Miley & Willis 1979).
Defined as being centrally located in clusters and very much larger and brighter than other galaxies in the cluster, the c being analogous to the notation for supergiant stars in stellar spectroscopy (Matthews, Morgan & Schmidt 1964).
The SMA is a joint project between the Smithsonian Astrophysical Observatory and the Academia Sinica Institute of Astronomy and Astrophysics and is funded by the Smithsonian Institution and the Academia Sinica.
Additional data were taken in poor weather conditions during 2007 February 20 – see Table 1– but were not used here.
This work is based in part on observations made with the Spitzer Space Telescope, which is operated by the Jet Propulsion Laboratory, California Institute of Technology under a contract with NASA. Support for this work was provided by NASA through an award issued by JPL/Caltech.
IRAC Data Handbook; http://ssc.spitzer.caltech.edu/irac/dh/
Based on observations made with the WHT operated on the island of La Palma by the Isaac Newton Group in the Spanish Observatorio del Roque de los Muchachos of the Instituto de Astrofisica de Canarias.
The NRAO is operated by Associated Universities Inc., under a cooperative agreement with the National Science Foundation.
Labelled ‘1’ in Stevens et al. (2003), which contains spurious coordinates. The object should be referred to as SMM J051254.2+603119. It has no counterpart at 24 μm and may lie at a similarly high redshift to 4C 60.07.
The positional offset is significant at the 4σ level. The uncertainty in the submm position is dominated by the centroiding (see the appendix of Ivison et al. 2007) since systematic uncertainties are limited by the coincidence of the southern submm component with IR emission and by the positional tests described in Section 2.1.
Of the six submm-bright HzRGs with deep Spitzer imaging (Archibald et al. 2001; Reuland et al. 2004; Seymour et al. 2007), all display an accurate alignment of the radio core and the 3.6-μm emission (to a tolerance of ∼1 arcsec) and only 4C 60.07 shows a misalignment at 8 μm (Fig. 6).
Seymour et al. (2007) report different 8- and 24-μm flux densities for 4C 60.07. Their 7-arcsec aperture, centred on the 3.6-μm emission, misses around half the 8-μm flux (which comes mostly from ‘B’). At 24 μm, Seymour et al. (2007) used an aperture 26 arcsec in diameter (not 13 arcsec as stated in the paper; N. Seymour 2008, private communication) and thus include flux from the source to the south-east. Their 16-μm aperture suffers no such problem, although it was 12 arcsec in diameter rather than 6 arcsec, as stated, so we adopt their 16-μm flux here.
REFERENCES
