


Abstract
We have used the Australia Telescope Compact Array (ATCA) and the Swedish–ESO Submillimetre Telescope (SEST) to map the large-scale atomic and molecular gas in the nearby (4 Mpc) Circinus galaxy. The ATCA H i mosaic of Circinus exhibits the warps in position angle and inclination revealed in the single-pointing image of Jones et al., both of which appear to settle beyond the inner 30 kpc which was previously imaged. The molecular gas has been mapped in both the CO J= 1 → 0 and J= 2 → 1 transitions down to a column density of  (3σ), where we derive a total molecular gas mass of
  . Within a radius of 3 kpc, i.e. where CO was clearly detected, the molecular fraction climbs steeply from ≈ 0.7 to unity (where
  , cf. NH i= 1021cm−2) with proximity to the nucleus. Our H i mosaic gives an atomic gas mass of MH i≈ 6 × 10⁹M⊙, which is 70 per cent of the fully mapped single dish value. Combining the atomic and molecular gas masses gives a total gas mass of
  , cf. the total dynamical mass of ≈ 3 × 10¹¹M⊙ within the inner 50 kpc of our mosaiced image. The total neutral gas mass to dynamical mass ratio is therefore 3 per cent, consistent with the SAS3 (Third Small Astronomy Satellite) classification of Circinus. The high (molecular) gas mass fraction of
  per cent found by Curran et al., only occurs close to the central ≈ 0.5 kpc and falls to ≲10 per cent within and outwith this region, allaying previous concerns regarding the validity of applying the Galactic
  conversion ratio to Circinus. The rotation curve, as traced by both the H i and CO, exhibits a steep dip at ≈ 1 kpc, the edge of the atomic/molecular ring, within which the starburst is occurring. We find the atomic and molecular gases to trace different kinematical features and believe that the fastest part (≳130 km s−1) of the subkpc ring consists overwhelmingly of molecular gas. Beyond the inner kpc, the velocity climbs to settle into a solid body rotation of ≈ 150 km s−1 at ≳10 kpc. Most of the starlight emanates from within this radius and so much of the dynamical mass, which remains climbing to the limit of our data (≳50 kpc), must be due to the dark matter halo.
1 INTRODUCTION
Circinus is a nearby, highly inclined spiral galaxy located behind the Galactic plane (at l, b= 311 ), where the high stellar density and dust extinction (AB= 6.3 mag;Schlegel et al. 1998) make it difficult to study its optical properties and environment. At a distance of only 4.2 ± 0.8 Mpc (Freeman et al. 1977), Circinus represents one of the closest examples of a starburst galaxy with a Seyfert 2 nucleus (Moorwood & Oliva 1990; Oliva et al. 1994). Low-resolution H i observations of Circinus with the 64-m Parkes radio telescope revealed a vast galaxy with H i 21-cm emission extending to a half-width of 32 arcmin (Freeman et al. 1977). Its enormous extent has also been noted in both the shallow and deep H i surveys of the Zone of Avoidance (HIZSS, Henning et al. 2000, and HIZOA, Juraszek et al. 2000, respectively) and, most recently, in the H i Parkes All-Sky Survey (HIPASS; Koribalski et al. 2004).
High-resolution, single-pointing Australia Telescope Compact Array (ATCA) H i observations of Circinus (Jones et al. 1999) reveal a complex velocity field and gas distribution out to a diameter of ∼80 arcmin (∼100 kpc), with strong kinematical warping (also evident between the large-scale position angles and inclinations, Table 1). The atomic gas is distributed in a ∼10-kpc radius ring enclosing a bar, in turn terminating in a 1-kpc radius ring (Jones et al. 1999). This inner H i ring may be an outer component of the 600 pc CO ring (Curran et al. 1998), where the star formation is dominant (Marconi et al. 1994). This itself may feed the nucleus via a nuclear bar nestled within the molecular ring (Maiolino et al. 2000), thus providing a means of transporting gas from the outer galaxy to the central engine (e.g. Shlosman, Frank & Begelman 1989).
General properties of the Circinus galaxy.
| Central position | αJ2000 |  (±0°.02) (±0°.02) | 1 |
| δJ2000 |  ) ) | ||
| Type | SAS3 | 2 | |
| Adopted distance | D | 4.2 Mpc | 3 |
| Optical extent* | D24.5 | 11.9 × 4.6 arcmin2 | 3 |
| D26.6 | 17.2 ± 1.7 arcmin2 | 3 | |
| Position angle | PAopt | 220° | 2 |
| PACO | 214°± 4° | 4 | |
| PA H i | 210°± 5° | 3 | |
| Inclination | iopt | 64° | 2 |
| iCO | 78°± 1° (<30 arcsec) | 4 | |
| iH i | 65°± 2° | 3 | |
| Systemic velocity | vH i | 439 ± 2 km s−1 | 3 |
| H i flux density | FH i | 1910 ± 130 Jy km s−1 | 3 |
| H i mass | MH i | 7.9 ± 0.5 × 10⁹M⊙ | 3 |
| Dynamical mass | Mdyn | 1.3 ± 0.2 × 10¹¹M⊙ | 3 |
| B-band luminosity | LB | 7 ± 2 × 10⁹L⊙ | 3 |
| B-band extinction | AB | 6.3 mag | 5 |
| Central position | αJ2000 | (±0°.02) | 1 |
| δJ2000 | ) | ||
| Type | SAS3 | 2 | |
| Adopted distance | D | 4.2 Mpc | 3 |
| Optical extent* | D24.5 | 11.9 × 4.6 arcmin2 | 3 |
| D26.6 | 17.2 ± 1.7 arcmin2 | 3 | |
| Position angle | PAopt | 220° | 2 |
| PACO | 214°± 4° | 4 | |
| PA H i | 210°± 5° | 3 | |
| Inclination | iopt | 64° | 2 |
| iCO | 78°± 1° (<30 arcsec) | 4 | |
| iH i | 65°± 2° | 3 | |
| Systemic velocity | vH i | 439 ± 2 km s−1 | 3 |
| H i flux density | FH i | 1910 ± 130 Jy km s−1 | 3 |
| H i mass | MH i | 7.9 ± 0.5 × 10⁹M⊙ | 3 |
| Dynamical mass | Mdyn | 1.3 ± 0.2 × 10¹¹M⊙ | 3 |
| B-band luminosity | LB | 7 ± 2 × 10⁹L⊙ | 3 |
| B-band extinction | AB | 6.3 mag | 5 |
Notes. Freeman et al. (1977) derived extinction-corrected optical diameters for the Circinus galaxy at the 24.5th blue magnitude, D24.5, and, through extrapolation, the 26.6th blue magnitude, D26.6 (the Holmberg diameter).
References: 1 –Greenhill et al. (2003); 2 –de Vaucouleurs et al. (1991); 3 –Freeman et al. (1977); 4 –Curran et al. (1998); 5 –Schlegel et al. (1998).
General properties of the Circinus galaxy.
| Central position | αJ2000 | (±0°.02) | 1 |
| δJ2000 | ) | ||
| Type | SAS3 | 2 | |
| Adopted distance | D | 4.2 Mpc | 3 |
| Optical extent* | D24.5 | 11.9 × 4.6 arcmin2 | 3 |
| D26.6 | 17.2 ± 1.7 arcmin2 | 3 | |
| Position angle | PAopt | 220° | 2 |
| PACO | 214°± 4° | 4 | |
| PA H i | 210°± 5° | 3 | |
| Inclination | iopt | 64° | 2 |
| iCO | 78°± 1° (<30 arcsec) | 4 | |
| iH i | 65°± 2° | 3 | |
| Systemic velocity | vH i | 439 ± 2 km s−1 | 3 |
| H i flux density | FH i | 1910 ± 130 Jy km s−1 | 3 |
| H i mass | MH i | 7.9 ± 0.5 × 10⁹M⊙ | 3 |
| Dynamical mass | Mdyn | 1.3 ± 0.2 × 10¹¹M⊙ | 3 |
| B-band luminosity | LB | 7 ± 2 × 10⁹L⊙ | 3 |
| B-band extinction | AB | 6.3 mag | 5 |
Notes. Freeman et al. (1977) derived extinction-corrected optical diameters for the Circinus galaxy at the 24.5th blue magnitude, D24.5, and, through extrapolation, the 26.6th blue magnitude, D26.6 (the Holmberg diameter).
References: 1 –Greenhill et al. (2003); 2 –de Vaucouleurs et al. (1991); 3 –Freeman et al. (1977); 4 –Curran et al. (1998); 5 –Schlegel et al. (1998).
The notion of a continuous structure from the kpc to subpc scale is supported by the very long baseline interferometry (VLBI) observations of the H2O maser emission (Greenhill et al. 2003) and Very Large Telescope Interferometer (VLTI) near-infrared observations (Tristram et al. 2007), which both show that the subpc accretion disc/obscuring torus shares a similar close to edge-on orientation to the larger-scale molecular gas (Curran et al. 1998). The inner edge of the warped maser disc shares a similar position angle to the large-scale gas disc (PA = 209°± 3°), although this increases to 236°± 6° at the outer edge (Greenhill et al. 2003). Furthermore, a second population of masers are found to trace a wide-angle outflow which coincides with the >100 pc-scale ionization cone (Marconi et al. 1994; Veilleux & Bland-Hawthorn 1997) and molecular outflow (Curran et al. 1999), as well as sharing the same position angle as the radio lobes (Harnett et al. 1990; Elmouttie et al. 1995). The lobes, cone and outflow are all directed along the minor axis of the galaxy, coincident with the rotation axis of the molecular ring (Curran et al. 1999; Curran 2001).
Previously, Jones et al. (1999) obtained very sensitive, single-pointing H i data of the Circinus galaxy with the ATCA. Since the ATCA primary beam is ∼33 arcmin, these data were not sufficiently sensitive to detect the outer edges of the large gaseous disc of Circinus. Here we present and analyse an H i mosaic of Circinus, obtained with the 375-m configuration of the ATCA, covering the whole galaxy. This is complemented by the most extensive CO 1 → 0 and 2 → 1 maps of the galaxy to date.
2 OBSERVATIONS AND DATA REDUCTION
2.1 H i observations
The H i observations were performed with the ATCA1 in its 375-m configuration, on 1999 June 18–22. In order to avoid solar interference on the short baselines of the array, which are needed to detect the very extended H i emission, we only observed at night. We mosaiced Circinus using a grid of 5 × 3 points along the major axis with pointing centres separated by 16.5 arcmin (i.e. half the primary beamwidth) in order to fully Nyquist sample the field. The band was centred at 1418 MHz with a bandwidth of 8 MHz, divided over 512 channels, giving a channel spacing of 3.3 km s−1, i.e. a velocity resolution of 4 km s−1. We observed for 5 × 12 h in total, achieving an integration time of 44 h on Circinus, i.e. ≈ 3 h per pointing. We used PKS B1934−63 for flux and bandpass calibration and PKS B1329−665 for phase calibration. Data reduction and analysis were performed with the miriad software package.
After identifying the velocity range of H i emission in Circinus and noting the foreground emission from the Galaxy and high velocity clouds, we subtracted an average of the line-free channels from the uv data. The H i data were then Fourier transformed using ‘natural’ weighting. We used 10 baselines between 31 and 459 m, excluding the five longer baselines to the distant antenna six, which do not contribute to the H i emission. The task mossdi was used to clean the mosaiced H i cube which was then restored with a beam size of 124 × 107 arcsec2. The rms noise per each 4 km s−1 channel is ≈ 2 mJy beam−1, close to the theoretical value.
2.2 CO observations
The CO 1 → 0 and 2 → 1 observations of the inner ∼8 × 2 arcmin2 region of the Circinus galaxy were performed with the Swedish–ESO Submillimetre Telescope (SEST)2 at La Silla, Chile. In total, a grid of 7 × 27 points separated by 20 arcsec was observed along the major axis and in 7 × 13 points along the minor axis. The integration time was 15 min per grid point (in 3-min scans), giving a typical rms of T*A≲ 30 mK per 0.7-MHz channel. On 1999 June 7–9, we observed the central three strips, at position offsets of −20, 0 and +20 arcsec along both the major and minor axes, and on 2000 April 22, we observed the remaining positions. The CO 1 → 0 and 2 → 1 transitions were mapped simultaneously with the 115 and 230 GHz (IRAM) receivers, tuned to single-sideband mode. Typical system temperatures, on the T*A-scale, were 300–400 K at 115 GHz and 300 K at 230 GHz. The back-ends were acousto-optical spectrometers with 1440 channels and a channel width of 1.8 km s−1. We used dual-beam switching with a throw of about 12 arcmin in azimuth, and pointing errors, using the SiO maser W Hydra, were typically 3 arcsec rms on each axis. The half power beamwidths (HPBWs) are 45 arcsec for CO 1 → 0 and 22 arcsec for CO 2 → 1. The intensity was calibrated using the chopper-wheel method. For all of the observing runs the weather was excellent, and only the removal of linear baselines, using the xs package, was required.
3 RESULTS
3.1 Gas distributions
3.1.1 The H i maps
Fig. 1 shows the mosaiced, high-resolution H i distribution and mean H i velocity field of the Circinus galaxy as obtained with the ATCA. The equivalent low-resolution H i images obtained from the HIZOA survey are shown for comparison (Fig. 2). Our maps clearly show the enormous extent of Circinus, while exhibiting the asymmetric outer envelope, radial position angle change and the inner ∼30 arcmin of the single-pointing H i image (see Jones et al. 1999). Two Micron All Sky Survey (2MASS) JHK-band images and photometry (Jarrett et al. 2003) show an infrared extent of ≈ 16 arcmin for Circinus, similar to the optical Holmberg radius as extrapolated by Freeman et al. (1977) (see Table 1). The H i diameter is at least a factor of 5 larger than the largest estimated optical and infrared diameters of Circinus.
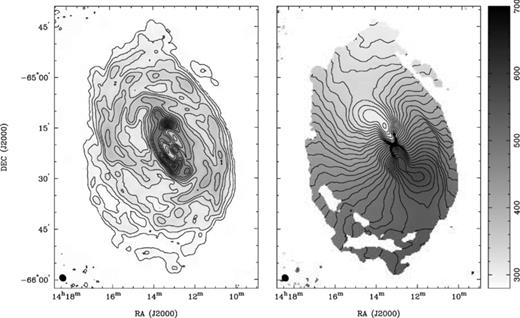
High-resolution H i moment maps of the Circinus galaxy. Left: the H i distribution; the contour levels are 0.4, 1, 2, 3, 4, 6, 8, 10, 12, 18 and 20 Jy km s−1beam−1. Right: the mean H i velocity field; the contour levels range from 300 (NE) to 570 km s−1 (SW) in steps of 10 km s−1. The synthesized beam (124 × 107 arcsec2) is shown in the bottom left-hand corner.
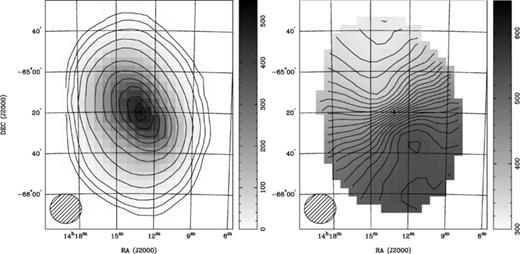
Low-resolution H i moment maps of the Circinus galaxy as obtained from the deep Parkes H i survey of the Zone of Avoidance (Juraszek et al. 2000; Henning et al., in preparation). Left: the H i distribution; the contour levels are (0.5, 1, 2, 5, 10, 20, 30, 40, 50, 60 and 66) × 7 Jy km s−1beam−1, where 7 Jy km s−1beam−1 correspond to an H i column density of 1019cm−2. The contour levels were chosen to match those by Freeman et al. (1977, their fig. 6) above their detection limit of NH i= 5 × 1019cm−2; our detection limit is a factor of ∼10 lower. Right: the mean H i velocity field (masked at NH i= 5 × 1018cm−2); the contour levels range from 324 (NE) to 534 km s−1 (SW) in steps of 10 km s−1. The cross marks the centre of the Circinus galaxy as given in Table 1. The gridded beam of 15.5 arcmin is shown in the bottom left-hand corner.
As noted in previous maps (Freeman et al. 1977; Jones et al. 1999), the ellipticity and position angle changes with radius are indicative of a gentle warp. We also note some asymmetries in the gas distribution and velocity field with the extended H i emission towards the SWW3 being prominent. This pronounced emission in the more tenuous gas is in the same direction as the extension in the CO emission (discussed in Section 3.3.1).
3.1.2 The CO maps
In Figs 3 and 4 we show CO contour maps of the fully mapped region, where we clearly detect CO emission out to +140 arcsec (2.9 kpc) along the north-east (NE; IA= 4.5 ± 1.2 K km s−1) and –160 arcsec (3.3 kpc) along the south-west (SW; IA= 3.8 ± 1.1 K km s−1). Note that, like Elmouttie et al. (1998b), we detect very faint emission further out along the axes, but since these are detected at ≲2σ (e.g. IA= 2.1 ± 1.0 K km s−1 at +180 arcsec along the major axis), they are not considered further.
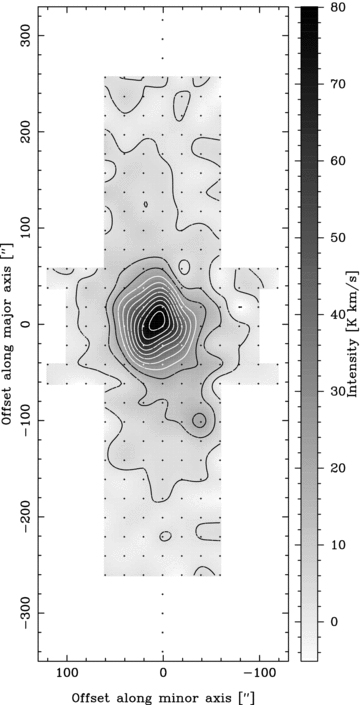
The CO 1 → 0 map of Circinus. The contour levels are up to 80 K km s−1 in 10 per cent steps. The SEST antenna gain is 27 Jy K−1 at 115 GHz. In this and in Fig. 4 the position angle is 214°, and the dots mark the observed positions.
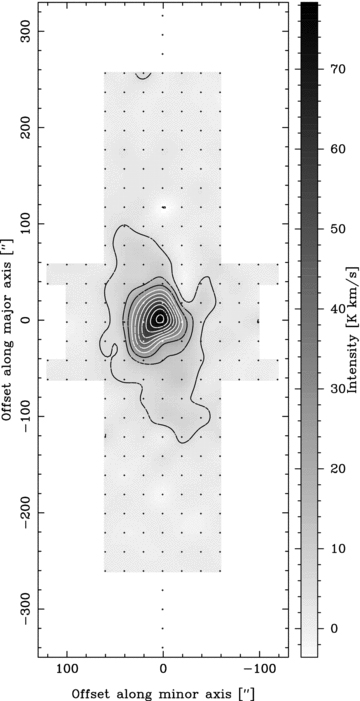
The CO 2 → 1 map of Circinus. The contour levels are up to 78 K km s−1 in 10 per cent steps. The SEST antenna gain is 40 Jy K−1 at 230 GHz.
Along the minor axis, CO is clearly detected to 80 arcsec along both the NW and SE (IA= 4.8 ± 1.3 and 4.2 ± 1.2 K km s−1, respectively). This deprojects to values of 3.3–6.7 kpc for i= 65° to 78° (Table 1). The lower end of this range agrees well with the value obtained from the major axis giving i= 60°± 6°. Note, however, that within the central 5 kpc, the H i velocity field displays an elongated structure and non-circular motions (Jones et al. 1999). This would have the effect of lowering our estimates of the inclination of the ‘disc’, although the molecular ring+outflow model supports the high inclinations within the central kpc, with the velocity field within this region not exhibiting the same strong twists as on the larger scale.4
CO 2 → 1 is detected at similar main-beam temperatures as the 1 → 0 transition at ≈ 3.2 and ≈ 1.1 kpc along the major and minor axis, respectively, giving i= 65°± 8°. These values suggest that the large-scale CO shares a similar inclination to the H i and optical disc (Table 1), and considering the value of i= 78° found by Curran et al. (1999), indicates that the CO distribution, like the H i (Jones et al. 1999), is warped.
3.2 Gas masses
3.2.1 Atomic gas mass
In Fig. 5 we show the global integrated H i spectrum of Circinus obtained from our mosaic. The integrated H i flux density of FH i≈ 1300 Jy compares with 1000 Jy km s−1 from the primary beam limited image (Jones et al. 1999) and FH i= 1870 and 1960 Jy km s−1 from the single dish HIZSS and HIZOA maps (Henning et al. 2000; Juraszek et al. 2000), respectively. Our value gives a mass of MH i= 5.5 ± 0.2 × 10⁹M⊙, using MH i= 2.36 × 10⁵D2FH i M⊙ (Wild 1952; Roberts 1962) and D= 4.2 Mpc.
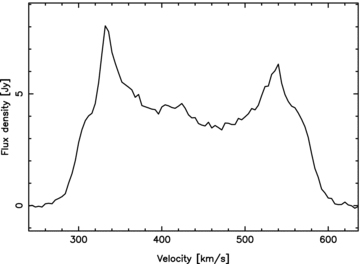
Integrated H i spectrum of the Circinus galaxy. The velocity resolution is 4 km s−1 and the integrated flux density is FH i= 1330 ± 50 Jy km s−1. All velocities quoted throughout this paper are heliocentric.
Like the previous results, the spectrum shows a prominent double-horn shape, with more emission from the fast moving (at v≈ 330 km s−1 in Fig. 5) gas in the approaching (NE) segment. The emission peaks occur at 332 and 540 km s−1, giving ±104 km s−1 about a centroid of 436 ± 4 km s−1. This agrees well with the systemic velocity of 439 ± 2 km s−1 derived by Freeman et al. (1977) (see also Section 3.3.3) and indicates that the asymmetry in the profile does not dominate the rotational dynamics of the gas.
3.2.2 Molecular gas mass
Fig. 6 shows the integrated CO 1 → 0 and 2 → 1 spectra summed over the full map. For both transitions we see the excess of low-velocity gas in the receding peak, as was evident in the molecular ring model of Curran et al. (1998). This contravenes the H i spectrum (Fig. 5), indicating a significantly larger molecular fraction in the SW portion of the ring. For CO 1 → 0 the average velocity integrated line intensity is IA= 6.28 ± 0.07 K km s−1. Converting this to main beam intensity, via ηmb= 0.7 ± 10 per cent at 115 GHz, gives an average of Imb= 9 ± 1 K km s−1 over the whole map (Fig. 3) resulting in a CO 1 → 0 luminosity of LCO1→ 0= 400 ± 40 K km s−1kpc2, where we have added an additional half beamwidth (Θmb) to each axis to ensure we account for all of the mapped region.5
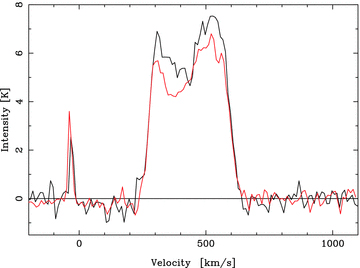
Integrated CO 1 → 0 (black) and 2 → 1 (coloured) spectra of Circinus. The velocity resolution is 10 km s−1 and the antenna temperatures have been corrected by main beam efficiencies of ηmb= 0.7 and 0.5, respectively. The Galactic line close to 0 km s−1 occurs in the western part of the map close to known Galactic emission (Dame et al. 1987), as previously noted by Elmouttie et al. (1998b).
Applying the Galactic  conversion ratio of 2.3 ± 0.3 × 1020cm−2/(K km s−1) (Strong et al. 1988) and a 36 per cent mass correction for helium (so that 1 M⊙= 4.38 × 1056 H 2 molecules), gives a total molecular mass of
  . This is the same as the value found by Elmouttie et al. (1998b),6 and similar to that obtained by Curran et al. (1998) over the central region only. This therefore suggests that the previous ±60 ×± 60 arcsec2 maps contained most of the CO emission.
Since this mass is comparable with the dynamical mass, Mdyn= 3.3 ± 0.3 × 10⁹M⊙ within 560 pc, Curran et al. (1998) raised the possibility that the Galactic conversion ratio was inapplicable in this case, as had been previously noted for other galaxies (e.g. Maloney & Black 1988; Maloney 1990; Shier, Rieke & Rieke 1994; Dahmen 1995; Genzel et al. 1995). In order to check that this apparently high molecular mass was not the result of integrating the luminosity over r > 560 pc, we averaged the intensities over the central 25 positions of Fig. 3, i.e. to ±40 ×± 40 arcsec2, which gave Imb= 48 ± 5 K km s−1. Deconvolving Θmb from this ±40 arcsec gives a radius of 680 pc in which a molecular mass of  is found, thus either suggesting a gas mass fraction of ≈ 30 per cent, within this radius, or a conversion ratio of
  /(K km s−1).
Note that Elmouttie et al. (1998b) previously obtained a much lower molecular gas mass fraction from the central CO 1 → 0 spectrum.7 Estimating the dynamical mass over the central beam in a similar fashion for our data, i.e. assuming that the maximum rotational velocity occurs at the edge of the beam,8 gives Mdyn≈ 3.1 × 10⁹M⊙ within the central ≲440 pc, compared to the ≈ 3.9 × 10⁹M⊙ found by Elmouttie et al. (1998b). The molecular mass over the same region is  , giving, like Elmouttie et al. (1998b),
  . The large increase in the gas mass beyond this radius (previous paragraph), increases the gas mass fraction by a factor of 3 (to
  ) within 680 pc, thus being consistent with the presence of a molecular ring in the central regions of Circinus. Note, however, that an overestimate in the dynamical mass is possible when there are non-circular motions present, due to the presence of non-axisymmetric potential (e.g. a bar), particularly in the central regions (Koda & Wada 2002). Therefore, the ring interpretation should only be considered as one possibility. Finally, we see that none of the central 1 → 0, 2 → 1 or 3 → 2 spectra (Curran et al. 1998,2001) exhibits the horns apparent in the global spectra. This difference is also seen in our data, where in Fig 7 we overlay the global CO 1 → 0 spectrum upon those of the centre position (within the central 45-arcsec beam) and the molecular ring region (within the central ≈±40 × 40 arcsec2 mapped positions). This shows that our large-scale CO maps detect the more extended (≳1 kpc) gas, which rotates at ≈±130 km s−1 (see Sections 3.3.3 and 4.1).
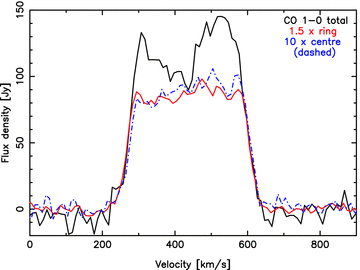
Overlay of the global (black), ring region (red) and central (dashed blue) CO 1 → 0 spectra. All have been corrected by 27 Jy K−1 and the ring region and central spectra scaled up by factors of 1.5 and 10, respectively.
Converting the average CO 2 → 1 velocity integrated line intensity of IA= 3.82 ± 0.04 K km s−1, via ηmb= 0.5 ± 20 per cent at 230 GHz, gives Imb= 7.7 ± 1.5 K km s−1 resulting in a CO 2 → 1 luminosity of LCO 2→ 1= 350 ± 70 K km s−1kpc2. From previous observations of the central position (Johansson et al. 1991; Curran et al. 2001), CO 2 → 1/CO 1 → 0 intensity ratios of close to unity were noted and Figs 6 and 7 indicate that this ratio drops slightly in the horns of the CO profile, which traces the extended gas beyond the ring.
The H2 (derived from CO 1 → 0 and 2 → 1) and H i column densities along the major axis are shown in Fig. 8. Since the former is derived from both the CO 1 → 0 and 2 → 1 transitions using the same  conversion ratio, it represents a profile of the CO 2 → 1/CO 1 → 0 intensity ratio along the major axis. Over the range where we have clear detections (for H2 column densities of
  ), we see that the high CO 2 → 1/CO 1 → 0 ratio holds. This may suggest that the conditions (Tkin∼ 50– 150 K, NCO∼ 0.2– 20 × 1018 and
  ) found over the central beam (Curran et al. 1998,2001; Hitschfeld et al. 2008) could hold over the bulk of the molecular gas, although these are high temperatures to maintain over a 3-kpc radius. Within this region we see very high molecular fractions of
  , the value of which drops to f≲ 0.7 beyond the limit of the clear CO detection range (≳3 kpc). That is, in the case of Circinus we witness the limiting atomic gas column density of NH i≲ 1021cm−2, which is typical for disc galaxies (e.g. Cayatte et al. 1994; Rhee & van Albada 1996), with gas above these column densities being converted into the molecular state under the favourable conditions close to the nucleus (Young & Scoville 1991; Schaye 2001).
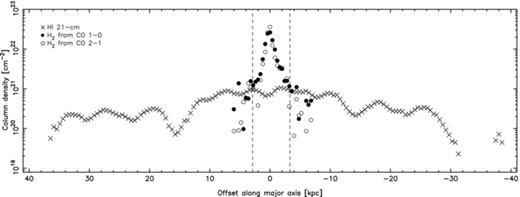
H i (crosses) and H2 (circles) column densities as a function of galactocentric radius (NE to SW along the major axis). The H i column densities are calculated in the optically thin regime from a brightness temperature of 45.93 K Jy−1 per the main-beam solid angle of 3.52 × 10⁻⁷sr. The H2 column densities have been calculated using  /(K km s−1) (Strong et al. 1988): for CO 2 → 1 (unfilled circles), we use a main-beam efficiency of ηmb= 0.5 and for CO 1 → 0 (filled circles), ηmb= 0.7. The dashed lines represent the offsets of the last clear (>3σ) CO detections.
3.3 Gas dynamics
3.3.1 Position angle variations
Previously, Jones et al. (1999) noted two large spiral arms originating at the end of the atomic gas bar at a radius of ∼5 kpc and, as seen in the H i distribution (Jones et al. 1999 and Fig. 1), the bar itself is enclosed by a large ring of atomic gas. Referring to the CO emission (Figs 3 and 4), being limited to ≲±3 arcmin the molecular gas extends to only the very central regions of the H i (Fig. 1, left). However, similar to the H i (Section 3.1.1), there appears to be an extension in the more tenuous emission towards the SWW. Elmouttie et al. (1998b) also noted this ‘disturbance’ in the kpc-scale CO emission, but since this was due to a single position spectrum, they deemed it doubtful. We find, however, that feature is visible over several spectra and at the peak has an integrated intensity of IA= 20.3 ± 1.3 K km s−1. This occurs at a distance of 1.8 kpc from the centre position with a position angle of PA ≈ 236°, thus exhibiting a ‘warp’ from the ≈ 214° position angle of the molecular ring (Fig. 9). Such a change in position angle is also seen in the atomic gas (see also Jones et al. 1999 and Section 3.3.3) on the 10-kpc scale and Fig. 9 illustrates that similar changes also occur at the inner edge of the accretion disc. Although contained within the central 0.1 pc, the accretion disc shares a similar position angle (209 ± 3°) to the molecular and atomic rings, while the disc at 0.4 pc (236 ± 6°) has the same position angle as the extended molecular (≳1 kpc) and atomic gases (≳10 kpc).
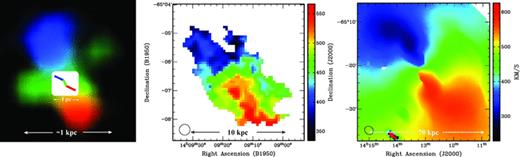
The ‘zigzagging’ of the position angle on various scales in Circinus. Left: the molecular gas – the inset shows the H2O maser emission from the warped accretion disc in the inner parsec (Greenhill et al. 2003), which is superimposed upon the deconvolved (to a resolution of 10 arcsec using the method of Rydbeck 2008) map of the inner CO 2 → 1 emission (Curran 1998). This resolves the ring in the NE–SW diagonal, as well as the perpendicular outflow (Curran et al. 1998,1999). Middle: the CO 2 → 1 first-order moment map (due to binning of the data, the weaker extreme velocity channels are lost, see Section 3.3.3). Right: the central H i first-order moment map. In the latter two maps we show the beam in the bottom left-hand corner, 22 arcsec and 124 × 107 arcsec2, respectively. In the colour version of the figure, blue is approaching, red is receding and green is systemic gas.
These abrupt changes in position angle could be due to large non-circular motions, perhaps caused by bar potentials in the inner parts of the galaxy where the CO resides, as has been found for many other spirals (Scoville et al. 1993; Regan, Sheth & Vogel 1999; Sakamoto et al. 1999), including the Milky Way (Fux 1999; Dame, Hartmann & Thaddeus 2001). In these cases, the molecular gas is found to abruptly change direction when transversing the dust lanes on the way to the nuclear ring (Regan et al. 1999; Dame et al. 2001), and in the case of Circinus, a dusty nuclear bar (Marconi et al. 1994) nestling within the molecular ring (see fig. 1.7 of Curran 2000)9 has been found. For Circinus it is apparent that a ring forms at the ends of each bar and a tendency for strong bars to terminate in rings has been noted in the dust structure of 75 galaxies by Peeples & Martini (2006). Furthermore, as is seen for other galaxies (e.g. Sakamoto et al. 1999) and from numerical simulations of barred potentials (Wada 1994; Athanassoula & Bureau 1999; Bureau & Athanassoula 1999; Koda & Sofue 2006), the nuclear bar may provide a means for transporting the gas to the nucleus of Circinus. Further support is lent by the gas mass fraction of  within ≈ 400 pc, derived above, which is consistent with the bar-driven transport of molecular gas to the nucleus (Sakamoto et al. 1999). For Circinus, we therefore suggest, that upon each collision with a bar or ring, the gas undergo a jolt which shifts the position angle by ≈ 20°. As illustrated in Fig. 9, these same twists and turns in position angle occur on wildly different scales and this may be the first case that the orientations and kinks are seen to be repeated all of the way down to the subpc accretion disc.
3.3.2 Position–velocity diagrams
In Fig. 10 we show the H i and CO 1 → 0 position–velocity (p–v) diagrams of Circinus along its major axis.10 As expected, the H i distribution is similar to that of Jones et al. (1999), with a rising component extending to a radius of ≈400 arcsec (≈8 kpc), being followed by a flatter component. We also see, like Jones et al. (1999), that along the major axis the gas is more extended in the NE than the SW (also visible in Fig. 8), being clearly visible to 2000 arcsec (≈40 kpc) and 1600 arcsec (≈30 kpc), respectively.
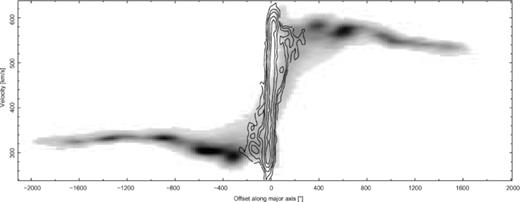
H i (grey-scale) and CO 1 → 0 (contours) position–velocity diagrams of the Circinus galaxy along the major axis (PA = 210°). The plot ranges from the NE to the SW.
From the CO distribution it is apparent that the molecular gas traces a different kinematical feature to the bulk of the atomic gas, in which there is a significantly higher velocity gradient and a larger velocity range, giving the difference in the global H i and CO profile widths (Fig. 11). High velocity wings in the CO distribution of other galaxies have previously been attributed to high dispersion or rapid rotation of the molecular gas in the inner disc (Sofue 1992; Tutui & Sofue 1999). Zooming in on the H i emission profile over the CO emission region (Fig. 11), we see that this accounts for the weak large velocity wings of the global H i emission with a width close to that of the CO profiles. We therefore interpret this emission and the wings of the CO profiles to the fastest part of the ring (≳130 km s−1), within the inner 600 pc (Curran et al. 1998).
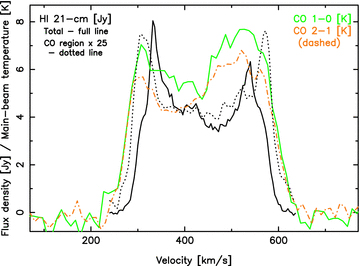
Overlay of the global H i (solid black), the H i over the CO emission region (dotted black) and the CO (1 → 0 – solid green; 2 → 1 – dashed orange) emission profiles. The spectrum of the H i over the CO emission region has been scaled up by a factor of 25.
The CO p–v distribution is very similar to that of Elmouttie et al. (1998b): along the major axis we also observe ‘rigid’ rotation within the central ±60 arcsec, as well as the flat rotation at distances beyond this. The rigid rotation is consistent with the model of the subkpc molecular ring, where the velocity increases to a deprojected maximum of 180 km s−1 at 400 pc (Curran et al. 1998). When convolved with the 44-arcsec beam, this transforms to an observed offset of ≈ 50 arcsec, thus suggesting that the rigidly rotating inner ±60 arcsec corresponds to the molecular ring. Finally, the locations of the peak emission at velocities of 294 ± 2 and 575 ± 5 km s−1, give symmetrical rotation about 435 ± 5 km s−1, in excellent agreement with the systemic velocity derived from the H i (Sections 3.2.1 and 3.3.3).
Beyond the inner ±60 arcsec, the flat rotation along the major axis is seen to occur at ≈ 300 (NE) and ≈ 560 km s−1 (SW). Comparing these to the systemic velocity, gives a projected velocity of about ±130 km s−1, a value similar to that found by Elmouttie et al. (1998b). This corresponds to a deprojected velocity of ≈ 130 to 150 km s−1 (for i= 78° to 60°, Section 3.1.2), over a deconvolved distance of ≈ 800 pc to 4 kpc. The inner edge of this large-scale solid body molecular disc matches well with the inner rigidly rotating ring which has velocities of ≲150 km s−1 at ≳600 pc (Curran et al. 1998).
3.3.3 Tilted ring model
In order to model the velocity field in Circinus a tilted ring model was fitted to the first-order moment maps. This was performed as per the modelling of Rogstad, Lockart & Wright (1974), Begeman (1989) and Thean et al. (1997), using with the aips task gal, where by assuming that the velocity field was constant over each 120-arcsec annulus (≈ 1× the beam-size), we fitted concentric annuli. In the first iteration, all six of the fitting parameters were allowed to vary: the central position coordinates, the position angle of the receding major axis, the inclination of the orbital plane, the systemic velocity and the maximum rotation velocity. The fits to the inner four annuli, from 120 to 600 arcsec, where the velocity field is most symmetric, each gave the same central position and systemic velocity of  and vH i= 440 km s−1, respectively. That is, within 30 arcsec (a quarter of the HPBW) and 1.5 km s−1 (half a channel) of the values obtained by Jones et al. (1999). Adopting the Jones et al. values to drive the tilted ring model, we then ran another iteration of gal, keeping these values fixed and looping round the annuli in order to fit the full velocity field. This was done out to 2460 arcsec, as beyond this the data proved too poor to fit a model.11 This gave a three-parameter fit very similar to that of the initial model for the whole H i velocity field, as well as separate fits for the approaching and receding sides. The results are shown in Fig. 12.12
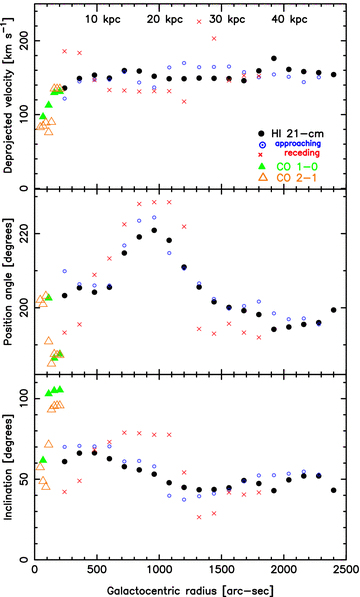
The three-parameter fit to the H i (filled circles) and CO (triangles) velocity fields. The small circles show the model fit to the approaching side of the H i, the crosses the receding side, the filled triangles the CO 1 → 0 fit and the unfilled triangles the CO 2 → 1 fit.
To model the molecular gas, data cubes of the CO 1 → 0 and 2 → 1 were constructed in class, in first-order moment maps with five-point Hanning along the spectral axis. These were smoothed in order to improve signal-to-noise ratio to a point where the data were useful. We then performed the modelling as for the H i, fitting a rotation curve with the constant velocity model and using the centre position and systemic velocity derived from the H i data. Again, we used annuli of 1 × HPBW width (45 arcsec for CO 1 → 0 and 22 arcsec for 2 → 1), out to 200 and 170 arcsec, respectively, where the data appeared reasonable, although none of the CO first moment maps where of nearly as high a quality as for the H i.
This is the first time that a tilted ring model has been applied to the molecular gas in this galaxy and we see that for the inner rotation curve (Fig. 12, top), the fit is consistent with the H i data, with the outer values of ≈ 130 km s−1 agreeing well with the those derived by assuming circular orbits inclined at ≳70° (Section 3.3.2). Being restricted to radii of ≳900 pc, however, the model cannot trace the high velocities of the inner molecular ring discussed above.
The CO model fits to the position angle are more awry, although still within ≲20° of the H i model (Fig. 12, middle), but larger than the changes in position angle discussed in Section 3.3.1. For the inclination (Fig. 12, bottom), some CO fits are reasonably consistent with the H i model within the inner 160 arcsec, but jump up to ≈100° beyond this, at radii where the drop in position angle is seen. We therefore attribute this to the poorer first moment maps of the CO emission, which were more difficult than the H i to model, although, again, we do expect the inclination to rise within the inner kpc (Table 2).
Inclination angles, i, at various radii in Circinus.
| Species | Radius | i | Reference |
| H2O | 0.1–0.4 pc | Edge-on | Greenhill et al. (2003) |
| CO | 0.1–0.6 kpc | 78°± 1° | Curran et al. (1998) |
| 3 kpc | ≳63°± 5° | Elmouttie et al. (1998b)a | |
| 3 kpc | 60°± 6° | This paperb | |
| Hα | 4 kpc | 40°± 10° | Elmouttie et al. (1998a) |
| H i | 8 kpc | ≈ 70° | Jones et al. (1999) |
| 26 kpc | ≈ 40° | Jones et al. (1999) | |
| 39 kpc | ≈ 60° | Jones et al. (1999) | |
| 39 kpc | 65°± 2° | Freeman et al. (1977) | |
| 47 kpc | ≈ 50° | This paper |
aElmouttie et al. (1998b) actually quote an inclination angle of at least 73°, however, we obtain 63° based on the CO extent along the major and minor axes quoted.
b By comparing the scale sizes of the minor and major axes emission and applying, like Elmouttie et al. (1998b), an uncertainty of one mapped position per each full axis (see Section 3.1.2).
Comparing the H i model with that of Jones et al. (1999), we see that out to a radius of 1700 arcsec, where their model was deemed reliable, there is excellent agreement in all three parameters, with the rotation curve, as well as all of the peaks and troughs in the position and inclination angles, being reproduced. Interestingly, the offsets of the receding model fit from those of the approaching half and the whole H i velocity field are also reproduced over ≈ 1100– 1800 arcsec, confirming the asymmetry of the outer Circinus disc as found by Jones et al. (1999). Beyond the inner 1700 arcsec (which is discussed in detail by Jones et al. 1999), both the position and inclination angles settle close to the outer values previously found. With regards to the rotation curve, after one more small climb, this remains fairly flat, indicating that the fastest rotating atomic gas is associated with the large-scale diffuse emission and not within the subkpc ring (Section 3.3.2).
4 MASSES IN CIRCINUS
4.1 Dynamical masses
In Fig. 13 we combine the rotation curves from the tilted ring models with those from the literature to show the dynamics over the whole galaxy. The overall profile is fairly typical for spirals (type Sa–Sc) with a steep initial rise within the inner few kpc, beyond which the velocity plateaus (Rubin, Thonnard & Ford 1980; Bosma 1981a,b; Rubin et al. 1982,1985).
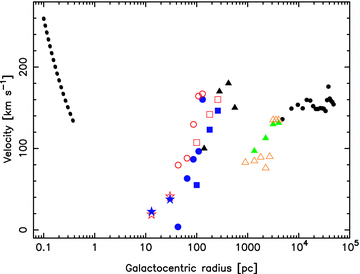
The rotation curve over the major axis of the Circinus galaxy. The dotted curve shows the Keplerian fit to the H2O masers (Greenhill et al. 2003), the stars and squares show the stars and N ii emission-line data (Maiolino et al. 1998; Oliva et al. 1994), respectively, and the circles show the H2 data of Davies et al. (1998). The filled blue symbols represent the NE (approaching) data and the unfilled red symbols the SW (receding) data over these regions. Farther out, the symbols are as per Fig. 12; the black triangles represent the CO ring model (Curran et al. 1998), the coloured triangles the larger scale CO (1 → 0 – filled green; 2 → 1 – unfilled orange) and the small circles the H i.
Specifically, in the inner 0.4 pc we see Keplerian rotation indicative of dynamics which are dominated by a compact massive object (see Greenhill et al. 2003). Beyond this, from ≈10 pc to ≈400 kpc the velocity scales directly with distance,13 despite both the H2 and CO intensity dropping significantly over the inner few hundred pc (Davies et al. 1998 and Curran et al. 1998, respectively), probably due to consumption by the starburst activity within the central kpc (Marconi et al. 1994; Elmouttie et al. 1998a).
The outer edge of the starburst/molecular ring is marked by a sharp drop in the rotational speeds, although probably not to the extent as indicated by the CO 2 → 1 tilted ring model,14 which is confirmed by the dynamical mass distribution (Fig. 14). Beyond the molecular ring, velocities settle at ≈ 150 km s−1, where the gas follows the general, large-scale solid body rotation typical of disc galaxies, although Fig. 14 may suggests that there is not much additional (gravitating) matter between the ring and the large-scale atomic gas. Beyond this plateau, the mass of the galaxy clearly keeps climbing beyond the outer edge of the disc, although with less of a gradient than the inner kpc, confirming the differences in the p–v distributions between the atomic and molecular gases (Fig. 10). Visually, there is a drop of 3 mag within the central 1 kpc and with a Holmberg radius of 10 kpc (Freeman et al. 1977) (see also Section 3.1.1), it is clear that the halo must be dominating the outer dynamics of Circinus.
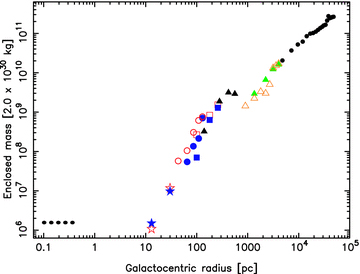
The dynamical mass distribution of the Circinus galaxy. The symbols are as per Fig. 13. This confirms the underestimate in the velocities from the CO 2 → 1 tilted ring model, although the outer three 1 → 0 estimates appear quite reasonable.
4.2 Gas mass fractions
In Table 3 we summarize the various gas and dynamical masses found for the Circinus galaxy. Curran et al. (1998) reported a gas mass fraction of  within the central 560 pc, which called into question the Galactic
  conversion ratio of ≈2.3 × 1020cm−2/(K km s−1) (Strong et al. 1988). We see, however, that this does not apply over the whole of the galactic disc, falling to the nominal ≲0.1 (Mihalas & Binney 1981) beyond the molecular ring, and upon reaching the Holmberg radius, the gas mass fraction falls to ≈ 0.03. Combining the atomic gas mass (Juraszek et al. 2000) with the molecular gas mass gives
  , and so Mgas/Mdyn≈ 0.03 holds over the inner ≈ 50 kpc of the galaxy (Table 3). This is significantly smaller than the value obtained by Elmouttie et al. (1998b)(Mgas/Mdyn≈ 0.6), and is consistent with the SAS3 (Third Small Astronomy Satellite; Hubble type Sb, where Mgas/Mdyn∼ 0.08; Young & Scoville 1991) classification of Circinus (de Vaucouleurs et al. 1991).
Gas and dynamical masses at various radii in Circinus.
| Mass (M⊙) | Radius | Type | Reference |
| ≈ 4 × 10⁸ | <440 pc | H2a | Elmouttie et al. (1998b) |
| ≲4.7 × 10⁹ | <440 pc | Totalb | Elmouttie et al. (1998b) |
| 1.0 ± 0.2 × 10⁹ | <680 pc | H2a | This paper |
| 3.3 ± 0.3 × 10⁹ | <560 pc | Total | Curran et al. (1998) |
| 2.0 ± 0.5 × 10⁹ | ≲5 kpc | H2a | This paper |
| ≈ 2.1 × 10¹⁰ | ≲5 kpc | Total | This paper |
| 1.9 ± 0.1 × 10⁹ | <10 kpc | H i | This paper |
| ≈ 6.2 × 10¹⁰ | <12 kpc | Total | This paper |
| ≥3.8 × 10⁹ | <35 kpc | H i | Jones et al. (1999) |
| 1.9 ± 0.3 × 10¹¹ | <35 kpc | Total | Jones et al. (1999) |
| 7.2 ± 0.5 × 10⁹ | <40 kpc | H i | Freeman et al. (1977) |
| 1.3 ± 0.2 × 10¹¹ | <40 kpc | Total | Freeman et al. (1977) |
| ≈ 8.1 × 10⁹ | <60 kpc | H i | Juraszek et al. (2000) |
| 2.6 ± 0.6 × 10¹¹ | <50 kpc | Totalc | This paper |
a Applying the  conversion ratio of 2.3 × 1020cm−2/(K km s−1) (Strong et al.1988) (see also Section 3.2).
b CO using i= 63° (Table 2) (Elmouttie et al. 1998b quote ≲3.9 ± 0.2 × 10⁹M⊙ for i= 73°).
c Assuming that the uncertainty in the tilted ring model, which is not given by gal, is much less than the uncertainty due to the distance estimate of Circinus (see footnote 5).
Gas and dynamical masses at various radii in Circinus.
| Mass (M⊙) | Radius | Type | Reference |
| ≈ 4 × 10⁸ | <440 pc | H2a | Elmouttie et al. (1998b) |
| ≲4.7 × 10⁹ | <440 pc | Totalb | Elmouttie et al. (1998b) |
| 1.0 ± 0.2 × 10⁹ | <680 pc | H2a | This paper |
| 3.3 ± 0.3 × 10⁹ | <560 pc | Total | Curran et al. (1998) |
| 2.0 ± 0.5 × 10⁹ | ≲5 kpc | H2a | This paper |
| ≈ 2.1 × 10¹⁰ | ≲5 kpc | Total | This paper |
| 1.9 ± 0.1 × 10⁹ | <10 kpc | H i | This paper |
| ≈ 6.2 × 10¹⁰ | <12 kpc | Total | This paper |
| ≥3.8 × 10⁹ | <35 kpc | H i | Jones et al. (1999) |
| 1.9 ± 0.3 × 10¹¹ | <35 kpc | Total | Jones et al. (1999) |
| 7.2 ± 0.5 × 10⁹ | <40 kpc | H i | Freeman et al. (1977) |
| 1.3 ± 0.2 × 10¹¹ | <40 kpc | Total | Freeman et al. (1977) |
| ≈ 8.1 × 10⁹ | <60 kpc | H i | Juraszek et al. (2000) |
| 2.6 ± 0.6 × 10¹¹ | <50 kpc | Totalc | This paper |
| Mass (M⊙) | Radius | Type | Reference |
| ≈ 4 × 10⁸ | <440 pc | H2a | Elmouttie et al. (1998b) |
| ≲4.7 × 10⁹ | <440 pc | Totalb | Elmouttie et al. (1998b) |
| 1.0 ± 0.2 × 10⁹ | <680 pc | H2a | This paper |
| 3.3 ± 0.3 × 10⁹ | <560 pc | Total | Curran et al. (1998) |
| 2.0 ± 0.5 × 10⁹ | ≲5 kpc | H2a | This paper |
| ≈ 2.1 × 10¹⁰ | ≲5 kpc | Total | This paper |
| 1.9 ± 0.1 × 10⁹ | <10 kpc | H i | This paper |
| ≈ 6.2 × 10¹⁰ | <12 kpc | Total | This paper |
| ≥3.8 × 10⁹ | <35 kpc | H i | Jones et al. (1999) |
| 1.9 ± 0.3 × 10¹¹ | <35 kpc | Total | Jones et al. (1999) |
| 7.2 ± 0.5 × 10⁹ | <40 kpc | H i | Freeman et al. (1977) |
| 1.3 ± 0.2 × 10¹¹ | <40 kpc | Total | Freeman et al. (1977) |
| ≈ 8.1 × 10⁹ | <60 kpc | H i | Juraszek et al. (2000) |
| 2.6 ± 0.6 × 10¹¹ | <50 kpc | Totalc | This paper |
a Applying the conversion ratio of 2.3 × 1020cm−2/(K km s−1) (Strong et al.1988) (see also Section 3.2).
b CO using i= 63° (Table 2) (Elmouttie et al. 1998b quote ≲3.9 ± 0.2 × 10⁹M⊙ for i= 73°).
c Assuming that the uncertainty in the tilted ring model, which is not given by gal, is much less than the uncertainty due to the distance estimate of Circinus (see footnote 5).
4.3 Mass inventory
In Table 4 we give the global values for the various masses in Circinus. The steep decline in column density beyond the central 3 kpc (Fig. 8) suggests that we have mapped most of the molecular gas, although from the gas-to-dust ratio, Schmidt & Boller (1993) estimate  , which would give
  using the total atomic gas mass of Juraszek et al. (2000). The ionized gas mass is obtained from the integrated Hα flux of the ionization cone within the central 30 × 30 arcsec2 (Elmouttie et al. 1998a). Since most of the ionized gas appears to reside in the ionization cone and starburst ring, within a radius of ≈ 300 pc (Marconi et al. 1994), we do not envision the total ionized gas mass competing with that of the neutral gas (recently, Roy, Goss & Anantharamaiah 2008 estimate an ionized gas mass of between 3 × 10³ and 1 × 10⁶M⊙ within a radius of 0.7 kpc). For the stellar mass content we have simply used the value typical for a large spiral and the dust mass is estimated from the gas-to-dust ratio given by Schmidt & Boller (1993). From this, it is apparent that the stellar population could easily account for the observed dynamical mass, although, as discussed in Section 4.1, the blue and visual brightnesses have all but petered out by time a radius of 10 kpc is reached. At this radius the dynamical mass is Mdyn≈ 5 × 10¹⁰M⊙, with ≈ 1011M⊙ being reached within the central 20 kpc (Fig. 14).
Mass inventory of the Circinus galaxy. The masses quoted are the (most) global values.
| Mass (M⊙) | Radius | |
| Molecular gas | 2.0 ± 0.5 × 10⁹ | ≲5 kpc |
| Atomic gas | ≈ 8.1 × 10⁹ | ≲60 kpc |
| Ionized gas | ∼106 | ≲0.3 kpc |
| Stars | ∼1011 | ≲10 kpc |
| Dust | ∼106 | ≲60 kpc |
| Total | ∼1011 | ≲60 kpc |
| Dynamical mass | ≈ 3 × 10¹¹ | <50 kpc |
| Mass (M⊙) | Radius | |
| Molecular gas | 2.0 ± 0.5 × 10⁹ | ≲5 kpc |
| Atomic gas | ≈ 8.1 × 10⁹ | ≲60 kpc |
| Ionized gas | ∼106 | ≲0.3 kpc |
| Stars | ∼1011 | ≲10 kpc |
| Dust | ∼106 | ≲60 kpc |
| Total | ∼1011 | ≲60 kpc |
| Dynamical mass | ≈ 3 × 10¹¹ | <50 kpc |
5 SUMMARY
We have studied the atomic and molecular emission in the Circinus galaxy through large-scale maps of the H i and CO 1 → 0 and 2 → 1 transitions. Our H i mosaic represents the largest high-resolution image of this galaxy to date, in which we recover 70 per cent of the total H i flux, while resolving the detailed gas distribution. We have mosaiced a field of ≈± 1°×±1°, thus recovering ≈30 per cent more flux than the primary beam limited image of Jones et al. (1999), giving the atomic gas distribution and dynamics to a radius of 50 kpc. The CO maps also represent the largest to date, spanning ±260 and ±100 arcsec along the major and minor axes, respectively, at a sensitivity of ≈ 10 mK per each 10 km s−1 channel. From our observations:
We confirm that the atomic gas in Circinus is distributed in a ≳50 kpc irregular disc, which is a factor of ≳5 times as extended as the optical and infrared emission. A tilted ring model of the H i velocity field agrees very well with the known warping in position angle and inclination, found by Jones et al. (1999), out to ≈ 30 kpc. Beyond this (to 50 kpc), the warping appears to dampen significantly.
We obtain clear detections of CO at a galactocentric radius of 3 kpc. Although the position angles and inclinations yielded by the tilted ring model of the CO velocity field may be unreliable, by assuming circular orbits for the molecular gas we find that the molecular disc also undergoes a (≈20°) warp within the inner 3 kpc, a radius at which it shares a similar inclination to the atomic gas. Note, however, that the apparent warp may be the result of non-circular motions, which are a distinct possibility due to the presence of the atomic bar on these scales (Jones et al. 1999).
The inner part of each gas structure also appears to maintain the same position angle on all scales; subpc (H2O), subkpc (CO) and ≲10 kpc (H i). This may suggest a continuous transportation of material to the active galactic nucleus, while ‘kinks’ are introduced when the outer diffuse gas encounters a bar.
We confirm the finding of the ring model of Curran et al. (1998) that there is more molecular (and less atomic) gas in the receding (SW) half of the ring.
We find that the CO profile is wider than that of the H i in both the full width at half-maximum and the total velocity spread. A comparison of the H i and CO position–velocity diagrams confirms that the molecular gas has different kinematics to the atomic gas. We believe that this indicates that the fastest rotating gas, which occurs within the subkpc ring, is indeed primarily molecular.
We also investigate the global integrated atomic and molecular gas intensities, and find the following.
Circinus has a total molecular gas mass of
 , cf. the atomic gas mass of MH i≈ 8 × 10⁹M⊙ (Juraszek et al. 2000).
Previously, Curran et al. (1998) found a gas mass fraction of
 , within the central kpc, which cast into doubt the validity of applying the standard Galactic conversion ratio of
  /(K km s−1) (Strong et al. 1988). However, over the global molecular gas emission we obtain a more canonical (Mgas≲ 0.1Mdyn; Mihalas & Binney 1981) ratio of ≈0.03. This is much smaller than the value (Mgas/Mdyn≈ 0.6) obtained by Elmouttie et al. (1998b).
Within the inner ≈ 3 kpc, the gas remains predominantly molecular, with the molecular hydrogen column density ranging from
 to ≈4 × 1022cm−2 cf. the atomic hydrogen column density of NH i≲ 1021cm−2. Furthermore, the CO 2 → 1/1 → 0 intensity ratio of ≈ 1 previously observed over the central beam is also seen over the whole of this region.
From the rotational dynamics of the gas, the steepest gradient of enclosed mass, dM/dr, occurs from ≈ 10–400 pc, although there is a low abundance of gas in this region (again, Mgas≲ 0.1Mdyn), probably due to consumption by the starburst. At ≳400 pc, which is approximately coincident with the molecular ring (Mgas/Mdyn≈ 0.5), there is a steep drop in velocity. This continues to ≈1 kpc, the extension of the atomic ring (Jones et al. 1999). Beyond these radii, velocities climb once more, until settling into solid body rotation at ≈150 km s−1. This continues to the 50 kpc limit of our tilted ring model, although most of the blue, visible and infrared radiation emanates from the central 10 kpc, suggesting that the dynamics beyond this region are halo dominated.
The Australia Telescope is funded by the Commonwealth of Australia for operations as a National Facility managed by CSIRO.
Operated until 2003 by the European Southern Observatory (ESO) and the Swedish National Facility for Radio Astronomy, Onsala Space Observatory, Chalmers University of Technology.
This is more apparent in the colour version of moment zero map, available from http://www.phys.unsw.edu.au/~sjc/circinus/
Because of the low resolution, our first moment CO maps are fairly featureless and the reader is referred to the oversampled, higher sensitivity CO 2 → 1 map of Curran et al. (1999).
For small angles the fractional uncertainty in this conversion is approximately equal to that of the distance estimate, which is ΔD/D= 0.8/4.2 = 0.19 (Section 1). This results in fractional errors of ΔM/M≈ 0.4 for the gas mass estimates and ≈ 0.2 for the dynamical mass estimates, although these uncertainties will cancel somewhat when comparing these masses (i.e. if one is overestimated so is the other).
They actually quote  , giving
  , using a
  conversion ratio of 1 × 1020cm−2/(K km s−1).
See footnote 6.
Fig. 9 of Curran et al. (1998) shows that this is a fair assumption in this particular case.
Because of the lower resolution and sensitivity to the inner regions, the diagram for the minor axis is fairly featureless and the reader is referred to the p–v diagram of Jones et al. (1999).
Because of the blanking of some ‘hot’ pixels in the receding side this is only modelled to 1800 arcsec.
The model velocity field and the residuals are available from http://www.phys.unsw.edu.au/~sjc/circinus/
There is some scatter, particularly at the lower radii, due to the effects of seeing, and in Figs 13 and 14 we have therefore excluded the central three points of Davies et al. (1998) (where r≲ 1 arcsec, cf. a seeing of ≳1.4 arcsec) and the central point of Maiolino et al. (1998) (where the seeing is ≈ 0.5–0.6 arcsec). As well as the seeing, uncertainties in the velocities are quoted: 9 to 15 km s−1 for the stars and 30 km s−1 for the N ii emission (Maiolino et al. 1998), which we do not show for the sake of clarity. While these data are characterized by linear fits on linear plots, in the log plot uncertainties in the position are hugely exaggerated.
Furthermore, the decrease would be much more gentle with radius than evident from the logarithmic scale of the plot.
We would like to dedicate this paper to the memory of Lars E. B. Johansson (1945–2008), who worked extensively on Circinus supervising SJC's doctorate, as well as providing valuable input to this paper. He will be sorely missed as a colleague and friend. We acknowledge the contribution of Raymond Haynes who was involved in the early stages of this project as well as the ATCA H i observations. We wish to thank the anonymous referee for their prompt and helpful comments, the SEST operators Francisco ‘Pancho Pollo’ Azagra and Felipe ‘El Maestro’ Mac-Auliffe, as well as Rob Beswick, Roy Booth, Biörn Nilsson, Per Bergman, Alan Pedlar, Carole Mundell, Steve Longmore, Michael Burton, Martin Thompson and Roberto Maiolino for their helpful input. Thanks to Gustaf Rydbeck who originally produced the deconvolved CO 2 → 1 image (Fig. 9, left). Very special thanks to Cormac ‘Mopra Boy’ Purcell for converting the xs FITS files into data cubes, which could then be modelled. This research has made extensive use of the miriad, xs and karma packages, the NASA/IPAC Extragalactic Database (NED) which is operated by the Jet Propulsion Laboratory, California Institute of Technology, under contract with the National Aeronautics and Space Administration and NASA's Astrophysics Data System Bibliographic Services.
REFERENCES
