


Abstract
The next generation of X-ray telescopes have the potential to detect faint quasars at very high redshift and probe the early growth of massive black holes (BHs). We present modelling of the evolution of the optical and X-ray active galactic nucleus (AGN) luminosity function at 2 < z < 6 based on a cold dark matter (CDM) merger-driven model for the triggering of nuclear activity combined with a variety of fading laws. We extrapolate the merger-driven models to z > 6 for a range of BH growth scenarios. We predict significant numbers of sources at z∼ 6 with fluxes just an order of magnitude below the current detection limits and thus detectable with XEUS and Constellation-X, relatively independently of the fading law chosen. The predicted number of sources at even higher redshift depends sensitively on the early growth history of BHs. For passive evolution models in which BHs grow constantly at their Eddington limit, detectable BHs may be rare beyond z∼ 10 even with Generation-X. However, in the more probable scenario that BH growth at z > 6 can be described by passive evolution with a small duty cycle, or by our merger-driven accretion model, then we predict that XEUS and Generation-X will detect significant numbers of BHs out to z∼ 10 and perhaps beyond.
1 INTRODUCTION
The next generation of X-ray satellites promise to be powerful probes of quasar activity out to very high redshifts. The European lead project XEUS1 is designed to reach a sensitivity ∼100 better than the deepest observations to date. Constellation-X2 would offer at least an order of magnitude improvement in sensitivity, hopefully paving the way for a mission like Generation-X3 which could probe 50 times fainter again.
In this paper we aim to assess the prospects for probing the early growth of supermassive black holes (SMBHs) at z≳ 6 with these telescopes or similar future X-ray missions [see e.g. Haiman & Loeb (1999) and Wyithe & Loeb (2003) for earlier work on this]. The observed correlations between SMBH mass and galaxy properties, which are now well established (e.g. Ferrarese & Merritt 2000; Gebhardt et al. 2000), strongly suggest a tight link between the build-up of the stellar mass in galactic bulges and the mass of the central BH. Most models of the growth history of SMBHs assume that the frequent merging of galaxies predicted by cold dark matter (CDM) like hierarchical models of galaxy formation plays an important role in this process (e.g. Kauffmann & Haehnelt 2000; Volonteri, Haardt & Madau 2003; Wyithe & Loeb 2003; Croton et al. 2006; Malbon et al. 2006). Such models, although subject to considerable degeneracies, have been reasonably successful in reproducing the observed luminosity function of active galactic nuclei (AGN) as well as the inferred BH mass function and their respective evolution with redshift. These models generally struggle, however, to combine the very efficient high-redshift growth of BHs, suggested by the SMBHs detected at z∼ 6, with the strong feedback required to reproduce the rapid decline in the fuelling rate of the most massive BHs at low redshift (Bromley, Somerville & Fabian 2004; Malbon et al. 2006). Furthermore, at low redshift there is considerable observational evidence that some, and may be even most, of the fuelling of SMBHs is not connected to major mergers between galaxies (e.g. Kauffmann et al. 2003; Li et al. 2008). This may be related to the fact that merger-driven models of quasar activity have difficulty reproducing the luminosity-dependent density evolution (LDDE) observed for faint AGN at redshifts below z∼ 3 (e.g. Ueda et al. 2003; Hasinger, Miyaji & Schmidt 2005; Bongiorno et al. 2007; Silverman et al. 2008) [see e.g. Marulli et al. (2007)], although more sophisticated models which follow the simultaneous growth of galaxies and AGN can incorporate feedback in such a way to orchestrate this effect (Fontanot et al. 2006).
We explore predictions for a variety of models for the early growth of SMBHs which range from merger-driven accretion to continuous Eddington-limited accretion. The BH growth scenario is crucial in determining the number of active BHs that we expect to detect as faint X-ray sources. However, as X-ray observations push to fainter flux limits they are expected to discover a mixture of low-luminosity objects at low to intermediate redshift, as well as distant objects previously at undetectable redshifts. Predictions for the redshift distribution of faint sources, which encrypt the growth history of SMBHs, therefore require a simultaneous study of the faint end of the luminosity function at all redshifts.
We have adopted a hybrid approach to modelling the redshift evolution of the X-ray emission associated with the fuelling of SMBHs. At low redshift (z≲ 2) we use the observed X-ray luminosity functions, which are now well established down to very faint luminosities. At intermediate redshifts the faint end of the X-ray luminosity function is still subject to some uncertainty due to the difficultly of assigning redshifts to faint sources (Aird et al. 2008). At 2 < z < 6 we have therefore adopted a CDM merger-driven model for the evolution of the emission from SMBHs, constrained by the available optical and X-ray data. The efficiency of BH formation, the quasar lifetime and accretion rate, and the quasar spectral energy distribution (SED) are all free parameters in such a model. The relevant assumptions should obviously be guided by our empirical and physical understanding of quasars, but there is still much flexibility, particularly near the observational limits in redshift and luminosity.
Observationally, faint AGN are more likely to display signatures of obscuration by gas and/or dust than brighter sources (Ueda et al. 2003; Simpson 2005; Treister et al. 2006; Maiolino et al. 2007). Most semi-analytic models of quasar activity do not model obscuration effects in sufficient detail to be able to explain these trends. Hopkins et al. (2005a,b,2006) and Hopkins, Richards & Hernquist (2007) have, however, recently presented a model for the quasar luminosity function (QLF) at z < 5, which includes prescriptions for quasar luminosity-dependent fading and absorption, to successfully reconcile the optical and X-ray QLFs. We follow a very similar approach and adopt many of the same assumptions. However, whereas Hopkins et al. (2006) extract the quasar formation rate from the constraints provided by the observed QLF, we use a cosmological galaxy merger rate from the extended Press–Schechter formalism (e.g. Lacey & Cole 1993). This will allow us to extend our model to the redshifts (z > 6) we are predominantly concerned with in a well-motivated way. Semi-analytic models are an efficient way of exploring the wide range of physically plausible evolutionary scenarios for the QLF. As we will discuss in some detail, the faint end of the luminosity functions, and therefore the redshift distribution of faint X-ray sources, is very sensitive to the assumed time dependence of the fading of the emission in different wavebands during galaxy mergers. We utilize the flexibility of our model to study the constraints on this fading rate provided by the optical, soft and hard X-ray QLFs, and the unresolved cosmic X-ray background (CXRB).
We then go on to explore several models for BH growth at z > 6 which are consistent with the observed data at 0 < z < 6 and span a wide range of possibilities for the rate of BH growth at high redshift.
Our paper is structured as follows. In Section 2 we briefly review the constraints on the optical and X-ray QLFs. We describe our merger-driven model for 0 < z < 6 in Section 3, and the high-redshift extensions in Section 4.3. In the main body of Section 4 we calibrate our model against the measured optical and X-ray QLFs. In Section 5 we examine the consistency of our models with the CXRB and observed log N–log S X-ray source distribution, and present our predictions for the source density detectable with future missions, before concluding in Section 6.
Throughout this paper we adopt a cosmological matter density Ωm= 0.27, baryonic matter density Ωb= 0.044, cosmological constant ΩΛ= 0.73, present-day Hubble constant H0≡ 100 h km s−1 Mpc−1= 71 km s−1 Mpc−1, a mass variance on scales of 8 h−1 Mpc σ8= 0.84 and a scale-invariant primordial power spectrum (slope n= 1).
2 OBSERVATIONAL CONSTRAINTS
We are primarily interested in exploring the constraints on the early growth of SMBHs that may be provided by future X-ray missions. In order to do this in a conservative way we tie our model to a wide range of observational constraints on the growth history of SMBHs at low and intermediate redshift offered by the QLF in the optical, soft and hard X-ray bands, as well as the CXRB.
The luminosity function of optically selected QSOs is well measured up to z≳ 4, with constraints on the bright end that reach up to z∼ 6 (Fan et al. 2003; Wolf et al. 2003; Croom et al. 2004; Fan et al. 2004; Jiang et al. 2008). The constraints on the X-ray QLF extend to z∼ 4 at best, but deep X-ray surveys reach to considerably fainter limiting magnitudes than optical surveys. Combined constraints of wide-field and deep surveys result in a dynamic range of around five orders of magnitude in luminosity at z∼ 2 compared to around three orders of magnitude at optical wavelengths. The low luminosities reached by deep X-ray surveys has allowed Shankar & Mathur (2007) to constrain the faint-end slope of the optical QLF at z∼ 6 from the dearth of X-ray detections above z∼ 4–5.
The density of optically bright quasars peaks at z∼ 3 with quasar activity decreasing towards both lower and higher redshift (e.g. Boyle et al. 2000; Wolf et al. 2003; Croom et al. 2004; Richards et al. 2006). The optical QLF is well fitted by a double power law with the break luminosity evolving self-similarly with redshift, although there is evidence for the bright-end slope flattening towards high redshift (Fan et al. 2004; Richards et al. 2006) (but see also Fontanot et al. 2007). More recent evidence that the space density of lower luminosity sources peaks at 1 < z < 1.5 (Bongiorno et al. 2007) suggests that the full picture is probably more complicated, and that the faint optically selected sources show a similar evolution to that seen in X-ray surveys. The X-ray luminosity function is best fitted with a LDDE model (e.g. Miyaji, Hasinger & Schmidt 2001; Fiore et al. 2003; Ueda et al. 2003; Hasinger, Miyaji & Schmidt 2005; Silverman et al. 2008) with the source density peaking at z∼ 0.7–1. Additional constraints at X-ray wavelengths come from the measurements of the CXRB (Worsley et al. 2005; Hickox & Markevitch 2006). Obviously the integrated emission from faint AGN below the current detection limits cannot exceed the measured unresolved CXRB and measurements of the background intensity are thus probably the strongest constraints on the faint end of the X-ray luminosity function.
3 A HYBRID MODEL FOR THE EVOLUTION OF THE EMISSION DUE TO ACCRETION ON TO SUPERMASSIVE BLACK HOLES
3.1 Rationale for a hybrid model
As motivated in Section 1, we have chosen a hybrid approach to modelling the evolution of the emission due to accretion on to SMBHs. At low redshift (z < 2) we use the well-established observed X-ray luminosity functions, which extend to impressively faint luminosities. At intermediate redshift, where the X-ray luminosity function becomes less reliable, we use a merger-driven CDM-like model with a range of assumptions for the decline of the accretion rate on to the central BH during a merger. This model is calibrated using the extensive optical data as well as the available X-ray data. In Section 4 we describe an extension of the merger-driven model, as well as models for growth via continuous Eddington-limited accretion with a range of duty cycles, to very high redshift (z > 6). Recently Shankar, Weinberg & Miralda-Escude (2007) constructed an observationally anchored model for the evolution of the SMBH population which indicates that the quasar duty cycle increases with increasing redshift, providing some empirical impetus for this approach.
We first discuss the ingredients of our merger-driven model in some detail.
3.2 A CDM-like merger-driven model for the luminosity function at intermediate redshift
We assume that the accretion of gas on to SMBHs is predominantly triggered by major galaxy mergers (Kauffmann & Haehnelt 2000; Di Matteo, Springel & Hernquist 2005; Hopkins et al. 2005a), and take the merger rate of dark matter haloes in the standard ΛCDM model for structure formation as a proxy for the rate of galaxy mergers. This picture is admittedly simple but has nevertheless been shown to yield a reasonably consistent model for many of the properties of the observed QLF and its evolution at intermediate redshifts (e.g. Haehnelt, Natarajan & Rees 1998; Wyithe & Loeb 2002; Volonteri et al. 2003; Wyithe & Loeb 2003; Croton et al. 2006; Marulli et al. 2007).
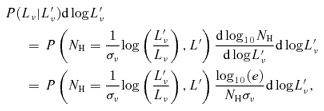
 , the luminosity function, dn/d log L, can be written as
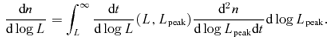
 , where vvir is the virial velocity of the dark matter halo from Barkana & Loeb (2001). Empirical estimates of α typically fall in the range 4–5. We have chosen α= 5 which is consistent with a simple self-regulated growth scenario in which the BH grows until it radiates enough energy to unbind the gas that is feeding it (e.g. Haehnelt et al. 1998; Silk & Rees 1998; Wyithe & Loeb 2003). The merger rate d2n/dlog Lpeakdt is taken as the merger rate of haloes with final BH mass such that Lpeak=LEdd(Mbh). Using equation (2) to relate BH and host halo mass, we may write
 is the merger rate of dark matter haloes of mass M−ΔM and ΔM per unit cosmic time t,
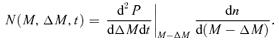
Here d2P/(dΔMdt) |M−ΔM is the probability per unit time that a halo mass ΔM will merge with another halo to form a halo with mass M from Lacey & Cole (1993), and dn/d(M−ΔM) is the space density of haloes with the appropriate mass difference from Press & Schechter (1974) (with modification from Sheth & Tormen (1999), see Rhook & Haehnelt (2006) and Wyithe & Loeb (2003) for similar calculations).
Equation (3) becomes inaccurate as dt/dlog L approaches the Hubble time at the relevant redshift. This could in principle be relevant at high redshift; however, at high redshift we are mainly concerned with the bright end of the QLF for which the fading time-scale remains short (see Section 3.3). Note that for dt/d log L (L, Lpeak) = constant (corresponding to an exponential light curve) or dt/d log L (L, Lpeak) ∝δ(L−LLpeak) (corresponding to a top-hat light curve) the shape of the QLF is identical to that of  .
.
3.3 Gas accretion, quasar lifetime and fading laws and the minimum black hole mass
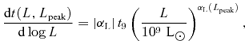

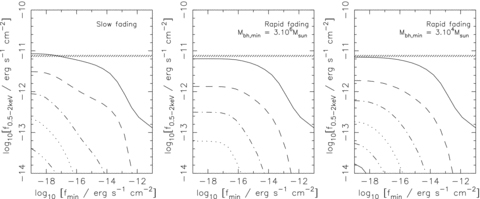
Here αL is a non-positive constant and larger values of |αL| result in light curves for which quasars spend relatively more time at sub-Eddington luminosities. Note that values of αL that are much less than zero are excluded by the observational data. Fig. 1 shows the fading laws described in equations (5) and (6) (left-hand panel) and equation (7) (right-hand panel) for various values of Lpeak as labelled, with parameters chosen to fit the observed QLF (see Section 4.1).
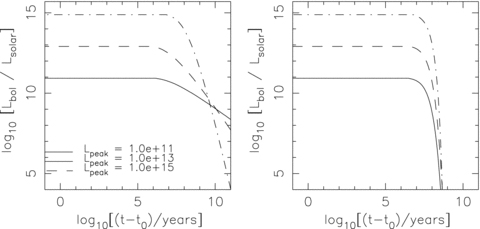
Light curves used to generate model QLFs for quasars with intrinsic, peak, bolometric luminosities of 1011 (solid line), 1013 (dashed line) and 1015 (dot–dashed line) L⊙. The left-hand panel shows the slow fading law, corresponding to equation (5) with the average lifetime (t9) increased by a factor of 2. The right-hand panel is for the rapid fading law dt/d log L= 1.7 × 10⁷ yr (L/Lpeak)−0.01 corresponding to rapid (almost exponential) luminosity-independent fading.
The faint end of the luminosity function is also sensitive to the minimum mass of a BH powering a quasar, Mbh,min, which for Eddington-limited growth, is equivalent to the minimum peak luminosity of a quasar, Lpeak,min. There are very few claimed detections of SMBHs with masses smaller than 106M⊙ (but see Greene & Ho 2007b), and Greene & Ho (2007a) find that the mass function of local low-luminosity active BHs turns over at Mbh∼ 106 M⊙. It is also a matter of intense debate whether the build-up of SMBHs by hierarchical merging extends to intermediate-mass BHs in the mass range 100–106M⊙ (e.g. Haehnelt 2004; Volonteri, Lodato & Natarajan 2008). We therefore also explore the effect of varying the minimum BH mass, Mbh,min, in our models.
3.4 Modelling the spectral energy distribution
To relate the intrinsic bolometric QLF to observational data, we also require a model for the intrinsic SED and a prescription for the relative obscuration of quasars at different wavelengths.
We adopt a modified version of the model SED presented in Hopkins, Richards & Hernquist (2007) to calculate the (luminosity-dependent) SED for a given observed frequency, νobs, quasar redshift, z, and bolometric luminosity, Lbol. This model assumes the SED to be essentially a broken power law which mimics reprocessed emission in the near-infrared (NIR), the ultraviolet (UV) bump and the hard X-ray excess features with an exponential cut-off at 500 keV. The SED is normalized so that the observed relation between optical and X-ray emission described by equation (8) with A= 0.109 and B= 1.739 is preserved.
Note that Hopkins et al. (2007) found that the luminosity dependence of the relation between optical and X-ray emission is more important for reconciling the optical and X-ray QLFs at 0 < z < 5 than the detailed modelling of the features in the SED. The anticorrelation of αOX with Lν(2500 Å) results in a narrower spread of X-ray luminosities compared to the corresponding optical range. The model X-ray QLF is thus steeper than the equivalent bolometric QLF.
We find that the bright end of our model X-ray luminosity function becomes too steep compared to the measurements in both the soft and hard X-ray bands when we use the Hopkins et al. (2007) SED. Including a dispersion in the bolometric corrections, which Hopkins et al. (2007) note, has the largest effect on the bright end of the X-ray QLF, would smooth the QLF and somewhat alleviate this. We have chosen instead to alter the luminosity dependence of the SED model to fit the data as described below.
To achieve a good match with the bright end of the observed X-ray QLF we adopt an SED for Lbol > 1014L⊙ with A= 0.104 and B= 1.739. We use the same power-law indices, break-points and exponential cut-off as Hopkins et al. (2007) but have not modelled the reflection component or the NIR emission. This choice of parameters increases the power in the soft and hard X-ray bands by approximately 40 per cent at Lbol= 1014L⊙, increasing to 45 per cent at 1015L⊙. The power at UV wavelengths changes minimally. To ensure a smooth QLF we take an average of the Hopkins et al. (2007) and the above modification for bolometric luminosities between 1012 and 1014L⊙ weighted by the logarithmic bolometric luminosity.
3.5 The effect of absorption on the SED
Light emitted from the accretion disc of the AGN is reprocessed during transmission through its host galaxy, the IGM and our own galaxy. At the X-ray energies and redshifts we are mainly interested in (observed-frame 0.5–10 keV) the absorption of X-rays by neutral hydrogen in the IGM can be neglected. Galactic absorption is generally corrected for, and therefore we are mainly concerned with absorption at the quasar redshift. Assuming that emission at all wavelengths is obscured by the same body of gas, the absorption at a particular wavelength can be determined given a column density distribution of neutral hydrogen (which may depend on parameters of the system), a dust-to-gas ratio and a reddening law for the dust absorption. We again adopt similar assumptions to Hopkins et al. (2005b) for our model, which we discuss in the following two sections.
3.5.1 Column density distribution of the absorbing gas
Note that the mean column density,  , and dispersion,
  , are predominantly determined by the instantaneous bolometric luminosity of the quasar L.
Hopkins et al. (2005a) also demonstrated that the shape of this distribution for quasars with a B-band luminosity above 1011L⊙ is consistent with a statistical analysis of the reddening found towards Sloan Digital Sky Survey (SDSS) quasars in Hopkins et al. (2004). This analytic fit is derived from simulations of gaseous disc galaxies, and of course may not be representative of the typical accretion rate on to BHs at all redshifts. However, at the redshifts that we are applying it (z > 2) galaxies are expected to be gas-rich.
3.5.2 Dust and gas absorption
Since we are predominantly comparing our model to optical data quoted in UV magnitudes we have used the reddening law presented in Gaskell et al. (2004) to model dust and gas absorption. The reddening law is normalized such that the optical depth in the V band (5500 Å) is the same as for an Small Magellanic Cloud (SMC) like reddening curve [taken from Pei (1992)] for a galaxy with the metallicity of the Milky Way. This results in a V-band optical depth identical to that adopted by Hopkins et al. (2005b) who assumed an SMC-like reddening curve with a gas-to-dust ratio as for the Milky Way. At X-ray wavelengths the absorption is dominated by photoelectric absorption and Compton scattering by hydrogen. Following Hopkins et al. (2005b) we assume an average neutral gas fraction of 0.35 and assume that the ionized component contributes to the photoelectric absorption, but not the optical reddening or Compton scattering. We note that this model makes the simplistic assumption that the distribution of gas and dust is spatially uniform.
3.6 The model luminosity function taking absorption into account
We now turn to calculating the observed luminosity function for a given redshift z and observed wavelength ν (or more usefully for comparison with X-ray observations, waveband νa→νb).
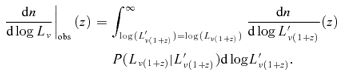
 ,
, 
3.7 The blowout phase
The probability distribution of the absorbing hydrogen column density given in equation (9) will not be an adequate description when the luminosity is close to the peak luminosity, as much of the gas is expected to be blown away by radiation pressure. As discussed by Hopkins et al. (2005a) the true column density distribution in the simulations is bimodal, with quasars in the last e-folding of growth having a much lower obscuring column density distribution. This so-called ‘blowout’ phase lasts approximately 10 per cent of the total time the quasar spends accreting. Hopkins et al. (2005a) suggest that this bimodality can explain why optically selected quasars are observed to have lower obscuring column densities for brighter quasars (e.g. Ueda et al. 2003), counter to the positive correlation between L and  in equation (9).
We have taken a simple approach to modelling such a blowout phase; we assume that a fraction fblowout= 0.1 of quasars within a factor of e of their peak luminosity experience no intrinsic absorption. The resulting absorbed luminosity function is then larger than that in equation (10) by a term dn/d log Lν(L/Lpeak > 1/e) fblowout, where dn/d log Lν(L/Lpeak > 1/e) is the QLF of sources with specific luminosity Lν that have total bolometric luminosity within e of their peak luminosity. dn/d log Lν(L/Lpeak > 1/e) increases with Lbol, and approaches the original (without blowout phase) value of dn/d log Lν for large Lbol. This prescription for the blowout phase essentially puts a lower limit on the ratio of the absorbed to unabsorbed luminosity function at high luminosities equal to fblowout.
The parameters of the blowout phase affect the relative number of bright optical and X-ray luminous sources. In particular, if we did not include a blowout phase (and were therefore assuming that more of the bright optical sources are obscured) then we would predict more X-ray bright sources. However, we find that the absorption in the soft X-ray band behaves similarly to that in the optical and therefore if we did not include the blowout phase it would be very difficult to reproduce the space density of quasars that are bright in soft X-rays.
4 EVOLUTION OF THE MODEL LUMINOSITY FUNCTION IN DIFFERENT WAVEBANDS AND COMPARISON WITH OBSERVATIONAL DATA
4.1 Calibrating the merger-driven model for the evolution of the luminosity function at intermediate redshift with observations
We vary the parameters (tq, ε0, Lpeak,min) in order to obtain an acceptable fit to the observed luminosity functions at rest-frame 1450 Å, and in the soft and hard X-ray bands. We determine the normalization of our models (governed by tq and ε0) by comparing to the observed optical QLF, as these constraints span the broadest redshift range. However, as we will discuss below, the optical data have little power to constrain Lpeak,min and constraints on this value come from low-luminosity X-ray observations alone.
We find that assuming the luminosity-independent fading law in equation (7), it is difficult to accommodate values of αL much less than zero, due to the intrinsic steepness of the cosmological merger rate we are adopting for the quasar formation rate. However, for αL=−0.01, tq= 1.74 × 10⁷ yr and ε0= 10−5.05 we recover a good fit to the optical QLF at z= 2–6 (see Fig. 2). This value of αL corresponds to a light curve for which the luminosity drops off almost exponentially with time; we will therefore refer to this model as the ‘rapid fading’ model. The corresponding light curve is compared to the Hopkins et al. (2005a) light curve (with some adjustment described below) in Fig. 1. The Hopkins et al. (2005a) fading law, with appropriate ε0, also provides a reasonable fit to the optical data at z= 2–6 as described by equation (5). To put it on equal footing with what we have done for the fit with the rapid fading law we allow the characteristic time, t9, to vary. We find that the fit is improved when t9 is increased by a factor of 2 to 2 × 10⁹ yr. A slightly larger value of ε0= 10−4.97 than that for the rapid fading model is required to offset the smaller amount of time that bright quasars spend at their Eddington luminosity. We refer to the model with this fading law as the ‘slow fading’ model. Since the two models provide comparable fits to the optical data, the optical data alone appears to offer little power to constrain the luminosity dependence of the fading law.
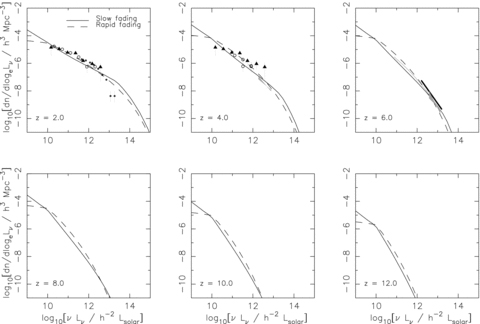
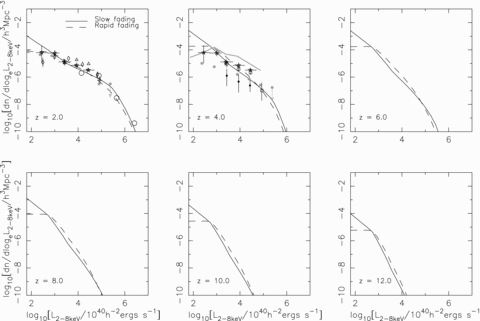
Model rest-frame 1450-Å QLF at z= 2, 4, 6, 8, 10, 12 for a merger-driven model with a slow fading law (solid line) and the rapid fading law (dashed line) as described in the text. Note that we have neglected absorption by neutral gas in the IGM which will affect what is observed in practice at z≳ 6. The hollow circles are the measurement of the faint-end QLF from the COMBO-17 survey (Wolf et al. 2003). The black triangles at z= 2, 4 show the luminosity function measured by Bongiorno et al. (2007) in the redshift interval 2.1 < z < 3.6. The small black diamonds at z= 2 are the results from Croom et al. (2004) using the SED from Hopkins et al. (2007) to convert from B band to rest-frame 1450-Å luminosities. The grey bow-ties represent the constraints on the bright-end QLF measured in the SDSS survey (Fan et al. 2003,2004). The thick black line at z= 6 is the fit from Jiang et al. (2008). The thin grey line at z= 6 is the Shankur & Mathur (2007) constraint on the slope of the QLF from the dearth of X-ray sources.
Note that there is an excess in the predicted number of optically bright quasars at z= 2 for each fading law. The most plausible explanation for this discrepancy between our model and the data is probably our neglect of AGN feedback. AGN inject large amounts of heat into their surroundings (e.g. Dunn & Fabian 2006; Best et al. 2007) and should be capable of suppressing cooling flows in dark matter haloes with masses above ∼ few × 1013h−1M⊙– resulting in the formation of groups and clusters of galaxies rather than supersized quasars in very large dark matter haloes (see e.g. Sijacki & Springel 2006; Rines, Diaferio & Natarajan 2007; Sijacki et al. 2007). This effect is expected to be more prominent at low redshifts when the typical masses of merging dark matter haloes are largest. Indeed most semi-analytic models of the quasar population require some arbitrary high-mass cut-off in order to fit to the low-redshift data (e.g. Kauffmann & Haehnelt 2000; Cattaneo et al. 2007). To capture this effect in our model in a redshift-dependent way would be difficult and we do not attempt this here. It is also for this reason that our model, and similar semi-analytic models for the QLF, do not reproduce QLF below z∼ 2 very well.
With tq and ε0 chosen to reproduce the optical luminosity functions we find fairly good agreement with the observed z∼ 2 QLF in the hard X-ray band, and consistency with the constraints on the z∼ 4 hard X-ray QLF (see Fig. 3). The value of the minimum BH mass (or minimum peak luminosity) does not affect the QLF at the luminosities relevant for optical constraints. However, the constraints on the X-ray QLF are approximately two orders of magnitude deeper at z= 2 than in the optical, and we find that a cut-off at Lpeak= 1011 L⊙ is required for the rapid fading model in order to avoid overpredicting the number of sources in the lowest luminosity bin in the hard X-ray QLF at z= 2. We apply the same cut-off in Lpeak to the Hopkins-fading model and find that it overpredicts the rather shallow faint end of the observed luminosity function at z= 2 in the hard X-ray band (see Fig. 3). Note that an Eddington luminosity of 1011L⊙ corresponds to a BH mass ∼3.106M⊙ and there is certainly evidence for the existence of BHs with masses smaller than this (e.g. Greene & Ho 2007b).
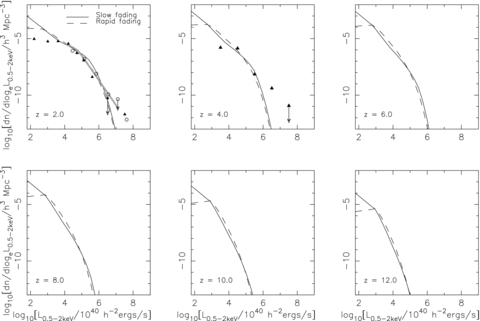
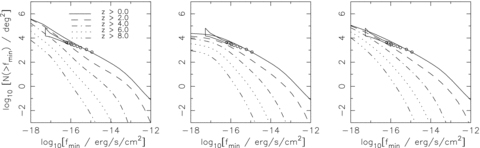
Model rest-frame 2–8 keV QLF at z= 2, 4, 6, 8, 10, 12 for a merger-driven model with slow fading (solid line) and rapid fading (dashed line) as in Fig. 2. The filled grey circles are estimates from Barger et al. (2005) and the hollow grey circles the rest-frame 2–10 keV data from Ueda et al. (2003). The thick grey line in the z= 4 panel corresponds the estimate from Barger et al. (2005) assuming that all spectroscopically unconfirmed sources lie in the z= 3–5 bin. The black markers are the hard X-ray QLF from Silverman et al. (2008); the hollow diamonds for 1.5 < z < 2, the hollow triangles for 2 < z < 3, the hollow squares for 3 < z < 4 and the filled circles for 4 < z < 5.5. The stars with horizontal and vertical error bars are the measurement for 2.5 < z < 3.5 from Aird et al. (2008).
In Fig. 4 we plot our model observed-frame 0.5–2 keV QLF and compare it to the results of Miyaji, Hasinger & Schmidt (2000), Miyaji et al. (2001) and Hasinger et al. (2005). Even with the increased power at X-ray wavelengths for the brightest sources, we still seem to underpredict the space density in the brightest bins at z= 2 and 4. Note, however, that the highest L data point at each redshift is calculated from only once source with an extremely high soft X-ray luminosity of ∼1014L⊙, and therefore this discrepancy is probably not significant.
Observed-frame 0.5–2 keV QLF at z= 2, 4, 6, 8, 10, 12 for the same models as in Fig. 3. The thick grey line is the best-fitting LDDE model from (Miyaji et al. 2000) (LDDE2). The hollow markers are the binned luminosity function for z= 1.6–2.3 from Miyaji et al. (2001). The black triangles denote the type I AGN QLF from (Hasinger et al. 2005).
We find that whilst the normalization determined from the optical constraints reproduces the counts well at intermediate luminosities, our models consistently overpredict the number of faint sources at z= 4, and to a lesser extent at z= 2, when compared to the type I AGN luminosity function of Hasinger et al. (2005). This inconsistency may be partially attributable to the restriction of Hasinger et al. (2005) to type I (unobscured) AGN and incompleteness of the optical identification. If we take the data at face value, then given that the merger rate of galaxies steepens significantly towards higher redshifts, then the Hasinger et al. (2005) data suggest that for a merger-driven model of quasar activity, Lpeak,min must be increased by approximately an order of magnitude to 1012L⊙. Such a cut-off brings the rapid fading model into agreement with the hard and soft X-ray data at z= 2, 4, and eases, though does not eradicate, the excess of faint objects predicted by the slow fading model. This modification would not alter the agreement of either model with the optical constraints.
Invoking a cut-off at Lpeak,min= 1012L⊙ corresponds to a minimum mass of active BHs of ∼3 × 10⁷M⊙ in our model. Whilst the mass function of local BHs may turn over at around this value (e.g. Greene & Ho 2007a,b), this trend is highly uncertain and direct measurements of BH masses at higher redshift are not yet available.
However, it appears possible that the current surveys have underestimated the space density of faint sources at z= 4 (Aird et al. 2008). Note that if the measurements of a small space density of faint hard and soft X-ray selected quasars at z= 4 and the sudden drop in the density of X-ray quasars between z= 2 and 4 consolidate, then the density of high-redshift X-ray quasars, and therefore the number of sources detectable by the next generation of X-ray satellites, may be lower than we are predicting with our fiducial merger-driven model. In the discussion that follows we will also discuss results for a slow and rapid fading models with Lpeak,min= 1012L⊙.
4.2 Extrapolating the evolution of the luminosity function in the merger-driven model to very high redshift
A prominent feature in our models of the high-redshift hard and soft X-ray QLFs is the break at low luminosities in the rapid fading model due to the cut-off Lpeak,min= 1011L⊙. No such break is observed for the slow fading model where the sources with Lpeak=Lpeak,min fade gradually. Above the break, the X-ray QLF exhibits little dependence on the fading law. This is because at high redshift the dependence of the merger rate on luminosity in our model results in a luminosity function with steeper slope than the fading rate of sources for either fading model. There exists therefore a degeneracy in the prediction of the number of faint sources between the slope of the assumed fading law and the minimum peak luminosity. Values of Lpeak,min < 1011L⊙ are certainly plausible at high redshift; theoretical models for the formation of the first BHs suggest that seed BHs with masses between 100 and 105M⊙ may form as early as z= 20 (e.g. Madau & Rees 2001; Volonteri 2006). In Section 6 we explore the possibility of a lower value of Lpeak,min= 109L⊙ (Mbh,min≈ 3 × 10⁴M⊙).
4.3 Alternate models for the early growth of supermassive black holes
The exponential growth of BHs in this model makes it unsuitable for modelling the QLF below z∼ 6. We therefore consider this model as a possible alternative to the merger-driven evolution only at z > 6. We adopt the rapid fading merger-driven model with Lpeak,min= 109L⊙ at z < 6.
Extending the absorption laws used in the previous section, which were determined from estimates of the average column density along the line of sight to a pair of merging galaxies, is probably not meaningful for continuously accreting BHs. We therefore simply assume that a fixed, luminosity-independent fraction of the accreting BHs are unobscured, and that the rest are Compton-thick (completely obscured in the optical and X-ray). The total duty fraction is then made up of the duty fraction of BHs that are accreting in an X-ray luminous phase flum and those that are accreting in a Compton-thick phase fobsc.
Note that for a model in which the BHs are growing continuously (although with some duty cycle) the concept of a fading law is also no longer meaningful since we are assuming that there is always enough gas for the BHs to accrete at their Eddington limit.
We have explored the evolution above z= 6 for two values of the total duty fraction, fduty= 0.1, 1.0. The fraction of obscured sources at high redshift is unknown but is certainly significant at lower redshift (e.g. Risaliti, Maiolino & Salvati 1999; Martínez-Sansigre et al. 2007). We assume that half of the sources are totally obscured in each case, which is consistent with the constraints from population synthesis models of the CXRB (Gilli, Comastri & Hasinger 2007).
For our models with Eddington-limited BH growth at z > 6 our assumptions governing the accretion rate and intrinsic absorption change discontinuously at z= 6 in such a way that the observed hard X-ray QLF changes smoothly. This alternate model for the early growth of SMBHs should thus be regarded only as a demonstration of the uncertainty in the growth rate of BHs, and therefore the number of detectable X-ray quasars, at very high redshifts.
In Section 5.3 we explore the predictions for the number of quasars detectable at X-ray wavelengths for both passive and merger-driven BH growth scenarios. We first compare our merger-driven models to the constraints from the observed flux distribution of X-ray sources and the CXRB.
5 X-RAY NUMBER COUNTS AND REDSHIFT DISTRIBUTION AT FAINT FLUX LEVELS AND THE EARLY GROWTH OF SUPERMASSIVE BLACK HOLES
5.1 X-ray source counts and redshift distributions
The main aim of our modelling is to predict the X-ray source counts and the corresponding redshift distribution at faint flux levels.
The X-ray source counts (‘the log N–log S relationship’) are well described by a double power law, with the slope flattening for fluxes below ∼1.5 × 10¹⁴ erg s−1 in the soft X-ray band and below ∼4.5 × 10¹⁵ erg s−1 in the hard X-ray band (e.g. Cowie et al. 2002; Moretti et al. 2003). More recently, the constraints on the number counts have been extended to lower sensitivities by fluctuation analyses of the unresolved background. These constraints generally still allow for an upturn in the log N–log S relationship below the detection limit for resolved sources (e.g. Hickox & Markevitch 2006).
In the top panel of Fig. 5 we plot the source counts as a function of limiting flux sensitivity in the hard X-ray (2–10 keV) band and in Fig. 6 for the soft (0.5–2 keV) band. The left-hand panels show the results for the slow fading model, the middle panels for the rapid fading model with Lpeak,min= 1011L⊙ and the right-hand panels for the rapid fading with Lpeak,min= 109L⊙. In each case the overplotted data are taken from the fluctuation analysis of Miyaji & Griffiths (2002) for the Chandra Deep Field-North (CDF-N). Recall that below z= 2 we have supplemented our model for the X-ray QLF with a fit to the observed QLFs (calculated at discrete redshifts z= 0.01, 0.6, 1.2). We have used the PLE model from Barger et al. (2005) for the hard X-ray band and the LDDE2 model from (Miyaji et al. 2001) for the soft X-ray band. Therefore by construction our models should reproduce the observed source counts if our model is a reasonable approximation at z≥ 2.
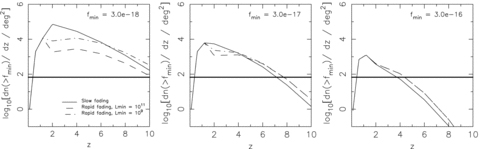
Results for the expected number counts of sources in the 2–10 keV band for the model with slow fading (left-hand column) and rapid fading with Lpeak,min= 1011L⊙ (middle column) and Lpeak,min= 109L⊙ (right-hand column). Note that the models have been supplemented with observational QLFs below z= 2 as described in the text. The top panel shows the counts integrated from z= 0, 2, 4, 6, 8, 10 to z= 20 as labelled. The hollow markers with error bars (bow-tie) are the estimate of the resolved (unresolved) source density in the Chandra Deep Field by Miyaji & Griffiths (2002). The bottom panel shows the redshift distribution of the counts for sources above flux levels of 3.0e−18 (dotted line), 3.0e−17 (solid line) and 3.0e−16 (grey line) in CGS units.
Results for the expected number counts in the 0.5–2 keV band for the models in Fig. 5. At z < 2 the models have been supplemented with the LDDE2 fit to the measured 0.5–2 keV QLF from Miyaji et al. (2000). The hollow markers with error bars (bow-tie) are the estimate of the resolved (unresolved) source density in the Chandra Deep Field by Miyaji & Griffiths (2002).
Our models are consistent with the constraints on the hard X-ray counts for both the rapid and slow fading laws. However, for the soft X-ray counts only the rapid fading models are consistent with the observed counts. Using the slow fading law our model slightly overshoots the faint soft X-ray counts and lies above the limit suggest by the fluctuation analysis of Miyaji & Griffiths (2002), as is expected from the inconsistency with the measured QLF at z∼ 2 discussed in Section 4.1. For the slow and rapid fading models with Lpeak,min= 1012L⊙, the number counts below the current detection levels are reduced, bringing the slow fading model into agreement with the fluctuation analysis and resulting in a flat source distribution at low flux levels for the rapid fading model.
In the lower panel of Fig. 5 we plot the normalized redshift distribution for the source counts above three flux/sensitivity levels. The grey line is for the approximate sensitivity of current X-ray satellites (3 × 10⁻¹⁶ erg s−1 cm−2), the solid black line for an order of magnitude fainter (3 × 10⁻¹⁷ erg s−1 cm−2) and the dotted line for the goal sensitivity of a 1-Ms observation with XEUS (3 × 10⁻¹⁸ erg s−1 cm−2, but see the discussion in Section 5.3). We note the strong dependence of the redshift distribution on the fading law. For the slow fading model the probability for source detection peaks at z∼ 1–3 for each of the chosen flux limits, with the peak shifting to slightly higher redshift for the lower flux limits. For this model the source counts remain dominated by fading objects at intermediate redshifts where the space density of quasars is at its peak.
For the rapid fading models the source distribution is sharply peaked at z∼ 1 for the brightest flux limit. This is not surprising: this is where most of the known sources lie and we have used the observed data at low redshifts as our model QLF. At fainter flux limits a second broader peak around z∼ 4 emerges for the rapid fading models. The broad high-redshift peak at faint flux level in our model is due to the steepening of the merger rate at z > 2 combined with the increase in the comoving volume element out to z∼ 3.5.
The emergence of two distinct populations at faint flux levels, at low and high redshift, can be explained physically by an evolution of the Eddington ratio and the characteristic lifetime with redshift. Observationally, optically selected high-redshift and/or high-luminosity AGN display near Eddington accretion rates (see e.g. McLure & Dunlop 2004; Kollmeier et al. 2006), whereas hard X-ray selected sources at z < 1 appear to have much lower accretion rates (e.g. Babić et al. 2007). At decreasing flux levels surveys will become sensitive to both the very faint sources accreting at low redshift and sources accreting at higher rates at high redshift, and therefore the source distribution should become double peaked.
The predicted high-redshift peak for the rapid fading model is, as expected, more prominent for the scenario where more abundant, smaller mass BHs may power quasars. For the case with Lpeak,min= 109L⊙ almost a fifth of sources are predicted to be above z∼ 6 at the lowest flux level plotted. The fraction of sources expected above z= 4, 6, 8 for each of the models at the three flux limits shown in Fig. 5 is tabulated in Table 1.
Table of the fraction of sources with observed 0.5–2 keV fluxes above fmin and redshift above zmin for the three merger-driven models considered.
| fmin (erg s−1 cm−2) | Fading law | zmin | xobs |
| 3.0e−16 | Slow | 4 | 3.1 × 10⁻² |
| 6 | 1.9 × 10⁻³ | ||
| 8 | 5.9 × 10⁻⁵ | ||
| Rapid | 4 | 6.0 × 10⁻² | |
| Lpeak,min= 1011L⊙ | 6 | 4.2 × 10⁻³ | |
| 8 | 1.3 × 10⁻⁴ | ||
| Rapid | 4 | 6.0 × 10⁻² | |
| Lpeak,min= 109L⊙ | 6 | 4.2 × 10⁻³ | |
| 8 | 1.3 × 10⁻⁴ | ||
| 3.0e−17 | Slow | 4 | 1.3 × 10⁻¹ |
| 6 | 1.8 × 10⁻² | ||
| 8 | 1.6 × 10⁻³ | ||
| Rapid | 4 | 2.1 × 10⁻¹ | |
| Lpeak,min= 1011L⊙ | 6 | 4.8 × 10⁻² | |
| 8 | 5.5 × 10⁻³ | ||
| Rapid | 4 | 2.0 × 10⁻¹ | |
| Lpeak,min= 109L⊙ | 6 | 4.0 × 10⁻² | |
| 8 | 4.5 × 10⁻³ | ||
| 3.0e−18 | Slow | 4 | 2.3 × 10⁻¹ |
| 6 | 4.8 × 10⁻² | ||
| 8 | 8.2 × 10⁻³ | ||
| Rapid | 4 | 3.2 × 10⁻¹ | |
| Lpeak,min= 1011L⊙ | 6 | 1.2 × 10⁻¹ | |
| 8 | 3.0 × 10⁻² | ||
| Rapid | 4 | 4.6 × 10⁻¹ | |
| Lpeak,min= 109L⊙ | 6 | 1.7 × 10⁻¹ | |
| 8 | 4.3 × 10⁻² |
5.2 The integrated X-ray background
The CXRB and its unresolved component provide an important consistency check for models of the number of faint sources.
In Figs 7 and 8 we compare the total CXRB flux predicted for the slow fading model, and the rapid fading models with low and high Lpeak,min, to the measurement of the total CXRB from Moretti et al. (2003). This contribution is plotted as a function of the minimum detectable flux for sources with redshifts above z= 0.01, 2, 4, 6, 8 and 10. We note that the resolved fraction is sensitive to uncertainties in the absolute value of the CXRB. We restrict our analysis of the resolved fraction to energies below 10 keV, where variations in the normalization between experiments differ by ∼10 per cent (see e.g. Moretti et al. 2003).
Integrated hard (2–10 keV) X-ray flux due to AGN for the models in Fig. 5. The hatched region shows the estimate of the total extragalactic CXRB in the 2–10 keV band from Moretti et al. (2003). The left-hand panel is for slow fading with Lpeak,min= 1011L⊙. The middle (right-hand) panels show the results for rapid fading with Lpeak,min= 1011L⊙ (Lpeak,min= 109L⊙).
Integrated soft (0.5–2 keV) X-ray flux due to AGN for the models in Fig. 6. The hatched region shows the estimate of the total extragalactic component of the CXRB in the 0.5–2 keV band from Moretti et al. (2003).
In the 2–10 keV band, we find that all models are consistent with the total measured CXRB. Our models predict that ∼70–78 per cent of the total 2–10 keV CXRB is due to AGN with fluxes above the best current sensitivity level in this band (∼1.4 × 10⁻¹⁶ CGS). This result is consistent with the ∼80 per cent resolved fraction measured by Worsley et al. (2005) and Hickox & Markevitch (2006). Our models remain consistent with the total CXRB at lower flux limits. At a sensitivity of 3 × 10⁻¹⁸ CGS – a sensitivity within reach of next generation instruments (see Section 5.3) – the resolved fraction increases to ∼87 per cent depending on the model. Our models thus still leave room for the very hard spectrum sources needed to make up the CXRB at energies > 8 keV (Worsley et al. 2005) and/or the population of star-forming galaxies expected to contribute significantly at low flux levels (e.g. Bauer et al. 2004). We note that our calculated resolved fractions also depend on the analytic fits we have used below z= 2. Using the more recent LDDE model from Silverman et al. (2008) we obtain lower resolved fractions (∼62–75 per cent due to sources above the current detection level), consistent with the more stringent optical selection criteria for this sample.
In the soft X-ray band (0.5–2 keV), the fraction of the total CXRB flux due to sources above the current sensitivity level (∼2.5 × 10⁻¹⁷ CGS) in our models is again consistent with the 80–90 per cent found by Worsley et al. (2005) and Hickox & Markevitch (2006). However, at fainter flux levels the slow fading model overpredicts the total CXRB, again reflecting the excess of faint sources at z∼ 2 compared to the observed QLF. This contribution again depends on the faint-end behaviour of the fits to the data that we have adopted below z∼ 2. As mentioned, for the soft X-ray band we have chosen to use the LDDE2 model from Miyaji et al. (2001) which is constructed to reproduce ∼90 of the total soft X-ray background when integrated out to z∼ 5. Alternate faint-end extrapolations may somewhat ease this excess. Using the Hasinger et al. (2005) LDDE fit to the luminosity function of type I AGN below z= 2 we find that the slow fading model saturates, but does not overpredict the soft X-ray background. However, the Hasinger et al. (2005) LDDE fit to the soft X-ray type I QLF only accounts for ∼35 per cent of the soft band CXRB, reflecting the fact that the sample of type I AGN used in Hasinger et al. (2005) account for only around 30 per cent of sources at faint and bright flux levels.
The resolved fractions are naturally lower for the slow and rapid fading models with Lpeak,min= 1012L⊙ (chosen to reproduce the soft X-ray QLF at z∼ 2), and with this choice the slow fading model remains consistent with the total CXRB.
Recently, Worsley et al. (2005) and Hickox & Markevitch (2006) have pushed the limit for the unresolved background further by taking into account the stacked emission from galaxies detected with the Hubble Space Telescope and IRAC. Indeed we find that if we integrate the flux due to sources below the current detection level and compare this to the measurement of the unresolved component as derived by Hickox & Markevitch (2006), the soft and hard X-ray components are both too large for the slow fading model. Models like this for which sources with relatively flat spectra recover the entire unresolved CXRB in the soft and hard bands are likely to be in conflict with the overall measured shape of the CXRB above 8 keV (e.g. Comastri et al. 1995; Worsley et al. 2005; Gilli et al. 2007). This consistency check argues further against the slow fading model as we have applied it, but we note that a flattening of the fading law slope for low-mass BHs would alleviate the inconsistencies with the CXRB and the soft X-ray source counts. In particular the slow fading model with Lpeak,min= 1012L⊙ saturates, but does not overpredict the unresolved component of the soft CXRB.
In a recent paper, Salvaterra, Haardt & Volonteri (2007) predict the contribution of high-redshift AGN to the unresolved CXRB for a merger tree based model for the Eddington-limited growth of BH seeds. They find that ∼5 per cent of the unresolved 2–10 keV CXRB will be due to sources at z > 6. This is similar to the ∼10 per cent that we predict for the rapid fading model with Mbh,min= 3 × 10⁴M⊙, but significantly larger than we would predict for models with larger Mbh,min.
In the next section we focus on the predictions for the rapid fading models, since these are consistent with all available data, but have included the predictions for the slow fading model for reference.
5.3 Future hard X-ray surveys and the early growth of supermassive black holes
The sensitivities of the deepest X-ray surveys to date are photon limited and therefore independent of the background intensity. This may not be the case for the effective collecting area(s) and angular resolution(s) anticipated for XEUS and Constellation-X. Estimates of the point source sensitivity for future instruments therefore potentially become dependent on the assumed unresolved extragalactic component (due to quasars and star-forming galaxies) and its flux distribution, as well as the effective collecting area and photon extraction radius (or resolution). Due to uncertainties in the decomposition of the X-ray background into contributions from the galaxy, star-forming galaxies and quasars, it is somewhat uncertain what the confusion limit of these telescopes will be. The projected point source sensitivities for the next generation telescope peak for soft X-ray energies. At these energies the soft thermal galactic component is a significant portion of the background (see e.g. Parmar et al. 1999); however, the contribution of unresolved point sources may also play an important role if the ambitious goals for the resolution are not achieved. Since our models predict the contribution of quasars to this background, the expected sensitivity of an instrument like XEUS to high-redshift sources may depend on the modelling of faint sources.
Hasinger et al. (2006) discuss the anticipated point source sensitivity of Constellation-X and XEUS. Assuming that the observations are confusion limited when there are fewer than 40 ‘beams’ per source, combined with estimates of the background due to unresolved extragalactic sources, galactic emission and cosmic rays, Hasinger et al. (2006) project that a 1-Ms observation with XEUS will yield a point source sensitivity of 3 × 10⁻¹⁸erg s−1cm−2, approximately 200 times better than that of XMM–Newton. This estimate presumes that XEUS's goal resolution of 2 arcsec will be achieved. Achieving this resolution is expected to be extremely challenging, and the required resolution of 5 arcsec is perhaps more realistic (Hasinger et al. 2006). For this resolution the sensitivity degrades to ∼2 × 10⁻¹⁷ erg s−1 cm−2 for a 1-Ms integration. Similarly, for Constellation-XHasinger et al. (2006) project a point source sensitivity of 2 × 10⁻¹⁷ erg s−1 cm−2 for a 1-Ms observation for the Constellation-X goal resolution of 5 arcsec.
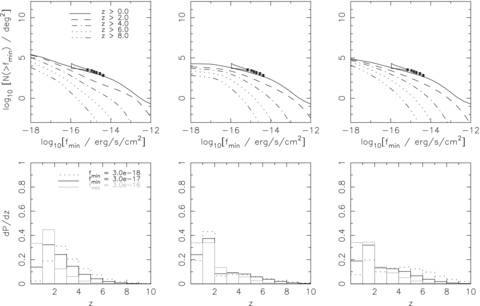
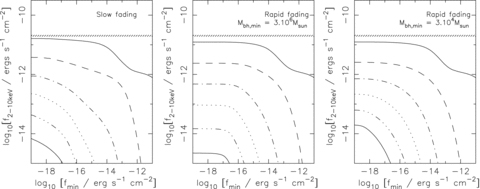
Assuming a circular beam and applying the above confusion criterion suggests that XEUS will be able to identify point sources with densities below ∼8.6 × 10⁴ deg−2 if it reaches its goal resolution. Comparison with the source densities in our models suggests that XEUS should not suffer from confusion due to faint AGN at this flux limit for the rapid fading models, but would do so below ∼10−17 erg s−1 cm−2 for the slow fading model. The reduced sensitivity is not merely attributable to the excess in the predicted number of faint sources at z∼ 2, since the density of sources above z∼ 4 alone are sufficient to stop XEUS from reaching its projected sensitivity in this model. This suggests that the confusion limit for XEUS may be somewhat sensitive to the way quasars fade at 2 < z < 6. However, we note that the same slow fading model with a higher minimum peak luminosity Lpeak,min= 1012L⊙ would not predict a degradation of the estimated point source sensitivity due to source confusion by faint AGN. Obviously the situation would be less favourable if the resolution goal of 2-arcsec HEW could not be achieved. If the resolution is reduced to the required value of 5 arcmin, we find the density of sources above ∼5 × 10¹⁷ erg s−1 cm−2 exceeds the density defined by the confusion limit (∼1.4 × 10⁴ deg−2) for the rapid fading model with Lpeak,min= 109 L⊙, and even the rather flat low-flux source density in the rapid fading model with Lpeak,min= 1011 would limit the sensitivity to sources with fluxes above ∼3 × 10¹⁷ erg s−1 cm−2. Similar sensitivities would be applicable to Constellation-X if it reaches its goal resolution.
The planned WFI4 is designed to have a field of view (FOV) of (7 arcmin)2[compared to (5 arcmin)2 for Constellation-X, Garcia (2007)]. An unclustered distribution of sources with density ∼6.7 × 101 deg−2 will then contain one source per WFI FOV. We highlight this density as a horizontal line in Figs 9 and 10 for reference. For the rapid fading models, for which observations should not be confusion limited down to the goal sensitivity of XEUS, we predict significant numbers of sources (more than one per WFI FOV) out to z∼ 10. To put these sensitivities in context for models of SMBH growth, in Fig. 11 we plot the 0.5–2 keV flux in the observed frame for BHs accreting at their Eddington limit (using the Hopkins et al. (2007)z-independent SED) as a function of the source redshift. The lowest mass BH that may be seen accreting at its Eddington limit at z∼ 6–10 for a 1-Ms observation with XEUS is in the range ∼105–5 × 10⁵M⊙. For a model in which only BHs larger than ∼3 × 10⁷M⊙ are active (i.e. Lpeak,min= 1012L sun), the redshift limit up to which we predict more than one source per XEUS field is reduced to 8 (7) for the slow (rapid) fading model.
Redshift distribution of predicted counts in the 0.5–2 keV band for each model; slow fading (solid line), rapid fading with Lpeak,min= 1011L⊙ (dashed line) and Lpeak,min= 109L⊙ (dot–dashed line) for three flux limits as labelled in CGS units. The horizontal line corresponds to a density of one source per XEUS WFI FOV.
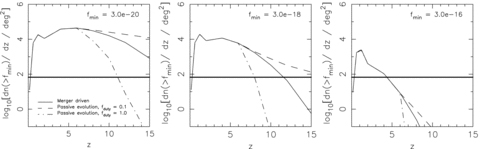
Redshift distribution of counts in the 0.5–2 keV band for the rapid fading merger-driven model and passive evolution models as described in text; merger driven (solid line), passive evolution with total duty cycle fduty= 0.1 (dashed line) and fduty= 1.0 (dot–dashed line) for three flux limits as labelled in CGS units. Note that the lowest flux limit is the anticipated sensitivity for the Generation-X mission (left-hand panel), the middle panel is for a 1-Ms observation with XEUS and the right-hand panel for a point source within reach of current instruments. The horizontal line corresponds to a density of one source per XEUS WFI FOV (7 arcmin)2, which is similar in area to the proposed FOV for Generation-X.
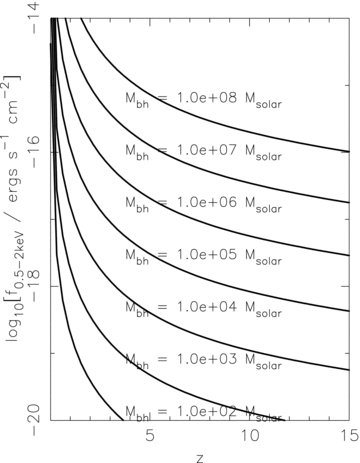
Observed 0.5–2 keV flux from a BH with the Hopkins et al. (2007) SED shining at its Eddington limit as a function of source redshift. BH masses as labelled.
Contrastingly a telescope with 5-arcsec resolution, which as mentioned above may be confusion limited below ∼3 × 10⁻¹⁷ erg s−1 cm−2, may be sensitive enough to detect to more than one source per XEUS (Constellation-X) FOV up to z∼ 7 (z∼ 6), but detection of significant numbers of sources at higher redshifts would require surveying many XEUS/Constellation-X fields (see Fig. 9). This result changes little for the case Lpeak,min= 1012L⊙, with approximately one source per XEUS field out to z∼ 6 predicted independently of the fading law.
The confusion limits we have discussed represent the best case for each model given the assumptions in Hasinger et al. (2006) for the contribution from galactic emission and star-forming galaxies, and the true confusion limits may therefore be worse if these have been underestimated.
Improvements in the resolution of hard X-ray telescopes will naturally improve the confusion limit for the point source sensitivity (where it is limited by discrete sources), particularly for the case of rapid fading in which the source counts rise slowly with decreasing flux. NASA's mission concept Generation-X has a goal resolution of 0.1 arcsec and 100 m2 of collecting area yielding a photometric sensitivity of ∼2.2 × 10⁻²⁰ erg s−1 cm−2 at 0.1–10 keV.5 This resolution would certainly avoid confusion due to faint quasars, even for the slow fading model where there are many faint foreground sources confusing the detection of sources at z≳ 5.
With the proposed sensitivity of Generation-X, unobscured BHs more massive than around a few × 1000 M⊙ would be detectable out to redshifts approaching 15 (see Fig. 11). Detection of the seeds of SMBHs is one of the prime science goals of Generation-X. The number of detectable objects at z∼ 6–15 will obviously depend on the masses of seed BHs and the growth history of BHs at very high redshifts.
In Fig. 10 we compare the predicted number of detectable sources for the rapid fading merger-driven model (solid line) to the passive evolution models with fduty= 0.1 (dotted line) and fduty= 1.0 (dot–dashed line) for three values of the point source sensitivity. The left-hand panel shows the evolution in the density of sources with fluxes above the sensitivity goal of Generation-X. The space density of observable sources at z∼ 15 depends very sensitively on the model assumed. The FOV of Generation-X is expected to be at least (5 arcmin)2, with fields as big as (15 arcmin)2 considered in the design study (Windhorst et al. 2006). Here we assume the FOV of Generation-X is the same as for XEUS for ease of comparison. For the merger-driven model, with a minimum active BH mass of ∼3 × 10⁴M⊙ we predict significant numbers of sources, still around 10 per FOV, out to z= 15. The situation is even more promising if the BHs are evolving passively with a small duty cycle, with up to ∼100 sources per field up to z= 15. If the BHs are evolving rapidly there is still more than one source per field out to z∼ 11, but the density drops very rapidly with increasing redshift for a scenario in which all BHs are growing via accretion at their Eddington limit. At the goal sensitivity of XEUS, the maximum redshift at which there is one source predicted per FOV also varies widely; ranging from z∼ 8 for continuous growth to z∼ 15 for slowly growing BHs.
6 SUMMARY AND CONCLUSIONS
We have presented a hybrid model for the redshift evolution of the X-ray emission connected with the fuelling of SMBHs with the aim of assessing the prospects of detecting quasars via their X-ray emission at z > 6. At z≲ 2 we have used the observed X-ray luminosity functions, at 2 < z < 6 we have adopted a CDM merger-driven model for the evolution of the emission from SMBHs combined with a slow and a rapid fading law and we have explored a range of assumptions for the growth of SMBHs at z > 6.
For appropriate choices for the efficiency of BH formation in a dark matter halo and the characteristic quasar lifetime, our model is in good agreement with the observed optical and soft and hard X-ray QLFs at 0 < z < 6 for both the slow and the rapid fading law. The only disagreement that occurs is for the faint end of the X-ray luminosity functions where our merger model combined with the slow fading model suggested by Hopkins et al. (2005a) based on detailed numerical simulations predicts too many faint objects. It consequently also overpredicts the soft X-ray background suggesting that the slow fading model of Hopkins et al. (2005a) cannot extend to BH masses much below 107M⊙. With a more rapid fading law our models are well within the limits of the integrated CXRB, leaving room for the population of star-forming galaxies expected at low flux densities, and the population of Compton-thick sources needed to explain the overall spectral shape of the CXRB.
The main aim of our study is to assess the prospects of planned and proposed X-ray missions like Constellation-X, XEUS and Generation-X to study the build-up of BHs at z > 6. With a point source sensitivity of 3 × 10⁻¹⁷ erg s−1 cm−2 for a 1-Ms exposure, Constellation-X will detect significant numbers of BHs at z∼ 5–6 but will probably not yet reach the necessary sensitivity to detect significant numbers of sources at z > 6. This conclusion holds independently of our assumptions for the growth of BHs at z > 6. For XEUS with its anticipated 10 times superior point source sensitivity, the prospects for detecting sources at z > 6 is much more favourable. Up to 17 per cent of the approximately 100 sources in the 49-arcmin2 FOV expected for the rapid fading model with a minimum active BH mass of ∼3 × 10⁴M⊙ are expected to be at z > 6. If our merger-driven model can be extrapolated to z > 6 or if BHs grew with a duty cycle of about 10 per cent, XEUS would detect significant numbers of BHs with a rather flat redshift distribution out to z∼ 10. In either case, observable X-ray emission would have to accompany the growth of SMBHs starting from seed BHs of ≳104M⊙ or smaller. For the more remote prospect of Generation-X, with an anticipated point source sensitivity yet a factor of 100 better again, the flat redshift distribution could extend to z∼ 15 and beyond.
If BHs grew much faster at z > 6 as in our Eddington-limited growth model with a duty fraction of unity, which would be required for Eddington-limited growth of the most massive BHs from stellar mass seed BHs, neither XEUS nor Generation-X would detect many BHs at z≳ 10. However, while such rapid growth may occur and may indeed be necessary for the most massive BHs at z∼ 6, it appears unlikely that this will be the norm for the majority of BHs. The prospects that XEUS (and Generation-X) will unravel the growth history of BHs at z > 6 and beyond are thus excellent.
ftp://ftp.xray.mpe.mpg.de/people/bol/xeus/XEUS_150108.pdf.
KJR was supported by an Overseas Research Scholarship, the Cambridge Australia Trust, the School of Physics, University of Melbourne and an EARA visiting post-graduate scholarship hosted by MPA during the course of this work. We would like to thank the referee for a detailed and helpful report.
REFERENCES
