


Abstract
We present photometric and spectroscopic data of the peculiar SN 2005la, an object which shows an optical light curve with some luminosity fluctuations and spectra with comparably strong narrow hydrogen and helium lines, probably of circumstellar nature. The increasing full width at half-maximum velocity of these lines is indicative of an acceleration of the circumstellar material. SN 2005la exhibits hybrid properties, sharing some similarities with both Type IIn supernovae and 2006jc-like (Type Ibn) events. We propose that the progenitor of SN 2005la was a very young Wolf–Rayet (WN-type) star which experienced mass ejection episodes shortly before core collapse.
1 INTRODUCTION
The interest of the astronomical community has been recently caught by a few very luminous supernovae (SNe) that have exploded within dense, massive and pre-existent circumstellar media. Some of them have been spectroscopically classified as Type IIn SNe (SNe IIn; Schlegel 1990) because of the presence of prominent narrow (about 1000 km s−1) H Balmer emission lines (e.g. SN 2006gy, Smith et al. 2007; Ofek et al. 2007; SN 2007bw, Antilogus et al. 2007). For a few other events (e.g. SN 1999cq, Matheson et al. 2000; SN 2006jc, Foley et al. 2007; Pastorello et al. 2007a,2008), whose spectra show relatively narrow He i emission lines (∼2000 km s−1), a different nomenclature was coined: Type Ibn SNe (Pastorello et al. 2007a, 2008). In the spectra of these objects, the narrow H lines are much weaker than the He i features, or completely missing.
In addition, a number of regular Type IIn SNe have developed at some stages clear evidence of narrow (from a few ×100 km s−1 to ∼2000 km s−1) He i lines although, contrary to SNe Ibn, they are always less prominent than Hα. This group includes SN 1978K (Chugai, Danziger & Della Valle 1995), SN 1987B (Schlegel et al. 1996), SN 1988Z (Stathakis & Sadler 1991; Turatto et al. 1993; Aretxaga et al. 1999), SN 1995G (Pastorello et al. 2002), SN 1995N (Fransson et al. 2002; Pastorello et al. 2005; Zampieri et al. 2005), SN 1996L (Benetti et al. 1999), SN 1997ab (Hagen, Engels & Reimers 1997), SN 1997eg (Salamanca, Terlevich & Tenorio-Tagle 2002), SN 1998S (Gerardy et al. 2000; Leonard et al. 2000; Liu et al. 2000; Fassia et al. 2001; Anupama, Sivarani & Pandey 2001). In all these SN events, the narrow lines (both of H and of He i) are thought to originate in a slowly moving circumstellar medium (CSM) which is photoionized either by early UV flux or by interaction with the SN ejecta.
A number of authors (Kotak & Vink 2006; Gal-Yam et al. 2007; Smith et al. 2007) suggest that a significant fraction of SNe IIn might be produced by the explosion of massive luminous blue variable (LBV) stars, even if the nature of at least some of Type IIn events is still debated (e.g. SN 2002ic and similar events; see Hamuy et al. 2003; Benetti et al. 2007; Prieto et al. 2007; Trundle et al. 2008, and references therein). As an alternative view, Woosley, Blinnikov & Heger (2007) propose a pair-instability pulsation scenario as a trigger of major mass ejection episodes. The ejecta collide with the material expelled by the star in previous eruptions converting large amounts of kinetic energy into radiation and generating a Type IIn SN.
Type Ibn SNe seem to be connected with WR progenitors whose He envelope is almost completely stripped away, and that explode while they are still embedded within the He-rich material (Foley et al. 2007; Pastorello et al. 2007a,2008; Tominaga et al. 2007; Immler et al. 2008; Smith, Foley & Filippenko 2008). Pastorello et al. (2007a) showed that SN 2006jc was preceded by a giant outburst 2 yr before core collapse. Although the SN itself suggests a WC star progenitor, the outburst had similar characteristics to an LBV eruption.
In Pastorello et al. (2008, Paper I of this series), the common properties of objects similar to SN 2006jc (SNe Ibn) are discussed. In Paper III (Mattila et al. 2008), we investigate the origin of the strong infrared excess observed in SN 2006jc. In this paper (Paper II), we describe the observed characteristics of the unusual SN 2005la, an object whose spectra show simultaneously narrow H and He i features, with the most prominent He i lines having comparable strength (at least at early stages) as Hα, and showing unusual evolution with time. We propose that SN 2005la is a transitional object lying somewhere between the newly defined SNe Ibn and more classical Type IIn events.
2 AN UNPRECEDENTED SUPERNOVA
SN 2005la was discovered in the spiral galaxy KUG 1249+278 by RMQ and PM on behalf of the Texas Supernova Search.1 The unfiltered discovery images were obtained on November 30.51 and December 1.49 ut with the 0.45-m ROTSE-IIIb telescope at the McDonald Observatory, in which the SN appeared to be at a magnitude of about 17.6 (Puckett et al. 2005). The coordinates of the new object were RA  , Dec.
  (equinox 2000.0; uncertainty +/− 0.8 arcsec), 6 arcsec W and 6 arcsec S of the centre of the host galaxy. The field of KUG 1249+278 with SN 2005la is shown in Fig. 1, where five reference stars are also labelled.
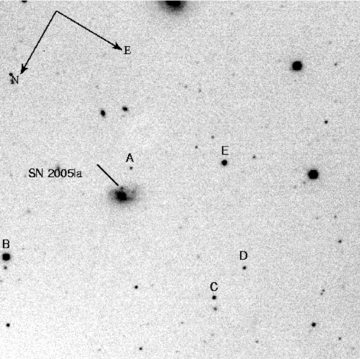
The field of SN 2005la with the local sequence of stars labelled with capital letters.
SN 2005la is hosted in an Sc-type galaxy, with total apparent B-band magnitude 16.67 ± 0.50 (HyperLeda data base).2 The distance to SN 2005la can be determined from the recession velocity of the host galaxy, which is derived from the position of the narrow Hα emission line of a nearby H ii region (vrec= 5570 km s−1;Filippenko, Foley & Matheson 2005). It is estimated to be about 78.5 Mpc (obtained adopting H0= 71 km s−1Mpc−1), providing a distance modulus of μ= 34.47. Assuming a negligible Galactic extinction (see below), we obtain for KUG 1249+278 a total absolute magnitude MB≈−17.8. The host galaxy of SN 2005la is therefore a relatively faint spiral, similar to the galaxies hosting SNe 2006jc and 2002ao (HyperLeda; see also Prieto, Stanek & Beacom 2008). An average metallicity estimate for KUG 1249+278 can be obtained via the best fit of the luminosity–metallicity relation of Tremonti et al. (2004). This provides 12 + log (O/H) = 8.53 ± 0.16 (dex) for the above-estimated galaxy absolute magnitude. We can adopt this value as only an upper limit for the oxygen abundance at the SN location, because we presume there are some abundance gradients throughout KUG 1249+278 (although probably rather modest due to the characteristics of the host galaxy). Interestingly, the derived abundance is very similar to those estimated for three (out of four)3 SNe Ibn analysed in Pastorello et al. (2008).
Filippenko et al. (2005), on the basis of a spectrum obtained on December 3 ut with the Keck II 10-m telescope (+ DEIMOS), classified this SN as a peculiar Type II/Ib event, having weak and narrow H and He i lines with P Cygni profiles, but dominated by the component in emission. The line velocity derived from both the position of the absorption component minimum and the full width at half-maximum (FWHM) of the emission component was about 1700–1800 km s−1.
The low signal-to-noise ratio spectra of SN 2005la (see Section 4) do not allow us to provide reliable estimates for the extinction within the host galaxy. However, SN 2005la has quite a peripheral location and the extinction suffered by the SN is expected to be rather small. Schlegel, Finkbeiner & Davis (1998) provide a very small value for the Galactic extinction in the direction of the SN, being E(B−V) = 0.011 mag. This value will be adopted throughout the paper as an estimate of the total extinction.
3 LIGHT AND COLOUR CURVES
Most of our data are unfiltered CCD images obtained by the Texas Supernova Search team (Quimby 2006), using a 0.45-m ROTSE-IIIb robotic telescope at the McDonald Observatory, which is one of the four telescopes of the ROTSE collaboration4 used for the optical monitoring of γ-ray burst (GRB) afterglows. Additional unfiltered points were obtained with the ROTSE-IIId telescope of the Turkish National Observatory of Bakirlitepe (Turkey). Both ROTSE-IIIb and ROTSE-IIId have Marconi CCDs covering a very large field (1.85 × 1.85 deg2). Deep reference images (limiting magnitude ∼21) were obtained combining with a median filter several frames acquired during the period between 2004 December 15 and 2005 January 16. The SN magnitudes were computed after subtracting the reference images and then rescaled to the R-band magnitudes using a sequence of stars from the USNO-B1.0 catalogue. Since SN 2005la exploded quite close (7.5 arcmin) to a fifth magnitude star (LS Com), the SN photometry was marginally affected by the presence of wings of light of this luminous source. More detail on the techniques used to derive the ROTSE-III magnitudes can be found in Quimby et al. (2007a).
Additional multicolour photometry was obtained using the 1.82-m Copernico Telescope of Mt Ekar (Asiago, Italy) equipped with AFOSC and the 2-m Liverpool Telescope (La Palma, Canary Islands) with RATCAM. The data reduction steps were performed with standard techniques (see e.g. Pastorello et al. 2007b), using iraf tasks. The SN magnitudes were obtained with the point spread function (PSF) fitting technique after the subtraction of galaxy templates obtained on 2007 February. The instrumental SN magnitudes were calibrated using standard fields by Landolt (1992), and then checked (and, if necessary, rescaled) with reference to a sequence of five stars in the SN vicinity (Fig. 1 and Table 1). The photometric data of SN 2005la are reported in Table 2.
Sequence of local standards in the field of KUG 1249+278. The errors reported in brackets are the rms of the derived average magnitudes.
| Star | B band | V band | R band | I band |
| A | 19.96 (0.01) | 19.64 (0.01) | 19.34 (0.01) | 18.32 (0.01) |
| B | 15.63 (0.01) | 14.79 (0.01) | 14.22 (0.01) | 13.86 (0.01) |
| C | 19.92 (0.02) | 18.61 (0.01) | 17.87 (0.01) | 17.16 (0.02) |
| D | 21.46 (0.04) | 19.93 (0.02) | 18.83 (0.01) | 17.57 (0.01) |
| E | 16.94 (0.01) | 16.26 (0.02) | 16.00 (0.01) | 15.58 (0.02) |
Photometry of SN 2005la, including the most significant detection limits.
| Date | JD | Days since maximum | B band | V band | R band | I band | Instrument |
| 2005 Nov 19 | 245 3693.62 | −0.9 | >17.50 | ROTSE-IIId | |||
| 2005 Nov 19 | 245 3693.99 | −0.5 | >16.75 | ROTSE-IIIb | |||
| 2005 Nov 20 | 245 3694.99 | +0.5 | >17.17 | ROTSE-IIIb | |||
| 2005 Nov 21 | 245 3695.99 | +1.5 | 17.33 (0.08) | ROTSE-IIIb | |||
| 2005 Nov 22 | 245 3696.99 | +2.5 | 17.39 (0.10) | ROTSE-IIIb | |||
| 2005 Nov 23 | 245 3697.99 | +3.5 | 17.42 (0.09) | ROTSE-IIIb | |||
| 2005 Nov 29 | 245 3704.00 | +9.5 | 17.68 (0.08) | ROTSE-IIIb | |||
| 2005 Nov 30 | 245 3705.01 | +10.5 | 17.59 (0.09) | ROTSE-IIIb | |||
| 2005 Dec 01 | 245 3705.60 | +11.1 | 17.52 (0.13) | ROTSE-IIId | |||
| 2005 Dec 01 | 245 3705.99 | +11.5 | 17.53 (0.08) | ROTSE-IIIb | |||
| 2005 Dec 02 | 245 3706.99 | +12.5 | 17.55 (0.07) | ROTSE-IIIb | |||
| 2005 Dec 03 | 245 3707.99 | +13.5 | 17.64 (0.08) | ROTSE-IIIb | |||
| 2005 Dec 04 | 245 3708.99 | +14.5 | 17.72 (0.09) | ROTSE-IIIb | |||
| 2005 Dec 05 | 245 3709.59 | +15.1 | 17.73 (0.11) | ROTSE-IIId | |||
| 2005 Dec 05 | 245 3709.99 | +15.5 | 17.78 (0.11) | ROTSE-IIIb | |||
| 2005 Dec 06 | 245 3710.59 | +16.1 | 17.78 (0.10) | ROTSE-IIId | |||
| 2005 Dec 06 | 245 3711.00 | +16.5 | 17.85 (0.10) | ROTSE-IIIb | |||
| 2005 Dec 07 | 245 3711.99 | +17.5 | 17.87 (0.09) | ROTSE-IIIb | |||
| 2005 Dec 09 | 245 3713.58 | +19.1 | 17.73 (0.10) | ROTSE-IIId | |||
| 2005 Dec 09 | 245 3713.99 | +19.5 | 17.76 (0.09) | ROTSE-IIIb | |||
| 2005 Dec 10 | 245 3714.58 | +20.1 | 18.07 (0.12) | ROTSE-IIId | |||
| 2005 Dec 10 | 245 3714.70 | +20.2 | 18.66 (0.10) | 18.28 (0.05) | 18.12 (0.05) | 17.90 (0.07) | AFOSC |
| 2005 Dec 10 | 245 3714.99 | +20.5 | 18.13 (0.16) | ROTSE-IIIb | |||
| 2005 Dec 11 | 245 3715.57 | +21.1 | 18.13 (0.16) | ROTSE-IIId | |||
| 2005 Dec 12 | 245 3716.58 | +22.1 | 18.20 (0.24) | ROTSE-IIId | |||
| 2005 Dec 13 | 245 3717.56 | +23.1 | >18.06 | ROTSE-IIId | |||
| 2005 Dec 17 | 245 3721.95 | +27.5 | >18.19 | ROTSE-IIIb | |||
| 2005 Dec 19 | 245 3723.95 | +29.5 | >18.38 | ROTSE-IIIb | |||
| 2005 Dec 20 | 245 3724.96 | +30.5 | >18.35 | ROTSE-IIIb | |||
| 2005 Dec 23 | 245 3727.62 | +33.1 | 19.90 (0.07) | AFOSC | |||
| 2005 Dec 23 | 245 3727.64 | +33.1 | 20.33 (0.08) | 19.90 (0.05) | 19.70 (0.10) | 19.38 (0.10) | AFOSC |
| 2005 Dec 24 | 245 3728.78 | +34.3 | 20.39 (0.20) | 19.94 (0.10) | 19.79 (0.20) | 19.47 (0.12) | RATCAM |
| 2005 Dec 27 | 245 3731.95 | +37.5 | >18.78 | ROTSE-IIIb | |||
| 2005 Dec 31 | 245 3735.94 | +41.4 | >19.29 | ROTSE-IIIb | |||
| 2006 Jan 03 | 245 3738.60 | +44.1 | >20.99 | 20.57 (0.18) | 20.21 (0.29) | 20.01 (0.31) | RATCAM |
| 2006 Jan 06 | 245 3741.92 | +47.4 | >19.61 | ROTSE-IIIb | |||
| 2006 Jan 07 | 245 3742.92 | +48.4 | >19.57 | ROTSE-IIIb | |||
| 2006 Jan 10 | 245 3745.99 | +51.5 | >19.32 | ROTSE-IIIb | |||
| 2006 Jan 22 | 245 3757.70 | +63.2 | >22.39 | RATCAM | |||
| 2006 Jan 24 | 245 3759.87 | +65.4 | >19.43 | ROTSE-IIIb | |||
| 2006 Jan 30 | 245 3765.69 | +71.2 | >22.98 | >22.96 | 21.85 (0.19) | >21.85 | RATCAM |
| 2006 Mar 01 | 245 3795.74 | +101.2 | >19.38 | ROTSE-IIIb | |||
| 2006 Mar 25 | 245 3819.76 | +125.3 | >19.48 | ROTSE-IIIb | |||
| 2006 Apr 30 | 245 3855.77 | +161.3 | >19.66 | ROTSE-IIIb | |||
| 2006 May 24 | 245 3879.77 | +185.3 | >19.50 | ROTSE-IIIb | |||
| 2006 Jun 16 | 245 3902.72 | +208.2 | >19.03 | ROTSE-IIIb |
Although the first ROTSE-IIId pre-discovery observation at Julian Date (JD) = 245 3693.62 is not very deep, it provides a magnitude limit of R= 17.5, which is about 0.2 mag fainter than the first, real detection. This is an indication that the SN was probably still rising in luminosity. This limit, although not very stringent (see Table 2), is useful to constrain the epoch of the first maximum light, with an uncertainty of a couple of days. However, because of the non-monotonic behaviour of the light curve of SN 2005la at later phases, we cannot exclude the existence of further, earlier luminosity peaks and, as a consequence, we cannot definitively constrain the explosion epoch. However, the relatively blue colour of the early spectra (Section 4) suggests that the SN was discovered rather young. Throughout this paper, we will adopt JD = 245 3694.5 ± 1.5 as an indicative epoch of maximum light.
The R-band absolute light curves of SNe 2005la, 1999cq (Matheson et al. 2000) and 2006jc (Foley et al. 2007; Pastorello et al. 2007a) are compared in Fig. 2 with that of the Type IIn SN 1994W (Sollerman, Cumming & Lundqvist 1998; Chugai et al. 2004). For computing the absolute light curves of SN 2006jc and SN 1999cq, we used the same parameters as reported in Table 1 of Pastorello et al. (2008). The light curves of SN 2005la and SNe Ibn have a very rapid luminosity evolution compared with SN 1994W, which shows a sort of plateau lasting about three months, followed by a very steep luminosity decline. Other SNe IIn, e.g. SN 1988Z (Aretxaga et al. 1999) and SN 1995G (Pastorello et al. 2002), show even more slowly evolving light curves, without any evidence of a significant luminosity drop over time-scales of a few years.
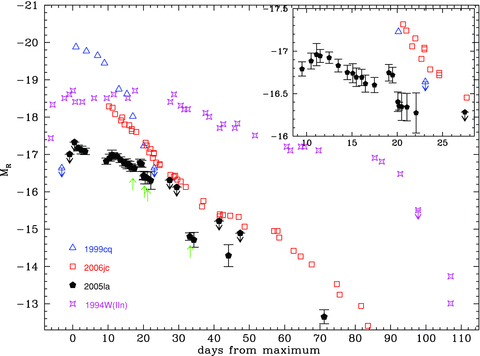
R-band light curve of SN 2005la compared with those of the Type Ibn SNe 2006jc and 1999cq (Matheson et al. 2000; Foley et al. 2007; Pastorello et al. 2007a,2008), and the Type IIn SN 1994W (unfiltered, V- and R-band photometry from Sollerman et al. 1998). Remarkably, SN 2005la shows a non-monotonic luminosity decay. Unfiltered ROTSE-III magnitudes from the Texas Supernova Search have been scaled to the R-band magnitudes. The most significant ROTSE-III limits are also reported. A blow-up of the same light curves between 8 and 28 d is also shown (top-right insert). Green arrows also mark the phases of the spectra of SN 2005la presented in this paper.
A large luminosity deficit at the optical wavelengths at late phases can be attributed either to an extremely low amount of 56Ni synthesized by the SN explosion or, alternatively, to an increase in the extinction as a result of new dust being produced by the SN. A consequence is that increased emission at infrared wavelengths can be expected, as a result of absorption and re-radiation of the SN light by dust grains. Interestingly, SN 2006jc developed a strong excess at near-infrared (NIR) wavelengths (Arkarov et al. 2006; Di Carlo et al. 2007; Sakon et al. 2007; Mattila et al. 2008; Smith et al. 2008), with a simultaneous rapid decline of the optical light curves. Condensation of dust in the ejecta of a few core-collapse SNe has been observed at late times (see Meikle et al. 2007, and references therein). Furthermore, for the Type IIn SN 1998S it was suggested that after 300 d new dust condensed in a cool, dense shell (CDS) produced by the impact of the SN ejecta with a dense CSM (Pozzo et al. 2004). A similar mechanism also occurred in SN 2006jc, but producing new dust at a much earlier epoch than in the case of SN 1998S (see discussion in Smith et al. 2008; Mattila et al. 2008). As in the case of SN 2006jc, newly condensed CDS dust might be responsible for the rapid decline of the optical light curves seen also in other SNe Ibn (including SN 2005la). However, due to the lack of NIR observations, it is impossible to verify if a strong IR excess is a common characteristic of all these events.
Although the rapid decline of the light curve of SN 2005la is similar to SN 2006jc, the overall luminosity evolution is substantially different. With the adopted scale in phase, its luminosity peak, MR=−17.2, is fainter (by about 1 mag) than that of SN 2006jc, and its R-band light curve has a non-monotonic behaviour. In fact, after the initial post-discovery decline, the light curve shows at least one secondary maximum at about 12 d post-discovery. Moreover, a further, luminosity peak is possibly visible at the phase of ∼3 weeks, although we cannot definitely exclude this as being an artefact due to measurement errors. However, it is remarkable that before and after this apparent peak, the spectra evolve significantly, showing broader spectral lines and less evident P Cygni absorptions (see Section 4). This may indicate new, stronger episodes of ejecta–CSM interaction. After that, for about two months (between phase of 20 and 80 d), the R-band magnitude decline is very pronounced (ΔMR∼ 4.2 mag).
In Fig. 3, the B−I and B−V colour curves of SN 2005la are shown, together with those of the Type Ibn SNe 2000er, 2002ao and 2006jc. Unfortunately, except for SN 2006jc, the colour information for SNe Ibn is incomplete. However, from the available data, the B−I colour evolves in a similar fashion in all SNe Ibn, with very little colour evolution during the first two months (B−I always ranges between 0 and 0.3 mag). However, while in SN 2006jc B−V remains between −0.3 and −0.1 during the first couple of months, SN 2002ao has a significantly redder B−V colour, probably due to the presence of more prominent emission features in the V- and R-band regions (see Fig. 4 of Pastorello et al. 2008). On the other hand, SN 2000er roughly follows the B−V colour evolution of SN 2006jc. Unfortunately, the colour evolution of SN 2005la is not well sampled. Nevertheless, three to four weeks after maximum, this SN appears to be significantly redder (B−I≈ 0.9; B−V≈ 0.4) than any Type Ibn SN.
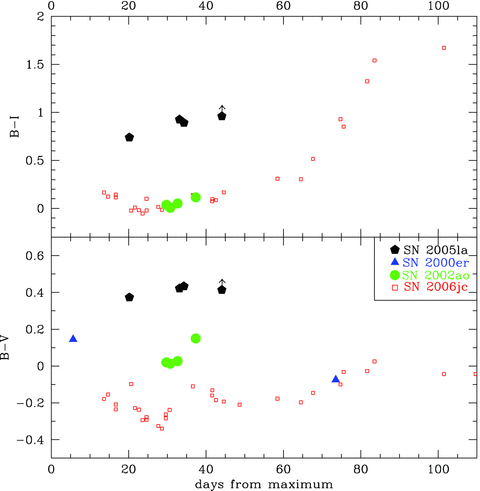
B−I (top) and B−V (bottom) colour curves of SN 2005la, compared with those of a few Type Ibn SNe. We remark that the B−I colour is less affected by the flux contamination of the narrow He i circumstellar lines than the B−V colour. Differences in the intensity of the He i circumstellar lines may explain why SNe Ibn show a very similar B−I colour evolution, but, simultaneously, rather different B−V colours. The amount of interstellar extinction adopted for the SNe Ibn sample is the same as in Table 1 of Pastorello et al. (2008).
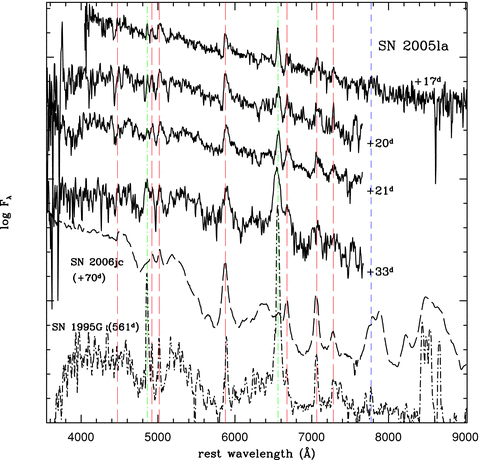
Spectroscopic evolution of SN 2005la. A spectrum of the Type Ibn SN 2006jc (Pastorello et al. 2007a) at a phase of 70 d and a very late spectrum of the Type IIn SN 1995G (phase 561 d; Pastorello et al. 2002) are also shown as a comparison. Vertical red dashed lines mark the position of the main He i features, while the dot–dashed green lines mark the rest wavelength position of Hα and Hβ. The blue dashed line marks the position of the OI 7774 AA feature. All spectra are at the host galaxy rest wavelength.
While any colour information is missing for SN 2005la at about two months after maximum, SNe Ibn become much redder (see Fig. 3 top, reaching B−I≈ 1.6 one month later). This is because starting from approximately two months past maximum, the contribution in flux at the blue wavelengths decreases significantly in Type Ibn SNe, while a cooler blackbody component due to dust is responsible for the flux excess at the red wavelengths (at least in SN 2006jc; see Smith et al. 2008; Mattila et al. 2008).
4 SPECTRA
The very rapid evolution of SN 2005la and its moderate apparent luminosity prevented us from performing extensive spectroscopic monitoring, and only four spectra were collected. The first spectrum was obtained with the 9.2-m Hobby–Eberly Telescope (HET) of the McDonald Observatory (University of Texas), equipped with the Marcario Low-Resolution Spectrograph (LRS) on December 7. Additionally, three spectra were obtained later using the 1.82-m Copernico Telescope with AFOSC. More information on the four spectra is reported in Table 3, while the complete spectral sequence is shown in Fig. 4.
Basic information of the spectra of SN 2005la.
| Date | JD | Phase (d) | Instrumental configuration | Integration time (s) | Range (Å) | Resolution (Å) |
| 2005 December 07 | 245 3711.5 | 17.0 | HET+LRS+G1 | 1200 | 4150–9200 | 17 |
| 2005 December 10 | 245 3714.8 | 20.3 | A1.82+AFOSC+gm4 | 1690 | 3600–7800 | 25 |
| 2005 December 11 | 245 3715.7 | 21.2 | A1.82+AFOSC+gm4 | 7200 | 3600–7800 | 25 |
| 2005 December 23 | 245 3727.8 | 33.3 | A1.82+AFOSC+gm4 | 6610 | 3550–7800 | 24 |
In Fig. 4, the spectra of SN 2005la are also compared with a spectrum of the Type Ibn SN 2006jc at phase +70 d (Pastorello et al. 2007a) and a very late spectrum of the Type IIn SN 1995G (Pastorello et al. 2002). This comparison highlights a rough similarity between the spectra of SN 2005la (especially at 20–21 d after the discovery) and that of SN 2006jc. However, Hα is prominent in SN 2005la (although much weaker than in SN 1995G). Its Hα is comparable with the most prominent He i lines (i.e. λ5876 and λ7065) at early epochs and is stronger than the He i lines only in the last spectrum. Fig. 5 shows the evolution of the profiles of Hβ (+He iλ4921), He iλ5876 and Hα at three selected epochs. The relative strengths of the H and He i lines may change as a result of abundance and, possibly, ionization effects. The latter is mostly expected in objects whose ejecta are interacting with a CSM.
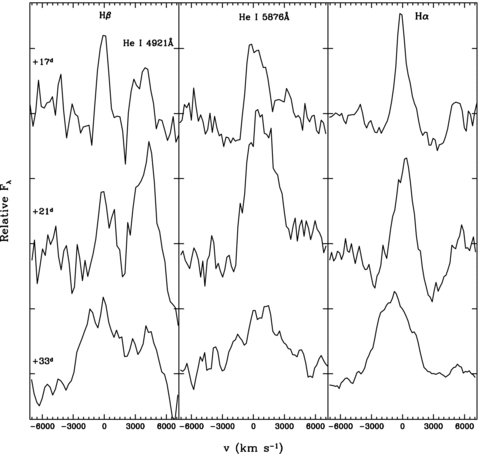
Evolution of the profile of individual H and He i lines.
Unlike SN 2005la, the spectrum of SN 2006jc shows a very weak (practically invisible) Hα during the first three months (Foley et al. 2007; Pastorello et al. 2007a). This line becomes more prominent only at very late epochs (Smith et al. 2008; Pastorello et al. 2008; Mattila et al. 2008). Instead, in Type IIn SNe, a narrow (typically with FWHM velocities vFWHM≤ 1000 km s−1) Hα dominates in strength at any phase over the He i lines.
In Table 4, we report the velocities of SN 2005la as derived from measuring the FWHM of a number of lines (H and He i). While the He i lines show a clear P Cygni profile, this is not obvious for the H lines. The velocities derived from the position of the P Cygni minima of the He i lines are quite consistent (∼2000–2200 km s−1, see also Table 4) with the vFWHM of the same lines. We find that in the December 7 spectrum, the vFWHM derived for the H lines is about 1500 km s−1, while it is slightly higher for the He i lines (vFWHM≈ 2150 km s−1). These lines are probably produced in an unshocked CSM surrounding the SN. Once the SN ejecta reach the CSM, this material is expected to accelerate. A bump near 7800 Å is tentatively identified as a proper SN ejecta feature, probably O iλ7774. The low signal-to-noise ration does not allow us to properly measure the velocity of this feature, but (despite the uncertainty) it is significantly higher (vFWHM= 4900 ± 1200) than the other lines identified in the December 7 spectrum. This velocity can be considered as representative for the ejecta velocity.
FWHM velocities for the strongest H and He i lines in the spectra of SN 2005la. The expansion velocities derived from the position of the P Cygni minima of a few lines are also reported, labelled with letters, below the table.
| Date | Phase (d) | Hα (km s−1) | Hβ (km s−1) | He iλ4922 (km s−1) | He iλ5876 (km s−1) | He iλ6678 (km s−1) | He iλ7065 (km s−1) |
| 2005 December 07 | 17.0 | 1550 ± 170 | 1480 ± 110 | 2140 ± 240 | 2160 ± 250(a) | 2020 ± 480(b) | 2160 ± 200 |
| 2005 December 10 | 20.3 | 1970 ± 490 | 3160 ± 400 | 3100 ± 990 | 3120 ± 740 | ||
| 2005 December 11 | 21.2 | 1950 ± 360 | 1870 ± 270 | 3160 ± 400 | 3140 ± 380(c) | 3150 ± 480 | |
| 2005 December 23 | 33.3 | 4200 ± 260 | 4170 ± 640 | 4190 ± 460 | 4140 ± 670 | 4150 ± 990 |
(a)2170 ± 210.
(b)1960 ± 310.
(c)3210 ± 250.
The two subsequent spectra (December 10 and 11) show that the line velocities are increasing (vFWHM≈ 1900 km s−1 for the H lines; vFWHM≈ 3150 km s−1 for the He lines), indicating an evident acceleration of the He- and, more marginally, of the H-rich CS region. In the last spectrum of SN 2005la, obtained about two weeks later, all lines are in pure emission (see Fig. 5), as expected when driven by the high-energy radiation resulting from the interaction of the ejecta with the dense CSM close to the SN. Moreover, the velocity of both the H and He i lines is much higher, being vFWHM≈ 4200 km s−1, which is close to that estimated for the O I λ7774 line. No extended wings are observed for the emission features, as one would expect if the line broadening was a result of scattering of photons of the narrow lines by the thermal electrons of the circumstellar gas (as was observed in SN 1998S; Chugai et al. 2001).
It is remarkable that the absorption features in the region between 4600 and 5200 Å (possibly due to Fe ii lines and detected with comparable widths also in SNe Ib/c), the overall blue colour and the drop of the flux beyond 5400 Å seem to be common characteristics of most interacting core-collapse SNe (Fig. 4).
5 SEARCHING FOR MAJOR PRE-SN OUTBURSTS
SN 2005la shows clear evidence of the presence of CSM produced by the precursor star before the SN explosion. The SN spectra indicate that this material is rich in both H and He. However, there are some spectroscopic indications that the inner CSM is more He-rich, while H is more abundant in more external regions of the CSM. From the available data, it is very difficult to understand if this material was produced through a dense, continuum wind or via major outburst episodes similar to those observed in a number of LBVs (or, alternatively, in luminous outbursts of WR stars analogous to the transient UGC 4904-V1 which preceded by two years the explosion of SN 2006jc; see Pastorello et al. 2007a).
Up to now, it was commonly accepted that core-collapse explosions occur substantially (∼ a few times 105 yr) after the last major mass-loss episode. However, the precedent of SN 2006jc should give impulse to the efforts of finding evidence for similar luminous outbursts occurring only a few years before the explosion of interacting core-collapse SNe. Unfortunately, the host galaxy of SN 2005la was not frequently monitored in the past, and very few images are currently available in public archives. We analysed B- and Sloan r-band images of KUG 1249+278 (with exposure times of 3 × 300 s and 600 s, respectively) obtained on 2002 March 10 with the 2.5-m Isaac Newton Telescope in La Palma (Canary Islands, Spain). The data have been downloaded from the Isaac Newton Group (ING) archive.5 Another set of images was obtained making use of the SMOKA6 science archive. The host of SN 2005la was observed at the 1.05-m Schmidt Telescope of the Kiso Observatory (University of Tokyo, Japan) on 2003 March 11 (4 × 300 s and 3 × 300 s in the V and R bands, respectively). Finally, the Texas SN Search has intensively (almost daily) monitored the region of KUG 1249+278 (from 2004 November 20 to 2005 July 7), but no evidence of pre-SN outbursts was found (Fig. 6). This is not really unexpected since the deepest magnitude limits registered for the ROTSE-IIIb telescopes are near magnitude 20. With the assumptions on the distance and extinction discussed in Section 2, only outbursts more luminous than MR∼−14.5 would be detected, which is an absolute magnitude very close to the brightest eruptions reported in Fig. 6, and only ∼2.7 mag fainter than the peak magnitude registered for SN 2005la. Therefore, the analysis of the pre-explosion images does not provide any useful information on the mass-loss processes that occurred in the last years of life of the progenitor of SN 2005la.
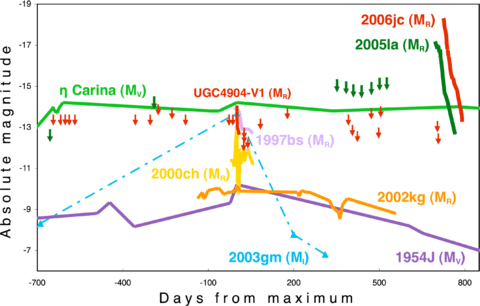
Pre-SN detection limits and R-band absolute light curve of SN 2005la compared with several well-known outbursts of LBVs and the LBV-like transient UGC 4904-V1 which occurred two years before the explosion of SN 2006jc (its light curve is also shown in the figure). The phases are relative to the LBV outburst maximum light. The figure is similar to that shown in Pastorello et al. (2007a, see references therein) with, in addition, pre- and post-explosion data of SN 2005la. Lacking the detection of a giant outburst preceding SN 2005la, the pre-SN detection limits and the light curve of SN 2005la are shown in an arbitrary temporal scale.
6 WHAT WAS SN 2005la?
The spectroscopic properties of SN 2005la, especially the peculiar intensity ratio between Hα and the most prominent He i lines (λ5876 and λ7065), suggest that this object could be classified as lying somewhere between the classical Type IIn SNe (Schlegel 1990) and the Type Ibn events (Pastorello et al. 2007a,2008). However, the rapidly evolving light curve of SN 2005la and the very fast decline of the optical luminosity (see Fig. 2) are more typical for the family of SN 2006jc.
There now appears to be strong observational evidence that normal Type II-P SNe have red supergiant progenitors which have fairly moderate initial masses (Smartt et al. 2004; Li et al. 2007). It is interesting to note that there are no discoveries of any red supergiants with masses definitely more than 20 M⊙. The case of the blue supergiant exploding as SN 1987A is still not well understood from the stellar evolutionary point of view, but binarity is the most likely explanation (Podsiadlowski 1992). Hence, one might conjecture that higher mass stars explode as some other type of event.
There is a reasonable probability that Wolf–Rayet (WR) stars of type WN and WC/O are the direct progenitors of at least some SNe Ib and Ic. Recent modelling of the light curves of Type Ic SNe has yielded ejecta masses (C and O dominated) that have some overlap with the core masses of WC stars determined from luminosity measurements and stellar evolutionary models. For example, ejecta masses of 2.5–5 M⊙ for SN 2002ap (Mazzali et al. 2002) and 3.5–8 M⊙ for SN 2004aw (Taubenberger et al. 2006) were determined, while Crowther et al. (2002) suggest masses of 7–19 M⊙ for WC stars in the Large Magellanic Cloud (LMC) and the Galaxy. While these mass ranges just about overlap, the fact that the explosion of SN 2002ap was asymmetric and lack of a large sample of SN Ib/c ejecta or progenitor mass estimates still leaves open the question of the origins of these events.
There is also mounting evidence that Type Ib/c SNe are associated with environments which show stronger Hα emission and have higher surface brightness than do the environments of Type II-P SNe (James & Anderson 2006; Kelly, Kirshner & Pahre 2008). This would suggest the progenitors are more likely from higher mass stars, and hence above 15–20 M⊙. Although rather unexpectedly, the spatial Type Ib SN distribution of Kelly et al. (2008) resembles the Type II SN distribution. There is one possible detection of a Type IIn SN progenitor, that of SN 2005gl (Gal-Yam et al. 2007), although the object is exceptionally bright for a single star and it remains uncertain if it is actually one of the most luminous stars that can exist, a very high mass LBV or if it is actually an unresolved stellar cluster.
In the case of the Type IIn SN 2005gl, the ejecta started to interact early with the material likely lost through major eruptions a short time before the explosion of the star. From this point of view, there is a remarkable analogy with the sequence of events that led to SN 2006jc in UGC 4904, as a luminous pre-SN outburst followed two years later by the real SN explosion (Itagaki et al. 2006; Pastorello et al. 2007a). In such a case, if the precursor of SN 2006jc was a single massive star, it was responsible for the outburst observed on 2004 October (Pastorello et al. 2007a), in which a significant amount of material was likely expelled. SN 2006jc was monitored in detail for several months after 2006 October, and the spectra showed relatively narrow He i emission lines, indicating that the SN ejecta were interacting with a slower moving He-rich CSM. As a consequence, the 2004 luminous outburst was probably produced by a WR star transiting between the WN and WC/O phases (e.g. Foley et al. 2007; Tominaga et al. 2007). Perhaps, all precursor stars of the interacting Type Ibn SNe are rare objects (Pastorello et al. 2008) which lie in the region between more typical WN and WC/O stars (which should produce SNe Ib and SNe Ic, respectively). One might draw a parallel between this argument and that used to relate the LBV progenitors of SNe IIn to the RSG/BSG progenitors of non-interacting SNe II.
In this context, SN 2005la is unique, because it shares properties with both SNe IIn and SNe Ibn. Hence, we suggest that SN 2005la might have been produced by the explosion of a star which was transiting from the LBV to the WR (WN-type) phase. From the analysis of the SN properties, the young WN precursor of SN 2005la should have suffered a major mass-loss episode (or possibly several episodes) a few years before the SN explosion. One would expect that during these episodes a significant amount of He-rich material (with residual H) was lost. The detection of outbursts similar to that seen for SN 2006jc and other similar SNe would be an exciting discovery as it would hint that the instability may be directly related to the imminent core collapse. Unfortunately, the analysis of the available pre-SN archive images for SN 2005la (see Section 5) does not provide any direct confirmation for this scenario, although, of course, it does not exclude it. Wide field transient searches which sample low-mass and hence low-metallicity galaxies are the obvious way forward to discover more of these peculiar and interesting SNe. For example, the blank-field strategy of the Texas Supernova Search has discovered a large number of peculiar SNe (e.g. the weird SN 2005ap; Quimby et al. 2007b). The future Pan-STARRS project (Young et al. 2007) will have the capability of increasing these discoveries further and more extensive monitoring of the events will help to shed light on the post-main-sequence evolution of the most massive stars.
A similar low-metallicity value was not found in the case of the host galaxy of the Type Ibn SN 1999cq, for which a significantly higher oxygen abundance was computed, i.e. 12+log(O/H) ≈ 9.3 ± 0.2 (Pastorello et al. 2008). However, abundance gradients throughout the galaxy were not taken into account in that estimate, and in such a luminous spiral galaxy they are expected to be relatively large.
SM acknowledges financial support from the Academy of Finland (project: 8120503). The paper is based on observations collected at the 0.45-m ROTSE-IIIb robotic telescope and the Hobby–Eberly Telescope at the McDonald Observatory (University of Texas), the 0.45-m ROTSE-IIId robotic telescope of the Turkish National Observatory (Bakirlitepe, Turkey), the Copernico 1.82-m Telescope of the INAF-Asiago Observatory (Mt Ekar, Italy) and the Liverpool Telescope (La Palma, Spain). We thank the ROTSE collaboration, the Hobby–Eberly Telescope staff, particularly B. Roman, V. Riley and S. Rostopchin, and the support astronomers of the Liverpool Telescope for performing the observations of SN 2005la.
This paper makes use of data obtained from the Isaac Newton Group Archive which is maintained as part of the CASU Astronomical Data Centre at the Institute of Astronomy, Cambridge. This work is also based in part on data collected at the Kiso observatory (University of Tokyo) and obtained from the SMOKA science archive, which is operated by the Astronomy Data Centre, National Astronomical Observatory of Japan. This research has made use of the NASA/IPAC Extragalactic Data base (NED) which is operated by the Jet Propulsion Laboratory, California Institute of Technology, under contract with the National Aeronautics and Space Administration. We acknowledge the usage of the HyperLeda data base (http://leda.univ-lyon1.fr).
REFERENCES
