


Abstract
We present photometry on 23 Jupiter Family Comets (JFCs) observed at large heliocentric distance, primarily using the 2.5-m Isaac Newton Telescope (INT). Snapshot images were taken of 17 comets, of which five were not detected, three were active and nine were unresolved and apparently inactive. These include 103P/ Hartley 2, the target of the NASA Deep Impact extended mission, EPOXI. For six comets we obtained time-series photometry and use this to constrain the shape and rotation period of these nuclei. The data are not of sufficient quantity or quality to measure precise rotation periods, but the time-series do allow us to measure accurate effective radii and surface colours. Of the comets observed over an extended period, 40P/Väisälä 1, 47P/Ashbrook-Jackson and P/2004 H2 (Larsen) showed faint activity which limited the study of the nucleus. Light curves for 94P/Russell 4 and 121P/Shoemaker-Holt 2 reveal rotation periods of around 33 and 10 h, respectively, although in both cases these are not unique solutions. 94P was observed to have a large range in magnitudes implying that it is one of the most elongated nuclei known, with an axial ratio a/b≥ 3. 36P/ Whipple was observed at five different epochs, with the INT and ESO's 3.6-m NTT, primarily in an attempt to confirm the preliminary short rotation period apparent in the first data set. The combined data set shows that the rotation period is actually longer than 24 h. A measurement of the phase function of 36P's nucleus gives a relatively steep β= 0.060 ± 0.019. Finally, we discuss the distribution of surface colours observed in JFC nuclei, and show that it is possible to trace the evolution of colours from the Kuiper Belt Object (KBO) population to the JFC population by applying a ‘dereddening’ function to the KBO colour distribution.
1 INTRODUCTION
The study of short period comets has recently benefited from the successful spacecraft missions to 19P/Borrelly (Soderblom et al. 2002), 81P/ Wild 2 (Brownlee et al. 2004) and 9P/Tempel 1 (A'Hearn et al. 2005), which provided a wealth of information on these nuclei. The Rosetta spacecraft is on its way to 67P/Churyumov-Gerasimenko (Schwehm & Schulz 1998) and will provide another great leap by studying the nucleus in detail while orbiting around it. However, these missions provide great detail on only individual nuclei, and have themselves demonstrated the great differences between the comets visited. We therefore wish to study a far larger population of cometary nuclei, in order to better understand what they have in common, and which features vary between them.
Sending space missions to a larger fraction of the cometary population is clearly impractical, and too expensive to seriously consider. Instead, we seek to measure the bulk properties of many nuclei using ground-based telescopic observations. Although the activity of comets masks the nucleus when they are bright and near the Sun, it is possible to observe Jupiter Family Comets (JFCs) when they are closer to aphelion (and apparently inactive) using 2–4 m class telescopes.
A number of groups have used this method to take ‘snapshot’ observations of distant nuclei, allowing measurement of their brightness and therefore, assuming an albedo, their sizes (Licandro et al. 2000; Lowry, Fitzsimmons & Collander-Brown 2003; Meech, Hainaut & Marsden 2004). We have expanded upon this by taking time-series observations of JFC nuclei; by obtaining light curves, constraints on the size, shape and bulk density of the nuclei can be measured. We also take multifilter photometry in order to study the surface colours of nuclei. The first results of this work are given by Snodgrass, Fitzsimmons & Lowry (2005b) and Snodgrass, Lowry & Fitzsimmons (2006) (hereafter Paper I and Paper II, respectively).
In this paper we present the results of observations (or attempted observations) of 23 comets. Section 3 gives the results of further snapshots obtained on comets that were not followed over an extended period, while Section 4 gives the results of the time-series observations. We observed comet 36P/ Whipple (hereafter 36P) on three separate occasions, and the results from this large data set are described in Section 5. Section 6 discusses our findings in terms of results for other comets, draws conclusions about the population of JFCs as a whole, and compares JFCs with Kuiper Belt Objects (KBOs), the supposed parent population for JFCs. Finally, Section 7 summarizes all of our results.
2 OBSERVATIONS AND DATA REDUCTION
The data presented were taken using three different telescopes over five observing runs of varying lengths. A log of all the observations is given in Table 1. The majority of the data were taken with the 2.5-m Isaac Newton Telescope (INT) at the Roque de Los Muchachos observatory on the island of La Palma.
Log of all observations.
| Comet | ut date | Telescope | rH (au)a | Δ (au) | α (°) | Nexp× filterb | texp (s) | Appearancec |
| 8Pd | 01/07/05 | INT | 7.42I | 6.76 | 6.3 | 13 ×r′ | 95 | S |
| 36P | 05/03/05 | NTT | 4.08O | 3.39 | 11.0 | 5 × R, V, I | 200 | S* |
| 06/03/05 | NTT | 4.08O | 3.41 | 11.2 | 17 × R, V, I | 200 | S* | |
| 01/03/06 | INT | 4.78O | 3.79 | 1.0 | 63 ×r′, 10 ×V, 10 ×i′ | 150 | S | |
| 02/03/06 | INT | 4.78O | 3.79 | 1.0 | 55 ×r′, 5 ×V, 5 ×i′ | 75 | S | |
| 12/01/07 | NTT | 5.14O | 4.94 | 11.0 | 6 ×R, 2 ×V | 220 | S | |
| 26/02/07 | NTT | 5.17O | 4.35 | 6.7 | 84 ×R, V | 120 | S | |
| 27/02/07 | NTT | 5.17O | 4.34 | 6.5 | 8 ×R | 120 | S | |
| 18/07/07 | NTT | 5.23O | 5.45 | 10.7 | 5 ×R, 2 ×V | 100 | S | |
| 40P | 01/07/05 | INT | 4.57O | 3.68 | 7.0 | 8 ×r′ | 85 | S* |
| 02/07/05 | INT | 4.57O | 3.68 | 6.8 | 15 ×r′, V, i′ | 85 | S* | |
| 03/07/05 | INT | 4.58O | 3.68 | 6.6 | 7 ×r′, V, i′ | 85 | S* | |
| 04/07/05 | INT | 4.58O | 3.68 | 6.4 | 20 ×r′, V, i′ | 85 | S* | |
| 05/07/05 | INT | 4.59O | 3.67 | 6.2 | 17 ×r′, V, i′ | 85 | S* | |
| 06/07/05 | INT | 4.59O | 3.67 | 6.0 | 20 ×r′, 2 ×V, 2 ×i′ | 85 | S* | |
| 07/07/05 | INT | 4.60O | 3.67 | 5.7 | 18 ×r′, 2 ×V, 2 ×i′ | 85 | S* | |
| 44P | 01/03/06 | INT | 4.51I | 3.84 | 10.1 | 2 ×r′ | 300 | F |
| 02/03/06 | INT | 4.50I | 3.83 | 10.0 | 3 ×r′, 3 ×V, 3 ×i′ | 170 | S | |
| 47P | 01/03/06 | INT | 5.11I | 4.45 | 8.9 | 2 ×r′ | 300 | S* |
| 02/03/06 | INT | 5.11I | 4.43 | 8.8 | 3 ×r′, 3 ×V, 3 ×i′ | 170 | S* | |
| 56P | 01/03/06 | INT | 3.83O | 3.14 | 11.8 | 3 ×r′, 2 ×V | 520 | A |
| 02/03/06 | INT | 3.83O | 3.15 | 12.0 | 5 ×r′, V, i′ | 260 | A | |
| 70P | 01/07/05 | INT | 4.84I | 4.26 | 10.6 | 6 ×r′ | 295 | F |
| 72P | 02/03/06 | INT | 3.28O | 2.35 | 7.1 | 5 ×r′ | 50 | N |
| 75P | 02/07/05 | INT | 4.95I | 3.94 | 1.7 | 3 ×r′ | 75 | N |
| 78P | 02/03/06 | INT | 3.84O | 2.86 | 1.8 | 3 ×r′ | 60 | A |
| 94P | 04/07/05 | INT | 4.14O | 3.19 | 5.6 | 14 ×r′, V, i′ | 75 | S |
| 05/07/05 | INT | 4.14O | 3.18 | 5.3 | 20 ×r′, 3 ×V, 2 ×i′ | 75 | S | |
| 06/07/05 | INT | 4.14O | 3.18 | 5.1 | 26 ×r′, 2 ×V, 2 ×i′ | 75 | S | |
| 07/07/05 | INT | 4.15O | 3.18 | 4.9 | 23 ×r′, 2 ×V, 2 ×i′ | 75 | S | |
| 103P | 01/03/06 | INT | 5.03O | 4.30 | 8.3 | 2 ×r′, V, i′ | 200 | A |
| 02/03/06 | INT | 5.03O | 4.29 | 8.1 | r′, V, i′ | 110 | A | |
| 104P | 05/03/05 | NTT | 3.06O | 2.31 | 13.8 | 2 × R | 80 | N |
| 114P | 04/07/05 | INT | 3.75I | 2.95 | 10.9 | 8 ×r′ | 90 | S |
| 120P | 02/03/06 | INT | 3.89O | 3.05 | 8.8 | 5 ×r′ | 115 | F |
| 121P | 01/03/06 | INT | 3.92O | 3.43 | 13.5 | 4 ×r′, V, i′ | 400 | S |
| 02/03/06 | INT | 3.93O | 3.42 | 13.4 | 18 ×r′, V, i′ | 215 | S | |
| 31/05/06 | FTN | 4.18O | 3.34 | 8.6 | 14 ×R, 3 ×V | 60 | S | |
| 131P | 02/03/06 | INT | 3.48O | 2.65 | 10.1 | 3 ×r′, 3 ×V | 105 | S |
| 135P | 02/03/06 | INT | 3.55I | 2.65 | 7.5 | 5 ×r′ | 80 | N |
| 160P | 02/03/06 | INT | 3.98O | 3.41 | 12.5 | 3 ×r′ | 140 | F |
| P/1995 A1 | 02/07/05 | INT | 5.52I | 4.71 | 6.9 | 8 ×r′ | 135 | S |
| 2006 BZ8e | 02/03/06 | INT | 2.32I | 1.35 | 7.1 | 15 ×r′, 3 ×V, 3 ×i′ | 10 | S |
| P/2004 H2 | 01/07/05 | INT | 3.70O | 3.06 | 13.6 | 14 ×r′ | 210 | S* |
| 02/07/05 | INT | 3.70O | 3.06 | 13.4 | 19 ×r′, V, i′ | 210 | S* | |
| 03/07/05 | INT | 3.71O | 3.05 | 13.3 | 14 ×r′, V, i′ | 210 | S* | |
| 04/07/05 | INT | 3.71O | 3.04 | 13.1 | 16 ×r′, 2 ×V, i′ | 210 | S* | |
| 05/07/05 | INT | 3.71O | 3.03 | 12.9 | 14 ×r′, 4 ×V, 2 ×i′ | 210 | S* | |
| 06/07/05 | INT | 3.72O | 3.02 | 12.7 | 10 ×r′, 6 ×V, 3 ×i′ | 210 | S* | |
| 07/07/05 | INT | 3.72O | 3.02 | 12.6 | 11 ×r′, 4 ×V, 2 ×i′ | 210 | S* | |
| P/2004 H3 | 05/07/05 | INT | 3.71O | 2.97 | 12.0 | 6 ×r′ | 90 | F |
| P/2004 T1 | 02/03/06 | INT | 3.82O | 2.86 | 3.9 | 5 ×r′ | 60 | N |
| P/2001 X2 | 02/07/05 | INT | 5.02I | 4.02 | 2.4 | 2 ×r′ | 80 | N |
a Superscripts ‘I’ and ‘O’ refer to whether the comet is inbound (pre-perihelion) or outbound (post-perihelion). The variations in Rh, Δ and α over the course of any one night were smaller than the significance quoted here. bThe number of exposures Nexp in each filter in the final data set: frames rejected during reduction/analysis are not counted. cAppearance: S – stellar, A – active, N – not detected, F – detected but too faint to determine whether or not activity was present: these are assumed to be inactive. S* indicates that faint activity was later detected despite a stellar appearance. dNote that 8P/Tuttle is not a JFC, but a nearly isotropic comet with a short period; it has an inclination of ∼ 55° and TJ= 1.6. e2006 BZ8 was observed to search for activity in this newly discovered object, which has a comet-like (TJ=−1) orbit. None was found.
The INT was used during two runs. The first was in 2005 July, on seven nights (July 1–7) around the time of the Deep Impact mission's encounter with 9P/Tempel 1. The telescope was being used to follow the evolution of the dust coma and tails of this comet before and after the impact (Jones et al. 2005; Lowry et al. 2005), but was available during the later half of each night after 9P had set. Conditions were excellent and all seven nights were photometric; time-series data were collected on three comets [40P/Vaisala 1, 94P/Russell 4 and P/2004 H2 (Larsen)] and snapshot observations were made of seven others. The telescope was used again between 2006 February 27 and March 2, during which the first two nights were lost due to severe winter weather. The third night was clear but non-photometric, while the 4th night was photometric with periods of excellent seeing [the full width at half-maximum (FWHM) of the image point spread function (PSF) varied between 0.8 and 2.7 arcsec, with a median of 1.1 arcsec]. Time-series observations of comets 36P/ Whipple and 121P/Shoemaker-Holt 2 were obtained, and snapshots were taken of 12 other objects.
The imager on the INT is the Wide Field Camera (WFC) which is mounted at the primary focus. The WFC is a mosaic of four thinned EEV 2048 × 4096 pixel CCDs, which has a pixel scale of 0.33 arcsec pixel−1 and a total field of view of 34 arcmin on a side. The wide field nature of the camera is not necessary for this work, and only one element of the multi-extension fits file is used to minimize the reduction workload. In the 2006 data this mostly corresponds to the central CCD 4, while the comets were centred on CCD 3 in the 2005 data as the telescope pointing had been offset to make use of the full width of the WFC mosaic in observing 9P's tails. Even the single CCD has a field of view of 11.5 × 23 arcmin2, which gives the advantage of having a constant set of comparison stars over two nights for all but the fastest moving comets, allowing light curves to be fully differential with no uncertainties from night to night calibration. Also, by a fortuitous coincidence, comets 44P/Reinmuth 2 and 47P/Ashbrook-Jackson were close together on the sky during the 2006 February/March run, and the wide field of the WFC allowed both to be observed simultaneously giving ‘two for the price of one’. 44P fell on CCD 1 and 47P fell on CCD 2. The filters used were the Harris V and Sloan r′ and i′. The Sloan filters have the advantage of having sharp cut-on and cut-offs with little overlap in sensitivity at wavelengths between the bands, although further reduction steps are required as the i′ band has significant fringing which had to be subtracted from the data manually for each frame, as pipelines or automated routines failed to measure the fringe brightness correctly.
We used the 3.6-m New Technology Telescope (NTT) at the European Southern Observatory's La Silla site on the nights of 2005 March 5–7. This telescope, the EMMI instrument used, the run and the associated data reduction are described in Paper II, where the majority of results from it were published. The data taken on 36P during that run were not included in Paper II as it is more sensibly grouped with the other observations of this comet described here. The NTT and EMMI were also used in the third time-series on 36P, taken on the nights of 2007 February 26 and 27. The conditions were clear, with seeing measured in the images between 0.6 and 1.3 arcsec, with a median of 0.8 arcsec FWHM.
The fifth set of observations was carried out using the 2.0-m robotic Faulkes Telescope North (FTN). We used approximately 1 h on 2006 May 31 to perform follow-up observations on comet 121P/Shoemaker-Holt 2, which INT observations had shown to be brighter than expected and showing evidence of having only recently ceased outgassing (see Section 4.4), to search for any sign of continuing activity. The comet was imaged in the Bessell R band using the DillCam CCD imager, which has a single 2048 × 2048 pixel CCD with a pixel scale of 0.278 arcsec pixel−1 in the default 2 × 2 binning mode, giving a 4.6 × 4.6 arcmin2 field of view. Frames were also taken of the comet through the Bessell V band, and of standard stars through both bands, to allow for photometric calibration.
The reduction for the NTT, FTN and 2006 INT data and photometry on all frames were performed using standard iraf tasks as described in Papers I and II. The 2005 INT data were reduced (along with the 9P data taken during the run) using the Wide Field Survey pipeline1; inspection of data from each run showed that both reduction methods gave equally good results.
 . The full calibrated comet magnitude is then given by
It is important to note that while the calibration on to standard magnitude scales is necessary for comets in different star fields, and to allow calculation of absolute magnitudes and colours for the objects, searching for periodicity can be done just as well using differential light curves. Where possible the differential light curve is preferred as it contains no sources of error beyond the photometric measurement uncertainties, allowing optimum measurement of the relative variation of brightness with time.
3 RESULTS FROM SNAPSHOT IMAGING
‘Snapshot’ images of all potential target comets were taken. There are three possible outcomes from imaging of comets; the comet is either undetected, unresolved or active. Here we present the snapshot data divided into three sections according to these appearance categories. Undetected comets are either simply too faint to see, in which case upper limits on the size are found, or confused with background sources, in which case very little information can be obtained. Unresolved comets are detected and appear as point sources, and may be interpreted as being bare nuclei, depending on evaluation of the contamination by dust comae. Those which appeared to be unresolved, bright and well separated from background stars were followed as time-series (see Section 4); results on the remainder are presented here. Active comets have resolvable coma in individual images; limits are placed on the level of activity and the size of the nucleus. All these results are summarized in Table 2.
Derived values and limits on radii and activity from snapshot photometry.
| Comet | mR | mca | mR (1, 1, 0) | rN (km) | Afρ (cm)b |
| Undetected | |||||
| 72P | ≥23.0 | – | ≥18.3 | ≤0.6 | ≤0.45 |
| 75P | – | – | – | – | – |
| 135P | ≥23.5 | – | ≥18.4 | ≤0.6 | ≤0.88 |
| P/2001 X2 | – | – | – | – | – |
| P/2004 T1 | ≥23.6 | – | ≥18.3 | ≤0.6 | ≤0.57 |
| Unresolved | |||||
| 8P | 21.61 ± 0.03 | ≥25.1 (4.3 arcsec) | 12.88 ± 0.03 | 7.58 ± 0.12 | – |
| 44P | 22.49 ± 0.06 | ≥23.3 | 15.95 ± 0.06 | 1.84 ± 0.05 | ≤1.7 |
| 70P | 22.53 ± 0.15 | ≥23.9 | 15.59 ± 0.16 | 2.18 ± 0.15 | ≤23.7 |
| 114P | 22.95 ± 0.11 | ≥24.5 (4.0 arcsec) | 17.34 ± 0.11 | 0.97 ± 0.05 | ≤0.24 |
| 120P | 23.52 ± 0.13 | ≥23.1 | 17.84 ± 0.13 | 0.77 ± 0.05 | ≤2.9 |
| 131P | 22.77 ± 0.10 | ≥23.1 | 17.49 ± 0.10 | 0.87 ± 0.04 | ≤0.50 |
| 160P | 23.69 ± 0.18 | ≥28.0 (1.3 arcsec) | 17.58 ± 0.18 | 0.87 ± 0.07 | ≤4.7 |
| P/1995 A1 | 22.63 ± 0.07 | ≥22.1 | 15.31 ± 0.07 | 2.48 ± 0.08 | ≤5.7 |
| P/2004 H3 | 24.19 ± 0.21 | ≥24.6 (3.0 arcsec) | 18.55 ± 0.21 | 0.56 ± 0.06 | ≤0.69 |
| 2006 BZ8 | 16.88 ± 0.01 | ≥21.7 | 14.16 ± 0.01 | 4.22 ± 0.02 | ≤41.4 |
| Active | |||||
| 56P | 20.73 ± 0.04 | – | ≥14.90 | ≤3.00 | 22.2 ± 0.3 |
| 78P | 19.42 ± 0.01 | – | ≥14.16 | ≤4.21 | 18.2 ± 0.2 |
| 103P | 21.00 ± 0.05 | – | ≥14.04 | ≤4.45 | 47.2 ± 0.7 |
a Coma magnitude within ρ= 5 arcsec (unless stated otherwise) measured using equation (2). bAfρ measured through an aperture of radius 5 arcsec.

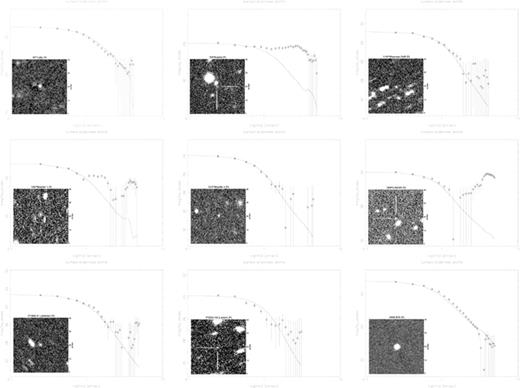
Images and surface brightness profiles for unresolved snapshot targets. From the top left-hand side, these are 8P, 70P, 114P, 120P, 131P, 160P, P/1995 A1, P/2004 H3 and the Damocloid 2006 BZ8. Notes: 70P– this is a single 295-s r′-band frame; in subsequent frames the comet moved towards the two stars and was not separable from them. The profile shows the effect of the nearby star; no sensible constraints on the activity level of this comet can be made. 114P– taken on 2005 July 4, a sum of 8 × 90-s r′-band frames. The background stars are trailed in this image as it has been corrected for the comet's motion; with only eight frames it was not possible to construct a good background image to subtract the stars. The profile is inactive in the inner part, although dominated by sky noise and the star trails in the outer section. 120P– taken on 2006 March 2, which is seen to be very faint, but distinguishable from the trailed stars in this combination of four r′-band frames. The star trails give two additional peaks in the profile at larger ρ, although the inner 1 arcsec implies a bare nucleus. 131P– as a faint but star-like source in a combination of three frames taken on 2006 March 2. The profile is in agreement with the image PSF within the error bars, implying that the comet was inactive. 160P– which was detected at a very faint level, even in this combined image of three 140-s r′-band frames taken on 2006 March 2. The profile appears stellar in the inner part, but is confused with a background galaxy in the outer part. P/1995 A1– which was recovered on 2005 July 2 returning to the inner Solar system 10 yr after it was last observed. The orbit is accurate, as the predicted motions allowed the eight frames to be combined to give a star-like comet image (with trailed background stars). The profile matches the PSF, even in the outer noisy part, except at ρ≈ 5 arcsec where flux from the nearby star trail raises the measured surface brightness. P/2004 H3– taken on 2005 July 5, in which the comet is just detectable as a very faint point source among the trailed stars. The profile is noisy due to the extreme faintness of the comet, but is consistent with an inactive nucleus. 2006 BZ8– this Damocloid asteroid was observed on 2006 March 2 and was bright in individual 10-s exposures, and is clearly stellar in this combination of all 15 r′-band exposures. The profile confirms this.
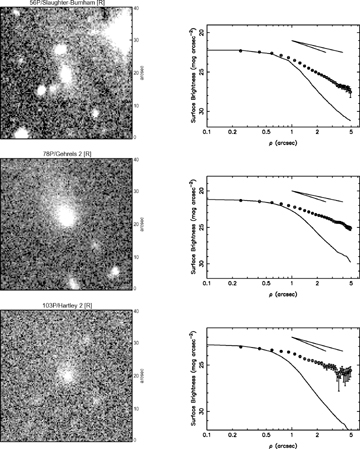
Images and surface brightness profiles for 56P, 78P and 103P. The comets are visibly active. The solid diagonal lines in the top right-hand corner of each profile show gradients of −1 and −1.5, from two theoretical models of steady state coma; the comets all have profiles with gradients ∼−1.5.


3.1 Undetected comets
3.1.1 72P/Denning-Fujikawa
The radius of comet 72P/Denning-Fujikawa was unknown before the observations were obtained therefore we could not reliably predict its brightness. Five r′-band exposures were taken, giving a total exposure time of 250 s, but the comet was not detected, even in a combined image. Historically, this comet has proved elusive. It was first discovered in 1881 October, but lost until a chance recovery during a close pass to the Earth in 1978, which was linked to the earlier comet despite it being unobserved during any of the 10 intervening apparitions.2 Subsequent attempts to recover the comet during its 1987, 1996 and 2005 apparitions have failed; the non-detection reported here continues this trend. Lamy et al. (2004) quote an unpublished radius estimate from the updated catalogue of Tancredi et al. of 0.8 km, but it is far from clear what data this estimate is based on. If it were true, then this radius implies a predicted mR= 22.4 at the time of the INT run, which should have been just detectable.
There are three likely interpretations of this non-detection; first, the orbit could be incorrect, and in fact Denning in 1881 and Fujikawa in 1978 discovered two different comets. Assuming that this is not the case, the alternative explanations are that the comet has ceased to exist (i.e. broken up) since 1978, or that it is a very small nucleus that exhibits little outgassing near perihelion, and has consequently escaped detection despite numerous attempts. If the comet exists, and was in the predicted position, then the fact that no object was observed to mR≥ 23.0 implies an absolute magnitude for this comet of mR(1, 1, 0) ≥ 18.3 and therefore rN≤ 0.6 km.
3.1.2 75P/Kohoutek and P/2001 X2 (Scotti)
Both 75P/Kohoutek and P/2001 X2 (Scotti) were observed during the 2005 INT run at right ascension 18h–19h and declination ∼−20°, which unfortunately placed them in the galactic plane [galactic coordinates (l, b) ≈ (10, 0)–(20, −10)]. This meant that both were observed against a dense star field, making identification of the comets difficult. For P/2001 X2 this was exacerbated by the loss of one of the frames taken due to a malfunction in the CCD camera, leaving only two r′-band frames. It proved impossible to identify either comet, even with the aid of astrometric predictions of their precise positions within these fields. As there is a high likelihood of the comet being blended with one of the stars within the predicted area it is also impossible to constrain the brightness of the comets other than to say that they must be considerably fainter than the field stars, but this does not put meaningful limits on the radius as for any sensible size the comet would fit this constraint: for 75P the stars in the search area have magnitudes in the range mR≈ 14.5–20.5, while the comet is expected to have mR≥ 22.8 based on a limit of rN≤ 1.6 km (Lowry et al. 2003),3 from a non-detection in 1999.
3.1.3 135P/Shoemaker-Levy 8
135P/Shoemaker-Levy 8 was inbound at Rh= 3.6 au at the time of the 2006 INT run, on its way to perihelion at 2.7 au in 2007 May, although it has yet to be recovered (as of 2007 July 11). The comet was not detected in any of the five 80-s r′-band exposures or in a combined frame. There is no object at the position given by an astrometric fit to mR≥ 23.5, giving a limit to the absolute magnitude of mR(1, 1, 0) ≥ 18.4 and therefore a radius of rN≤ 0.6 km.
3.1.4 P/2004 T1 (LINEAR-NEAT)
P/2004 T1 (LINEAR-NEAT) was discovered in 2004 September before passing through perihelion at 1.7 au in 2004 November. It was last observed outbound in 2005 March, and was still outbound at 3.8 au during 2006 February/March. No further information has been recorded on this comet. 5 × 60-s r′-band exposures were taken, but the comet was not detected. An astrometric fit and measurement of a limiting magnitude of mR≥ 23.6 imply mR(1, 1, 0) ≥ 18.3 and rN≤ 0.6 km.
3.2 Unresolved comets
3.2.1 8P/Tuttle
The results from the snapshot observations of 8P/Tuttle obtained during the 2005 July INT run are presented here, although they are not included in the analysis of the ensemble properties of ecliptic comets. 8P is an unusual comet; by the ‘classical’ definition, it is a JFC, as it has an orbital period less than 20 yr (P= 13.5 yr); however, on dynamical grounds it is a nearly isotropic comet (see Levison 1996), as it has a Tisserand parameter with respect to Jupiter of TJ= 1.6, and has a Halley-like high-inclination (i= 55°) orbit. It therefore is likely to be an Oort cloud comet which has been captured into a shorter period orbit by interactions with the planets. It is also known to have a reasonably large (rN= 7.8 km) nucleus, from snapshot observations by Licandro et al. (2000), and was therefore predicted to be a bright target suitable for time-series observation at Rh= 7.4 au with the INT, providing an opportunity to add to the very few data on the rotational properties of Oort cloud comets. However, upon observation the target field was seen to be far too crowded for time-series observation, and attempts to observe the comet during this run were abandoned after only a short series of 13 r′-band frames. It was possible to separate the comet from background sources in the majority of frames; the average mR= 21.61 ± 0.03 is taken over the nine of these frames over which the magnitude of the comet was ∼ constant, with a brightening in the remaining four being attributed to proximity to a background star. This magnitude gives mR(1, 1, 0) = 12.88, corresponding to a radius of 7.58 ± 0.12 km, in excellent agreement with the value of Licandro et al. (2000).
3.2.2 44P/Reinmuth 2
A snapshot of 44P/Reinmuth 2 was published in Paper II. It was observed again during the 2006 INT run, when a total of five r′-band images were taken over the course of the two nights. The comet was detected on both nights, although was very faint in poor seeing on the first. The comet's magnitude was constant, within the error bars on each point, over the two nights at mR= 22.49 ± 0.06, and apparently inactive. The profile is consistent with the background PSF, within the error bars on each point, and equation (2) gives mc≥ 23.26, or ≤ 50 ± 72 per cent of the flux. The absolute magnitude was measured to be mR(1, 1, 0) = 15.95, implying rN= 1.84 ± 0.05 km, which is consistent with our previous measurement of rN= 1.96 ± 0.11 km. Colours of (V−R) = 0.31 ± 0.09 and (R−I) = 0.42 ± 0.13 were measured.
3.2.3 70P/Kojima
Lamy et al. (2004) quote measurements for 70P/Kojima from their own unpublished work, from a ‘partial rotational light curve’, although no indication is given of the quantity of data involved. Accordingly, their results (rN= 1.86 km, a/b≥ 1.1 and Prot≥ 22 h) are treated with caution, although the radius measurement can be taken at face value if regarded as a snapshot. Identification of the comet at the telescope was hampered by the faintness of the target and its proximity to a bright field star; only in the first frame was it sufficiently separated from the star to allow photometry. Even in this first frame a small amount of flux from the star may have been present within the aperture centred on the nucleus; the following radius should be considered to be an upper limit. The measured comet magnitude is mR= 22.53 ± 0.15, which corresponds to mR(1, 1, 0) = 15.59 and rN≤ 2.18 ± 0.15 km. Under the assumption that this is unaffected by star light, and taken with the radius measurement from Lamy et al., this implies a/b≥ 1.4, which is typical for JFCs. This is larger than the value of Lamy et al., but even if they did observe the full range in magnitudes in their partial light curve then a change of viewing angle could increase the range observed at a different epoch: light curves only give a minimuma/b when the orientation of the rotation axis is unknown. Based on both data sets, an average rN= 2.0 ± 0.2 km seems a reasonable value to assume for the size of 70P.
3.2.4 114P/Wiseman-Skiff
114P/Wiseman-Skiff was observed with the INT in 2005 July when inbound at 3.75 au, and was detected but at too faint a level to produce a reliable light curve. The combined image of all eight frames and corresponding profile show that the comet appeared inactive. The profile was only measurable to ρ= 4 arcsec, but gives mc= 24.45 and therefore a limit on the coma contribution of ≤ 25 ± 41 per cent, with the large error bars due to the noisy profile in the outer part. The measured mR= 22.95 ± 0.11 gives mR(1, 1, 0) = 17.34 and rN= 0.97 ± 0.05 km. This agrees with the assessment that the nucleus is a relatively small one from Lamy et al. (2004), who again quote their own unpublished result of rN= 0.78 ± 0.04, based on a Hubble Space Telescope (HST) snapshot when the comet was at Rh= 1.6 au and presumably active. Assuming that these two snapshots were taken at opposing light-curve extrema, then the minimum required axial ratio is a/b≥ 1.5, and the average effective radius is rN= 0.89 km.
3.2.5 120P/Mueller 1
Although not detectable in individual images, 120P/Mueller 1 was found in a co-added image of 4 × 115-s r′-band frames shifted to account for its predicted motion. The surface brightness profile for this comet matches the stellar PSF within the inner arcsecond, although beyond this there are two further peaks due to the nearby trails of background stars, making the formal limit of mc≥ 23.1 meaningless. The comet had mR= 23.52 ± 0.13 in the combined image. This gives mR(1, 1, 0) = 17.84 and rN= 0.77 ± 0.05 km. Assuming that this measurement is of the radius of the bare nucleus, it can be compared with the previous measurement of Lowry et al. (1999). They measured rN= 1.7 ± 0.2 with a snapshot of a star-like nucleus at Rh= 3.1 au, which at approximately twice the radius measured here is a large discrepancy; such disparate measurements would require a/b= 4.7 to be explained purely by the shape of the nucleus, which is rather high. It is possible that either there was a non-zero coma contribution in the Rh= 3.1 au measurement of Lowry et al. which was not present at 3.9 au, or the comet has a steeper than normal phase function/opposition surge (the observations of Lowry et al. were taken at  ). The unknown colour of the nucleus could also contribute, but only at a level similar to the uncertainty on mR. If 120P has a very red nucleus the difference in colour term between the R-band measurements of Lowry et al. and our r′-band measurements could cause the mR presented here to be up to a tenth of a magnitude too faint. It is likely that some combination of these factors, combined with a more modest elongation of the nucleus, is required to explain the differences between these measurements.
3.2.6 131P/Mueller 2
131P/Mueller 2 was outbound at 3.5 au when observed with the INT in 2006. Three r′-band frames were taken, and the comet was found and observed to have a faint, star-like appearance. The large error bars on the surface brightness at large ρ make the coma limit of mc≥ 23.1 (≤68 ± 94 per cent of the total flux) almost meaningless, but the profile appears star-like and the comet can be assumed to have been inactive. The average magnitude was mR= 22.77 ± 0.09, corresponding to an absolute magnitude of mR(1, 1, 0) = 17.59, and therefore a radius of rN= 0.87 ± 0.04 km. In addition, three V-band frames were taken, allowing measurement of the colour of the nucleus. A value of (V−R) = 0.45 ± 0.12 was obtained, which falls in the centre of the observed JFC distribution (see Section 6).
3.2.7 160P/LINEAR
Observations of 160P/LINEAR from the INT during 2006 detected the comet when outbound at ∼4 au. The comet appeared as a very faint but apparently inactive object in 3 × 140-s r′-band exposures. The presence of a nearby galaxy prevents measurement of limits on any coma, with mc(5 arcsec) = 22.6. The inner part of the profile is a good match for the background PSF; measuring the surface brightness at 1.3 arcsec gives mc≥ 28.0, ≤1.9 ± 5.8 per cent of the total flux. The measured value of mR= 23.69 ± 0.18 implies mR(1, 1, 0) = 17.58 and rN= 0.87 ± 0.07 km.
3.2.8 P/1995 A1 (Jedicke)
An attempt to detect the return of P/1995 A1 (Jedicke) was made in 2005 July with the INT, although the comet was still at Rh= 5.5 au. A faint object was discovered near the nominal position with an average mR= 22.63 ± 0.07. Measured in a combination of all eight r′-band frames, the comet's surface brightness profile appeared stellar in the inner region, although was dominated by sky noise beyond 2 arcsec, which is taken to show that it was inactive, as would be expected with the comet still beyond Jupiter's orbit. This implies a radius for the nucleus of rN= 2.48 ± 0.08, and an absolute magnitude of mR(1, 1, 0) = 15.31.
3.2.9 P/2004 H3 (Larsen)
P/2004 H3 (Larsen) was only at its second opposition when observed with the INT in 2005 July, having been discovered the previous April. It was at Rh= 3.7 au, outbound, and was only just recovered in a frame combining all six 90-s r′-band exposures. The measured magnitude, in the combined frame, was mR= 24.30 ± 0.21, implying that the nucleus is small, with mR(1, 1, 0) = 18.67 and a corresponding radius of rN= 0.53 ± 0.05 km. A profile is just measurable, but only within 3 arcsec, and is very noisy. Formally, the coma magnitude from equation (2) is mc≥ 24.6, implying a flux contribution of ≤ 80 per cent, although the error on this is also ∼80 per cent, making it of limited value. The profile matches the stellar PSF at all radii, within the error bars.
3.2.10 2006 BZ8
Observations of 2006 BZ8 were carried out to search for activity around this newly discovered object. It was regarded as being almost certainly a comet, with TJ=−1.0. No activity was observed though, and the object was bright (mR= 16.858 ± 0.003) and stellar. A surface brightness profile entirely matched the combined frame PSF, and equation (2) gave a limit on any coma at mc≥ 21.67, or ≤1.2 ± 1.2 per cent of the flux. 2006 BZ8 is officially a Centaur,4 as it has an orbital semimajor axis of a= 9.7 au; however, it seems likely that it is from the Oort cloud due to its Tisserand parameter and high inclination (i= 165°), and is better classified as a member of the Damocloid family (Jewitt 2005). The absolute magnitude was measured to be mR(1, 1, 0) = 14.14, corresponding to rN= 4.22 ± 0.02 km, and its colours were found to be (V−R) = 0.62 ± 0.01 and (R−I) = 0.36 ± 0.01. These results are not included in the discussion on the ensemble properties of JFCs in Section 6.
3.3 Active comets
3.3.1 56P/Slaughter-Burnham
56P/Slaughter-Burnham was discovered in 1958, and has previously been found to have rN= 1.56 km (Meech et al. 2004). This led to a predicted nuclear magnitude of mR= 22.1 at the time of the 2006 INT observations, and the comet was well placed for time-series observations at the beginning of the night. The comet was active at Rh= 3.8 au (outbound). The mean magnitude was mR= 20.73 ± 0.04, implying mR(1, 1, 0) ≥ 14.90 and rN≤ 3.00 km, in broad agreement with the measurement by Meech et al. (2004). The colours of the comet were measured to be (V−R) = 0.51 ± 0.05 and (R−I) = 0.35 ± 0.08, which fall in the observed range for nuclei, although it should be noted that these colours represent the colours of the coma, as the comet was active. These colours are similar to other measurements of the broad-band colours of dust comae (Lowry et al. 1999, 2003), and also appear to be in agreement with the trend of cometary dust to have more neutral (less red) colours at longer wavelengths, which is interpreted as showing that the dominant grains are larger than 1 μm in size (Jewitt & Meech 1986). It cannot be assumed that the coma has the same colour as the surface of the nucleus for highly active comets; even if the dust component is of similar composition, there is likely to be gas present also, especially in the V band. The flux within an aperture of ρ= 5 arcsec (≡11 400 km at the comet) gives Afρ= 22.3 ± 0.3 cm.
3.3.2 78P/Gehrels 2
Three r′-band frames were taken of 78P/Gehrels 2 during the 2006 INT run, which showed the comet to be clearly active when outbound at Rh= 3.8 au. Lowry & Weissman (2003) measured a radius of rN= 1.54 ± 0.12 km from a snapshot taken when the comet was at Rh= 5.5 au; the upper limit obtained here of rN≤ 4.21 km, from mR= 19.42 ± 0.01 and mR(1, 1, 0) ≥ 14.16, is consistent with this. The activity level, measured within ρ= 5 arcsec (≡10 400 km), was found to be Afρ= 18.2 ± 0.2 cm.
3.3.3 103P/Hartley 2
103P/Hartley 2 was observed to be highly active during the 2005 NTT run (see Paper II). It was observed again during the 2006 INT run, despite a strong suspicion that it may still be active at Rh= 5.0 au, as at the time this comet was a potential target for the Deep Impact extended mission, EPOXI.5 The comet was detected in two r′-band frames taken on the first night, and was clearly active. The measured mR= 21.00 ± 0.05 implies a radius upper limit of rN≤ 4.45 km (it is thought that the nucleus is actually much smaller; see Paper II), while the flux within ρ= 15 600 km gives Afρ= 47.2 ± 0.7 cm. The coma had colours of (V−R) = 0.16 ± 0.09 and (R−I) = 0.35 ± 0.08. The rather blue (V−R) measurement could reflect the presence of significant flux from gas emissions within the V band, such as the C2 bands at 5165 and 5635 Å, while the (R−I) colour is similar to that found for nuclei and dust comae.
4 TIME-SERIES PHOTOMETRY
Those comets which appeared (upon visual inspection at the telescope) to be inactive and reasonably bright were followed over an extended period in order to obtain a light curve. We assume that the variation in brightness is due to the nucleus being a rotating non-spherical body, and that the variation in reflected flux is due to the varying projected surface area. Here we follow the common practice of describing the nucleus as the simplest non-spherical shape: a triaxial ellipsoid with semi-axes a≥b=c. We therefore expect to see a double peaked light curve with a rotation period Prot twice the fitted Fourier period Pfitted. The Fourier method used to search for periodicities is described in Paper I; briefly, we search for minima in the range  in a reduced χ2 periodogram. ν is the number of degrees of freedom of the model, given by ν= (N− 3) where N is the number of data points, for a first order Fourier model.

Derived physical parameters and colours from time-series photometry on JFCs.
| Comet | mR | mca | mR (1, 1, 0) | rN (km) | Prot (h) | a/bb | DNb (g cm−3) | (V−R) | (R−I) |
| 36Pc,d | 21.370 ± 0.016 | ≥22.4 | 15.272 ± 0.016 | 2.52 ± 0.02 | 3.56 ± 0.02 | 1.4 ± 0.1 | 1.24 ± 0.07 | 0.46 ± 0.05 | 0.52 ± 0.04 |
| 36Pe | 21.570 ± 0.008 | ≥24.5 (3.3 arcsec) | 15.247 ± 0.008 | 2.55 ± 0.01 | ∼40 | 1.9 ± 0.1 | 0.01 ± 0.01 | 0.48 ± 0.03 | 0.56 ± 0.03 |
| 40Pd | 22.08 ± 0.02 | ≥22.2 | ≥15.72 | ≤2.05 | n/a | n/a | n/a | 0.37 ± 0.10 | 0.65 ± 0.11 |
| 47Pd | 22.01 ± 0.04 | ≥22.9 | 14.93 ± 0.04 | 2.96 ± 0.05 | n/a | 1.4 ± 0.1 | n/a | 0.29 ± 0.06 | 0.79 ± 0.07 |
| 94P | 20.974 ± 0.015 | ≥22.1 (3.0 arcsec) | 15.19 ± 0.015 | 2.62 ± 0.02 | ∼33 | 3.0 ± 0.5 | 0.03 ± 0.01 | 0.62 ± 0.05 | 0.44 ± 0.06 |
| 121Pe | 20.775 ± 0.006 | ≥25.0 | 14.660 ± 0.006 | 3.35 ± 0.01 | 10+8−2 | 1.15 ± 0.03 | 0.12 ± 0.04 | 0.53 ± 0.03 | 0.44 ± 0.03 |
| 121Pf | 20.63 ± 0.10 | ≥24.2 (3.1 arcsec) | 14.60 ± 0.10 | 3.44 ± 0.16 | n/a | n/a | n/a | 0.29 ± 0.20 | n/a |
| P/2004 H2d | 21.590 ± 0.007 | ≥23.9 | ≥15.88 | ≤1.91 | n/a | n/a | n/a | 0.49 ± 0.03 | 0.28 ± 0.04 |
a Limiting coma magnitude measured within 5 arcsec, unless stated. bLower limits as the orientation of the rotation axis is unknown. cResults from 2005 NTT run. For each of the comets with multirun data the individual results are presented here; the conclusions based on the combined data, including phase curves, are given in the text. dFaint coma present. Note that these results do not include any correction for the presence of faint near-nucleus coma. eResults from 2006 INT run. fResults from 2006 FTN observations.
4.1 40P/Väisälä 1
40P/Väisälä 1 was observed over seven nights during the 2005 INT run. It had a mean mR= 22.08 ± 0.02. The surface brightness profile is inconclusive, but we suspect that the comet was weakly active at Rh= 4.6 au. The coma contribution, assuming steady state, was measured to be mc≥ 22.22 within 5 arcsec, and therefore up to ∼95 per cent of the flux, but the irregular shape of the profile (Fig. 3) implies that the steady state assumption may not be valid in this case.

Image showing 40P, made up of 20 × 85-s exposures taken on the 6th night of the 2005 INT run. The profile is inconclusive, but we suspect that the comet was weakly active.
With observations over seven nights, changes in the relative positions of the Earth and the comet meant that there was a non-negligible change in observing geometry. The change in apparent magnitude due to variations in rH, Δ and α between the first and last frames is δmR≈ 0.04 mag, which although small compared with the uncertainty on individual points (typically ∼0.2 mag) is considerable when compared to the error on the average magnitude. The photometry was therefore reduced to the appropriate mR(1, 1, 0) using the precise position of the comet at the time of each observation, which was generated using HORIZONS.6 The phase function is assumed to be linear with β= 0.035 mag deg−1, as the range in phase angle over seven nights is not large enough to independently measure β for 40P. The mean mR(1, 1, 0) = 15.72 gives an upper limit to the radius of rN≤ 2.05 ± 0.02 km, assuming a 4 per cent albedo. This is a stronger constraint than the previous upper limit of rN≤ 3.6 km from Lowry et al. (1999), who did not detect the comet when it was at Rh= 6.01 au, outbound, in 1995. If the coma contamination is large, as suggested above, then the true radius of the nucleus could be considerably smaller than this.
The absolute magnitude variations were searched for periodicities, but none were found which were convincing. The strongest minimum in the periodogram (Fig. 4) corresponds to Pfitted= 15.3 h, and therefore a long rotation period of 30.6 h, but does not give a visually acceptable light curve at either of these periods. Periodogram searches were also carried out on short subsets of the data, using fully differential light curves for each pair of nights, during which the comet's motion was small enough to give common comparison stars. Shorter periods in these data are neither particularly convincing in the subsets, due to sparse data, nor good fits to the full data set. Although there is a large range in observed magnitudes (Δm≈ 1.4 ± 0.3 mag), this appears to be due to variations in the dust coma, and is not due to the nucleus, again implying that in this case the coma completely dominates.
Periodogram for 40P. No convincing period was found.
The colour measurements have large uncertainties due to the comet being very faint, but are consistent with means of (V−R) = 0.37 ± 0.10 and (R−I) = 0.65 ± 0.11. At large distance from the Sun the coma should be dominated by dust, with very little gas present; the colours measured for the comet could therefore be similar to the colours of the nucleus, although this is actually a measurement of the colour of the dust coma.
4.2 47P/Ashbrook-Jackson
A time-series on 47P/Ashbrook-Jackson was published in Paper II. The comet was observed again during the 2006 INT run; a total of five r′-band exposures totalling 18.5 min were taken over the two nights. Upon processing these data, 47P was found to be faintly active, despite still being beyond 5 au, with a faint tail visible to the west of the comet (Fig. 5). The activity is clearly weak. The profile measured in good (∼1 arcsec) seeing on the last night matches the stellar PSF within the inner part, where the nucleus appears to dominate the flux. The activity level can be quantified as Afρ= 3–11 cm, with the lower number being measured on the latter night.
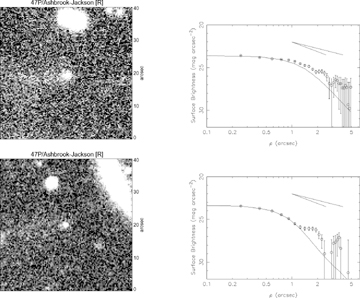
Images of 47P taken during the 2006 INT run. There is a faint tail visible to the west (left-hand side of these images) of the comet, which is clearer in the night 3 data (top). The profile shows activity. In the night 4 data (bottom), the tail is less obvious, as the total exposure time is less.
The average magnitude over the two nights is mR= 22.01 ± 0.04, with a total variation similar to that observed in the light curves above, of Δm= 0.4 mag. These imply mR(1, 1, 0) ≥ 14.93 and rN≤ 2.96 ± 0.05 km, with a/b≥ 1.4, slightly fainter than our earlier results despite the weak coma, possibly due to a steeper phase function than β= 0.035 mag deg−1. Taking both the NTT and INT results, and those of Licandro et al. (2000) and Lamy et al.,7 allowed calculation of a rough phase function (Fig. 6). A best-fitting straight line gives a steep phase function of β= 0.083 ± 0.006 mag deg−1, implying a true mR(1, 1, 0) = 14.477 ± 0.007 and consequently rN= 3.63 ± 0.01 km. The fit to the three time-series measurements (taking the five points over two nights from the INT data as a ‘time-series’) is excellent, while the snapshot from Licandro et al. also agrees with this fit if it is assumed that it was taken near a light-curve minimum. Therefore we regard this as a reasonable estimate of the phase function of 47P, despite the fact that it is unusually steep.
47P mean magnitudes from Paper II, the INT data and from the literature reduced to rH=Δ= 1 au and plotted as a function of phase angle α. There is a good fit through the time-series data giving a linear phase law with β= 0.083. Labels give the sources of each point; Li00: Licandro et al. (2000); La04: Lamy et al. (2004); NTT: Paper II. The faint activity seen in the INT data means that it provides a lower limit on mR(1, 1, α), although the coma clearly contributes little flux as making this point any fainter would mean an even steeper phase function and a poor fit.
Colours were measured of (V−R) = 0.29 ± 0.06 and (R−I) = 0.79 ± 0.07. These are unusual when compared to typical nuclei colours, and show a large change from those presented in Paper II and (V−R) = 0.4 ± 0.3 by Licandro et al. 47P was weakly active at the time of these observations, so we favour our earlier value. A weighted mean of all colour data for 47P (including that of Licandro et al.) gives (V−R) = 0.42 ± 0.02, (R−I) = 0.44 ± 0.03.
4.3 94P/Russell 4
94P/Russell 4 was observed over four nights in 2005 July using the INT. A total of 83 r′-band frames were taken, and in addition at least one colour block on each night. The combined image and corresponding profile are inconclusive (Fig. 7); the profile shows some signs of faint activity beyond 2 arcsec from the nucleus, although this may be due to residual flux in the combined image from particularly bright nearby stars. The calculated coma contribution within 5 arcsec is mc≥ 21.25 or ≤77 ± 30 per cent; measured before the peak from possible stellar contamination the contribution is mc(3 arcsec) ≥ 22.06 or ≤37 ± 15 per cent.
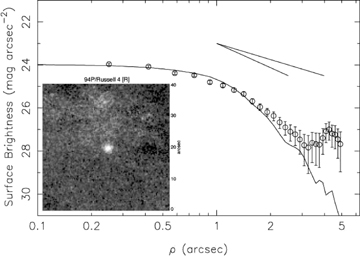
Co-added image of 24 frames taken of 94P on 2005 July 6. Each frame had an exposure time of 75 s, giving this combined frame an equivalent exposure time of ∼30 min. The profile implies that the comet could have been weakly active at the time of observation, although the rise at the end is more likely due to residual star light.
The mean magnitude of 94P was measured to be mR= 20.974 ± 0.015; as with other comets observed during this run the individual magnitudes were converted to absolute magnitudes due to the δmR≈ 0.03 mag difference over the four nights, primarily due to the changing phase angle. The absolute magnitude and radius were measured to be mR(1, 1, 0) = 15.187 and rN= 2.62 ± 0.02 km. These are technically upper limits if there was any weak activity; however, we believe that the comet was effectively inactive as these are in excellent agreement with preliminary results from a light curve taken by the authors for a different programme when the comet was clearly inactive at 4.7 au in 2007 July.
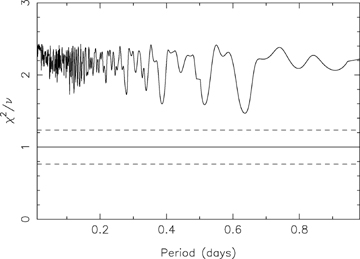
The motion of this comet was such that it was not possible to use common stars to produce multinight differential light curves, but since it was reasonably bright and exhibited a large amplitude variation the increase in size of the error bars due to calibration on to the Landolt scale was not significant. The null hypothesis of constant brightness is rejected at a 50σ level. The periodogram for 94P is shown in Fig. 8; the strongest minimum is at Pfitted= 16.7 ± 0.4, corresponding to a rotation period of Prot= 33.4 ± 0.8 h. Although this minimum only has χ2/ν= 193/79 = 2.45 ≡ 9σ, and the data folded on to this period displays considerable scatter (Fig. 9), it is clear that there is substantial variation in the brightness of the comet, again implying that the nucleus dominates the flux.
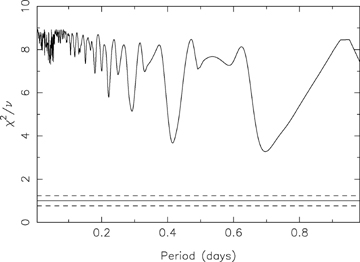
Periodogram for 94P.

Folded light curve for 94P, period = 33.4 h. Data from separate nights are plotted with different symbols (circle – night 1; cross – 2; square – 3; triangle – 4): the variation in brightness is considerable even during single nights.
The full range observed in the data is Δm= 1.2 ± 0.2 mag, implying a/b≥ 3. This is quite an extreme elongation, in excess of any other measured nucleus, and exceeded by few asteroids. The fact that there are large ranges in observed brightness on individual nights and that this comet was bright show that this is not due to any calibration issue.
An alternative explanation is that the range in mR is due to variations in albedo across the nucleus surface instead of changing cross-sectional area, which would be revealed by periodicities in the colour indices. There are some variations in the measured colours of the comet, although the individual measurements are normally distributed around the mean values of (V−R) = 0.62 ± 0.05 and (R−I) = 0.44 ± 0.06. The variations do not appear to be correlated with either of the above periods, nor can the r′-band data be fit to periodicities found in the (R−I) sequence. Changes in surface colour do not seem to be the cause of the large amplitude variations seen in the light curve.
4.4 121P/Shoemaker-Holt 2
121P/Shoemaker-Holt 2 was predicted to have mR= 22.18 during the 2006 INT run, based on a radius of rN= 1.75 ± 0.63 km from a snapshot observation in 1999 June by Lowry et al. (2003). The comet was brighter than expected, but a combined image and star-like surface brightness profile showed the comet to be inactive (Fig. 10), with a calculated coma contribution within 5 arcsec of mc≥ 24.95 or ≤2 ± 4 per cent of the total flux. However, inspection of the co-added frame revealed a dust feature in the plane of the comet's orbit. Originally suspected to be a dust trail of remnant dust particles along the orbit due to the apparent inactivity of the comet, it is clear from Fig. 11 (in which colours are used to highlight faint features, and the orbit of the comet projected on to the sky is overplotted) that the feature is a tail, as it is not entirely in the orbital plane and spreads around the antisolar direction. This means that there are two contradictory measurements; the stellar nucleus profile implies that there is no coma, and there is clearly none resolvable, yet there is a tail, which implies that the comet is quite highly active. A tempting interpretation is that the observations happened to catch the comet just after it ‘turned off’, or shortly after an outburst from an otherwise inactive comet, meaning that there is no near nucleus coma, but the material in the tail has not yet dispersed.
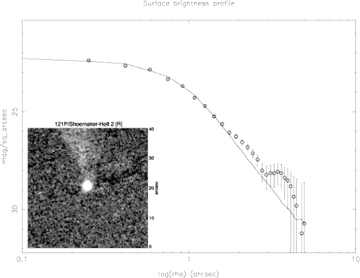
Co-added image of 121P, from the INT frames taken on 2006 March 2. The nucleus appears star-like, and the profile implies that the comet was inactive at the time of observation, yet there is a tail visible ∼ west (upwards in this image) of the nucleus (highlighted in Fig. 11).
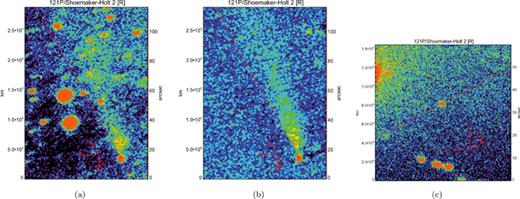
Wider field co-added images of 121P, using false colour to highlight the faint tail. (a) The 2006 March 1 INT data, during which the seeing was poor and exposure times were doubled, and there were too few images to generate a background image without the comet to subtract. This image is therefore a direct sum of the four r′-band images (equivalent exposure time te= 27 min), and contains stars. (b) Produced from the 18 r′-band frames (te= 65 min) taken at the INT on 2006 March 2, and has had background objects removed. (c) The data obtained with the FTN in 2006 May, and shows no tail, although it is not such a deep image (14 min).
Assuming that the nucleus was inactive, the measured mR= 20.775 ± 0.006 implies mR(1, 1, 0) = 14.660 and rN= 3.35 ± 0.01 km. This is considerably larger than the rN= 1.75 ± 0.63 result found by Lowry et al. (2003), even considering the large error bar on their result. This further suggests that there is some activity present in the INT frames; the axial ratio required to explain the difference as due to Lowry et al. observing an rN= 3.35 km body at a light-curve minimum is a/b= 6.3, which is unrealistic. However, the brightness of the comet does show variations which may be periodic and could be interpreted as being due to the rotating nucleus: the periodogram and best-fitting folded differential light curve are shown in Figs 12 and 13. With only four frames taken on the first night and 19 on the second, there is ambiguity in the determined period. A number of periods give visually acceptable light curves; Fig. 13 shows four that illustrate the range seen in the periodogram. Note that the deepest minima have χ2/ν < 0.68 (≡−1σ), implying that the error bars on the photometry are over estimated (i.e. the brightness measurements are more accurate than the conservative estimates on the uncertainties). The null hypothesis of constant brightness is rejected, at only χ2/ν= 47.4/21 = 2.2 ≡ 3.8σ, although this would be rejected at a higher confidence level if the error bars on individual points were reduced. The total variation is Δm= 0.15 ± 0.03 mag, implying a minimum a/b≥ 1.1 and a fairly spherical shape or near pole-on orientation, although if there is near nucleus unresolved coma then the true axial ratio will be larger (see discussion on 36P in Section 5). The minimum density implied by this 0.12 ± 0.04 g cm−3.

Reduced χ2 periodogram for 121P.
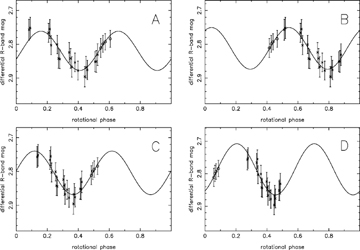
Folded differential light curves for 121P, periods A = 8.4, B = 10.1, C = 12.8 and D = 17.4 h.
To determine whether or not 121P was still active, and in particular to investigate the interpretation that it had just ceased outgassing in March, the comet was observed again on 2006 May 31, using 1 h on the FTN. Based on the radius measured using the INT, the predicted magnitude at this time was mR= 20.69; actually brighter than during the INT observations due to the lower phase angle, and theoretically well within the capabilities of the 2.0 m FTN. 14 R-band frames were taken over the course of the hour, along with three V band and suitable standard star observations for calibration. As the FTN does not have an autoguider, exposure times were limited to 60 s to minimize trailing of the images due to the telescope's movement. Combining all frames gave a detection of the comet, which was very close to the predicted brightness, with mR= 20.63 ± 0.10. The profile of this combined image indicated that the comet was inactive (mc(3.1 arcsec) ≥ 24.2, implying a flux contribution of ≤4 ± 7 per cent), and no tail was detected to a 3σ limiting surface brightness of ΣR≥ 25. Unfortunately this does not rule out a tail, as the surface brightness in the centre of the tail in the INT data is beyond these detection limits at ΣR≈ 25.5. The FTN observations were therefore unable to constrain the evolution/dissipation of the tail, although the star-like profile suggesting inactivity adds support to the idea that both sets of observations were of a bare nucleus which had recently ceased outgassing.
If this is the case then an approximate measurement of the phase function can be made. As the measured FTN brightness was close to the predicted value, then β must be close to the canonical 0.035; in fact a fit to these two points gives β= 0.047 ± 0.020 and mR(1, 1, 0) = 14.494 ± 0.006, implying rN= 3.61 ± 0.01 km. These results are still inconsistent with those of Lowry et al. (2003), and a non-standard phase law does little to improve matters. Including their result gives a phase law with β= 0.036 ± 0.006, and an implied mR(1, 1, 0) = 14.65 and rN= 3.36, but still does not fit their magnitude well. The colours measured for 121P were (V−R) = 0.53 ± 0.03 and (R−I) = 0.44 ± 0.03, from the INT data, and (V−R) = 0.29 ± 0.20 in the FTN data, where the extreme faintness in the few short V-band exposures gives large error bars.
4.5 P/2004 H2 (Larsen)
P/2004 H2 (Larsen) was observed in 2005 July at only its second opposition since discovery in 2004 April. A total of 98 r′-band frames were taken; the combined image shown in Fig. 14(a) is made up of the 16 taken on the 4th night. It can be seen in this image that the comet was weakly active, with a small tail extending to the west of the nucleus. The profile also shows the comet to be active, with mc= 23.85 measured within ρ= 5 arcsec. The comet flux is dominated by the nucleus though, as this corresponds to only 13 ± 11 per cent of the total flux (Afρ= 6.0 ± 0.1 cm, within ρ= 11 000 km), under the assumption of steady state coma. This assumption is only an approximation in this case, as the slope of the profile has a gradient slightly steeper than −1.5.
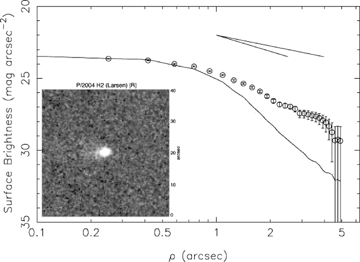
Image showing P/2004 H2, in which a faint tail can be seen to the west (left-hand side of this image) of the nucleus. The profile also shows that the comet was weakly active, although the flux from the nucleus dominates in the photometry.
P/2004 H2 was moving relatively slowly on the sky at the time of observation, allowing for both long exposure times (210 s) and the use of common stars to generate entirely differential light curves over three night time-spans. These were searched for periodicities, as was the seven-night-calibrated light curve, adjusted to take into account the changing observational geometry. No convincing periodicity was identified.
As the comet was active, we find a lower limit to the absolute magnitude and an upper limit to the radius. The light curve does give an accurate measurement of mR= 21.590 ± 0.007, which reduces to an absolute magnitude of mR(1, 1, 0) ≥ 15.875 and therefore a mean effective radius of rN≤ 1.91 ± 0.01 km. The mean measured colours of this comet are (V−R) = 0.49 ± 0.02 and (R−I) = 0.28 ± 0.04, although the individual measurements have considerable scatter around these means, possibly due to variations in the near nucleus coma.
5 36P/WHIPPLE
Time-series observations were taken on 36P/Whipple on three occasions; over 1.5 nights during the 2005 March NTT run, over a further two nights a year later with the INT, and a final time with the NTT in 2007 February. The reason for returning to the same comet was that, as with the others observed during the weather-affected NTT run (see Paper II); its rotation period was not confirmed at the first attempt. What made 36P particularly interesting was the fact that the rotation period suggested by the first data set was very short, at around 3.5 h. Such a period implied a minimum density considerably higher than any other previously observed nucleus; equation (5) gave a minimum density required for gravitational cohesion of 1.2 g cm−3, greater than that of water ice. This preliminary result was presented at the 2005 ACM conference (Snodgrass, Fitzsimmons & Lowry 2005a), and was noted by Toth & Lisse (2006). The additional data sets do not support this result though, and show 36P's rotation period to be considerably longer. Here we first describe the results from each run before discussing the interpretation of the whole data set.
5.1 NTT data: 2005 March
36P was found to be bright (mR= 21.37 ± 0.02) and appeared stellar in each individual frame. A combined image (Fig. 15) also appears fairly stellar, but there is a slight extension towards the east (right-hand side in Fig. 15a) and a surface brightness profile (Fig. 15b) shows clear signs of coma. Equation (2) gives a coma magnitude of mc≥ 22.4, which corresponds to 40 ± 23 per cent of the total flux being due to steady state coma. The flux within an aperture of ρ= 5 arcsec ≡ 12 000 km gives Afρ= 20.2 ± 0.3, which is more properly considered an upper limit since the slope of the profile is steeper than the −1.5 limit for a steady state coma. Such activity at Rh > 4 au is surprising for a comet that has never been seen to show any large amount of activity.
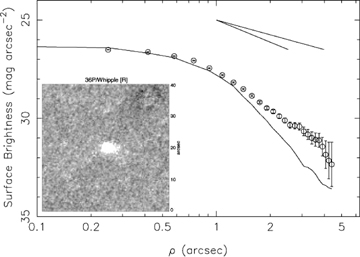
Image showing 36P, made up of 17 × 200-s exposures taken on 2005 March 6. There is some possible activity in the image, which appears to be confirmed by the active profile, where a clear difference between the comet and background PSF is visible.
It is clear that the total flux is still dominated by the flux from the nucleus, as obvious variations can be seen in the brightness of the comet in Fig. 18, which shows the varying brightness in the original data folded on to a period of 3.5 h. This period corresponds to twice the fitted period of 0.074 d given by the strongest minimum in the periodogram (Fig. 16); a minimum of χ2/ν= 0.55, which is actually below the expected value, but within 2σ of the expected χ2/ν= 1. The null hypothesis of constant brightness is rejected at a 6σ level, implying that the variations are real.
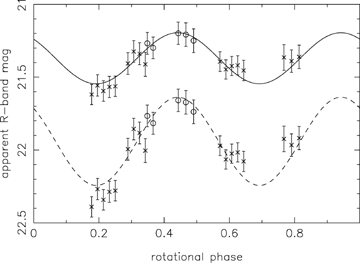
36P photometric data folded on to a 3.5 h rotation period. The lower data set, with the dashed line drawn through it, are the data with a constant coma flux equivalent to mc= 22.4 removed from them.
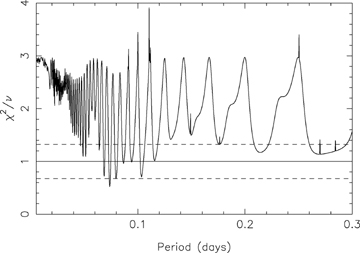
Periodogram for 36P, using the total observed brightness of the comet.
The unknown contribution to the flux from the coma causes uncertainty in both the average magnitude of the comet and the amplitude of the light-curve variation. Assuming a steady state coma, its contribution is modelled as a constant flux level, which is then subtracted from the data to leave the variation due to the nucleus. A constant coma contribution acts to raise the overall brightness, and to reduce the amplitude of the observed variation, as it will contribute relatively more when the nucleus cross-section is at a minimum than at maximum. Taking the measured coma contribution from the surface brightness profile (40 per cent of the average total flux), and removing this from the data, gives approximate ‘nuclear’ magnitudes. Figs 17 and 18 show the periodogram and folded light curve for these data. The rotation period found does not change; the presence or lack of coma at this level does not affect the measurement of this value. It can be seen that the amplitude of the light curve is greatly increased from Δm= 0.4 to 0.65 mag, and that this increase in the size of variation relative to the size of the error bars on individual data points increases the χ2/ν. There are no longer any minima within  ; the strongest minimum in the coma subtracted periodogram has χ2/ν= 1.8, corresponding to 2.3σ. The mean magnitude is increased by removing a coma component; the original data have mR= 21.37, removing 40 per cent of this flux gives mR= 21.94. These values are all calculated taking the value of 40 per cent to be fixed; in reality the 23 per cent uncertainty on the flux contribution leads to large error bars on any coma subtracted photometry.
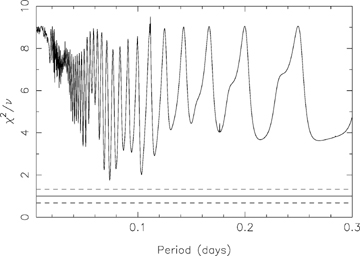
Periodogram for 36P, from data with a constant flux level due to the coma removed.
The sizes and shapes implied by the two light curves are different. The original data give a radius for the equivalent sphere of 2.5 km, and an axial ratio of a/b≥ 1.4, and therefore nuclear dimensions of a×b= 3.3 × 2.3 km. The coma subtracted model gives a smaller, more elongated body, with rN= 1.9 km, a/b≥ 1.8 and thus a×b= 3.1 × 1.6 km. The first solution matches the value of rN= 2.5 ± 0.2 km found by Lowry & Weissman (2003), who obtained a snapshot of 36P when it was inbound at 4.4 au in 2001 May. The second solution is also consistent with this considering the uncertainties on the coma fraction.
Fig. 18 shows that the faint coma detected does not prevent measurement of a rotation period, and that this period is independent of any corrections to the photometry applied to correct for coma. It is the determined period which is of greatest interest for this object; at 3.5 h, these data show 36P to be the fastest rotating comet known. This implies that it has a surprisingly dense nucleus, under the assumption that it is essentially strengthless, or that this nucleus has strength not seen in others. Either of these presents a challenge to the general picture of nuclei that is beginning to be built up; that they are weak and very low-density bodies. The required density for a strengthless body rotating at a 3.5 h period depends on its elongation, and therefore for 36P depends on whether or not a coma model is subtracted. Equation (5) gives minimum bulk densities for 36P of 1.2 g cm−3 for the original data (with a/b≥ 1.4) and 1.6 g cm−3 for the coma subtracted version. Clearly the density is greater than water ice, for any level of coma, and over twice that required for any other nucleus.
Colours were also measured for 36P, and were found to be consistent across both nights with average values of (V−R) = 0.46 ± 0.05 and (R−I) = 0.52 ± 0.04. These colours are entirely typical of JFC nuclei and fall near the centre of the observed distribution, although it must be remembered that some fraction of this colour will be due to dust grains in the detected coma.
5.2 INT data: 2006 March
With this potentially interesting result in mind, 36P was the primary target of the 2006 INT run. After the first two nights were lost to poor weather, 36P was intensively monitored on the third to ensure unambiguous detection of any 3.5 h period. A total of 63 r′-band images were taken over ∼5.5 h, meaning that any short period would give almost complete phase coverage. As this night was non-photometric, and to search for longer periods, a considerable amount of data were also gathered on 36P on the fourth night, with 55 r′-band frames taken over almost 7 h. A combination of these data and a surface brightness profile of the resultant image (Fig. 19) show that the comet was effectively a bare nucleus; a year later and 0.7 au further from the Sun the faint activity seen in the NTT data had ceased. The formal coma limit measured within ρ= 5 arcsec is mc≥ 23.31, or ≤ 20 per cent of the flux; however, this is probably an overestimate due to the slight rise in the outer part of the profile due to residual sky noise (note that the profile is entirely consistent with the stellar PSF within the error bars).
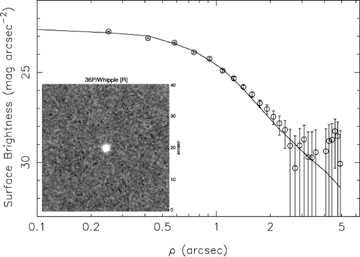
Image showing 36P, made up of 55 × 75-s exposures taken on 2006 March 2 with the INT, and the corresponding profile. The comet is clearly inactive.

The full range of the INT data is Δm= 0.7 ± 0.1 mag, larger than that measured in the NTT data but similar to the range observed in the coma-corrected data. It implies a/b≥ 1.9. The periodogram for the INT data is shown in Fig. 20, which shows that the fit to the fluctuations in the brightness is dominated by a long period variation. This periodicity search is based on differential magnitudes, since the large field of view of the WFC meant that the same stars could be used for comparison on both nights, meaning that no uncertainty is added due to calibration on to a standard scale. The data folded on to the best period, at Prot= 40.6 h, is shown in Fig. 21. Such a long period could not have been detected in the shorter and sparser data set obtained with the NTT, but there remains the question of where the 3.5 h period came from, and whether it has any basis in reality. It is clear from Fig. 16 that there are many statistically acceptable periods in the NTT data; due to the few data points many periods can be found which have sufficiently low χ2/ν. The NTT data can be folded on to a 40.6 h period to give a visually acceptable light curve; however, this could be said of a large number of periods given the sparse data. Of more interest is whether or not any short period variation exists in the INT data. The unfolded data from each of the INT nights are shown in Figs 22 and 23, which show hints of shorter period variation. It is possible that the 3.5 h period and these short variations are part of a non-symmetric light curve with a longer period. The relatively noisy INT data does not allow a definite conclusion that the 40.6 h period is correct, nor entirely rule out a short period.
Periodogram for 36P from INT data.
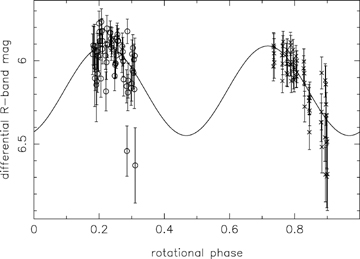
36P differential photometric data folded on to an 40.6 h rotation period.
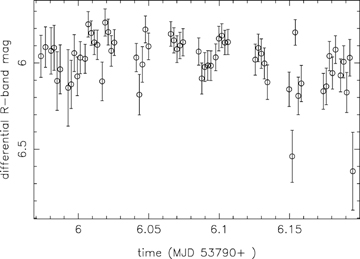
36P differential photometric data taken on 2006 March 1.
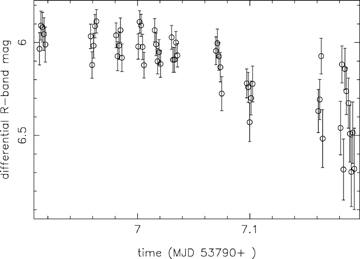
36P differential photometric data taken on 2006 March 2.
A large number of colour frames were taken within the time-series on 36P, giving good phase coverage for the fitted (long) period. Using the calibrated magnitudes of stars from the fourth (photometric) night gave the colours from differential magnitudes involving the same stars on the non-photometric night. All individual colours are consistent with means of (V−R) = 0.48 ± 0.03 and (R−I) = 0.62 ± 0.02, within the error bars on individual points.
5.3 NTT data: 2007 February
One of the main conclusions of this paper must unfortunately be that it is simply not practical to reach the required signal-to-noise ratio (S/N) for accurate nucleus light curves with a 2.5-m telescope. We therefore decided to return to the 3.6-m NTT to make a final search for short period variation. We were awarded 4 h of Director's Discretionary Time (DDT) and monitored 36P continuously over 3.7 h, and also returned to it for 15 min on the following night. Conditions were excellent and the comet was easily detected with mR= 22.774 ± 0.013, with the comet near aphelion at Rh= 5.2 au. The combined image and profile appear inactive (Fig. 24), although the profile is noisy in the outer part at Σ≈ 30 mag arcsec−2, and the formal limit is mc≥ 24 ± 2 or ≤ 22 ± 50 per cent of the flux.
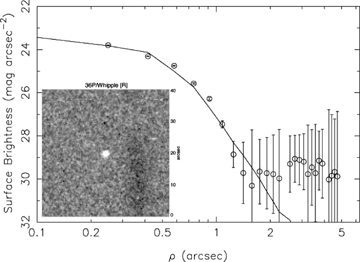
Image showing 36P, made up of 84 × 120-s exposures taken on 2007 February 26 with the NTT, and the corresponding profile. The comet is clearly inactive.
There was no short period variation found in the differential light curve (Fig. 25). The short sequence of data on the second night was taken to search for longer period variations, but the light curve remained fairly flat over both nights. Statistically, the null hypothesis of a constant magnitude with no variation is entirely acceptable: χ2/ν= 1.38, within the 1 ± 0.15 range on a 1σ variance; however, there is a linear trend across the 3.7 h of the first night, with a drop of Δm≈ 0.2 mag. We suspect that this is a short segment of a much longer period light curve. 36P rotates with a long period; although we still cannot be sure of what this period is, it appears to be ≥24 h.
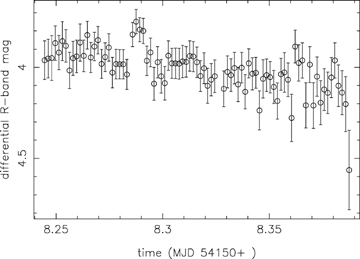
36P differential photometric data taken on 2007 February 26. The slight rise at t≈ 8.29 is due to proximity to a faint background star. Overall there is a drop of about 0.2 mag over the ∼4 h.
The (V−R) colour of the nucleus was measured to enable calibration of the photometry including the colour term. From a single V-band snapshot in the middle of the R-band time-series we obtain (V−R) = 0.40 ± 0.17. A weighted average of all colour measurements gives (V−R) = 0.47 ± 0.02 and (R−I) = 0.60 ± 0.02.
The three independent light-curve measurements do allow the calculation of an approximate phase function. We take the three measurements (2005 NTT at  , 2006 INT at
  , 2007 NTT at
  ), together with the snapshot by Lowry & Weissman (2003) taken at
  , the deep image from Epifani et al. (2007) (when the comet was weakly active at Rh= 3.9 au and
  ) and two further snapshots taken by the authors with the NTT during 2007 (at
  and
and  , both at Rh > 5 au and apparently inactive). Fig. 26 shows this data as mR(1, 1, α) against α. The error bars for each point cover the full range of uncertainty due to both the photometric uncertainty (very low for the light curves as it decreases as
  ) and also the uncertainty due to the unknown rotational phase of the observations. The maximum Δm observed is 0.7 mag, so the snapshots can be up to 0.35 mag from the mean magnitude and the DDT partial light curve covering a 0.2 mag range can be up to 0.25 mag from the mean. The 2005 NTT data point is given with a 40 ± 23 per cent coma contribution subtracted, and the error bars on this point include this considerable uncertainty. Note that we believe the INT data point to be well determined, as reflected by the small uncertainties on it, as the large amount of data over two nights covered Δm= 0.7 and thus gives a good average magnitude.
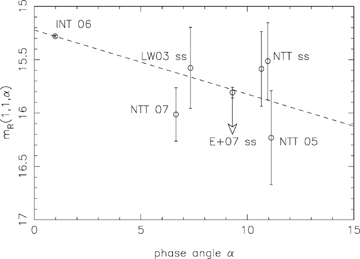
36P mean magnitudes reduced to rH=Δ= 1 au and plotted as a function of phase angle α. The labels give the telescope and year of the time-series. The two labelled ‘NTT ss’ are the 2007 snapshots, the point ‘LW03 ss’ is from Lowry & Weissman (2003) and the point ‘E+07 ss’ is from Epifani et al. (2007), with the arrow indication that the comet was faintly active when observed by these authors and therefore this point is a lower limit. Each error bar is the combination of the photometric uncertainty on the point and the uncertainty due to only observing a section of the rotational light curve. The error bar on the NTT 2005 point includes the uncertainty on the coma flux, which the point has been corrected for.
The best-fitting linear phase function has β= 0.060 ± 0.019 mag deg−1. This is quite steep, matching the previous largest reported value for JFCs of β= 0.06 for 2P/Encke (Fernández et al. 2000). We fit only a linear phase function as the data do not justify higher order fits, such as the standard IAU (H, G) system (Bowell et al. 1989). Also, while the INT data point is at low phase angle, we do not expect the sort of opposition surge seen in asteroids; Rabinowitz, Schaefer & Tourtellotte (2007) show that for outer Solar system bodies (TNOs and Jupiter Trojans) there is no opposition surge.
The size of the nucleus is determined from the absolute magnitudes from this phase law; extrapolating the linear phase law back to α= 0° gives mR(1, 1, 0) = 15.223 ± 0.008. Assuming a 4 per cent albedo this gives a radius of 2.58 ± 0.01 km. When taken with a/b= 1.9 this implies dimensions of a×b= 4.1 × 2.1 km.
6 DISCUSSION OF COMET PROPERTIES AND COMPARISON WITH KBOS
Here we discuss the effect of this new data on the general trends for JFCs identified in Paper II. In that paper, and in Lowry et al. (2003) we suggested that the cut-off in Prot–a/b space, and corresponding cut-off in densities, corresponded to the true density of a typical JFC nucleus, at ∼0.6 g cm−3. If 36P was rotating in only 3.5 h, it challenged this theory; however, we now believe that it is one of the slower rotators and does not help to define the cut-off. 94P also appears to be a slow rotator. The possible periods for 121P all place it well within the previously observed range, while the lack of period determinations for the other comets means that our conclusions on the rotational properties of JFC nuclei are unchanged from Paper II.
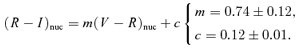
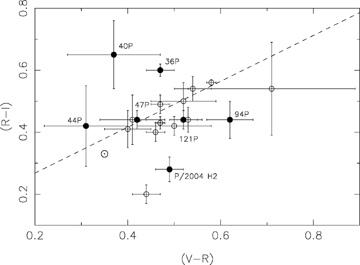
(R−I) against (V−R) for all JFCs with known colours. Filled circles – this paper; open circles – comets with colours previously determined using the same multifilter photometry method used here (Papers I and II and references therein). The position of the Sun on these axes is marked using the symbol ⊙.
While comets 45P/Honda-Mrkos-Pajdusakova, P/2004 H2 and 40P are not very close to this line (the first two well below the line in the lower centre of the figure, 40P above the trend in the upper left-hand side) they all showed some activity during the observations. In the case of both 40P and P/2004 H2 the coma was very weak, while 45P was observed by Lamy et al. (1999) using the HST when the comet was active and at large phase angle (α≈ 90°), but with a coma subtraction method. In all of these cases, the activity is not sufficient to reject the colour data as weak activity at large Rh should be dust dominated and therefore of similar optical properties to the nucleus, but also means that their difference from the rest of the data should not be overinterpreted. The mean colours of JFC nuclei are  ) and
) and  ).
).

 and standard deviation σKBO= 0.14), as do the JFCs, despite the relatively poor statistics
  . The model distribution plotted for the JFCs (solid line); however, is not the best-fitting normal distribution, but one generated by convolving the fitted KBO distribution with a ‘dereddening’ term: N(x)JFC=N(x)KBO⊗f(x), where the fraction of objects remaining f(x) ∝−x. Thus the ‘dereddening’ depends on the colour, with the most red KBOs being most depleted, with more neutrally coloured objects remaining. A least-squares fit gave f(x) = 2.8 − 3.5x (again, in non-physical units) and gave a good reproduction of the observed JFC distribution. This dereddening function means that 100 per cent of the KBO surfaces remain at x= 0.5 and they are entirely depleted beyond x= 0.8. Clearly this model is very approximate in its treatment of distributions, but it serves to demonstrate a possible transformation route between the KBO and JFC distributions. A more thorough approach would be to treat a large number of test particles, with a starting distribution like that observed in KBO colours, and then test the effect of different theoretical ‘dereddening’ models on the resultant JFC colours by computing the change in colour for individual comets. While an interesting problem, such calculations are beyond the scope of this work. Further colour data, especially on the JFCs, are required before a more detailed analysis of the distribution is justified.
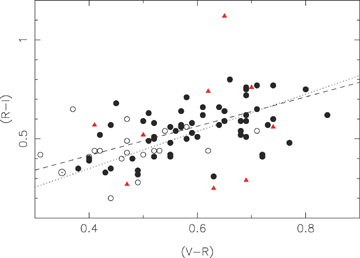
(R−I) against (V−R) for all JFCs, KBOs and Centaurs with known colours. Open circles – JFCs; filled circles – KBOs; triangles – Centaurs. The position of the Sun on these axes is marked using the symbol ⊙. The dashed line shows our best fit to the comet data, the dotted line is the fit to the KBOs. KBO and Centaur data from Jewitt & Luu (2001), Peixinho et al. (2004).
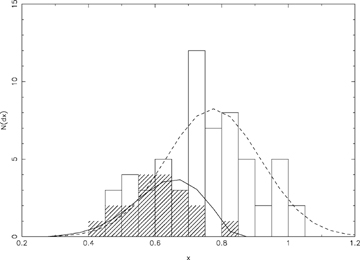
The (R−I) against (V−R) data were reduced on to distance x along the best fit (see text). This plot shows the histograms of N(x) against x for JFCs and KBOs. The KBOs (clear) are reasonably well matched by a normal distribution (dashed line). The JFCs (hatched) appear to have a truncated distribution; the model JFC population (solid line) was created by convolving the KBO model with a ‘dereddening’ term that is ∝−x.
Although a linear decrease in the number of surviving KBO surfaces with colour can be invoked to explain the observed JFC colours, a physical interpretation of this effect is required. A plausible solution is to assume that the observed variation in KBO colour is associated with the ages of their surfaces, and that space weathering reddens the surfaces in an approximately linear fashion with time. Under this paradigm the objects in very red tail of the distribution are very old, while the bluer ones have under gone some ‘resetting’ of their surfaces (e.g. due to a collision) more recently. When a KBO is perturbed into the inner Solar system, the onset of cometary activity acts to resurface the nucleus. For younger KBOs, whose surfaces are not very different to their subsurfaces as they have not been weathered for long, this has little effect, but for the very ancient and red surfaces, the difference is important. One interesting aspect of this interpretation is that it suggests that nuclei surfaces, being younger, are a closer match to their interiors, and thus may provide a better view of ‘primordial’ material than the ancient weathered surfaces of KBOs.
7 SUMMARY
We report here observations on JFCs from two runs with the INT, with additional data from the FTN. A large number of snapshots were taken, and in addition time-series data were taken on five comets. We also describe our observations of comet 36P/Whipple over the last 3 yr, at both the INT and ESO's NTT. Our results are as follows.
For the majority of the comets we have snapshot data. Of these, five of the comets were not detected, three were visibly active, and the remainder (nine comets and one Damocloid) were apparently inactive at large distance. Most of these results were close to the detection limits of the 2.5-m INT; we must conclude that good S/N nucleus observations really require a 4-m class telescope. The magnitudes, implied sizes, colours and activity levels for each comet are summarized in Table 2.
For the comets which were observed over a time-series, constraints were also placed on the rotation period and the elongation of the nucleus, from the range in magnitudes observed. Faint activity around 40P and P/2004 H2 prevented a measurement of these parameters for these comets, but for 47P, 94P and 121P and we measure minimum axial ratios of a/b≥ 1.4, 3 and 1.1, respectively. This implies that 94P has a very elongated nucleus. Periodogram analysis found best-fitting rotation periods of ∼33 and 10 h for 94P and 121P, but both of these are very uncertain and should be regarded as estimates.
For 36P we present data taken at five epochs: three (partial) light curves and two snapshots. The first data set gave a preliminary result implying fast rotation for this nucleus; however, larger and better sampled later data sets revealed that the rotation period is long (≥24 h). It is still not well determined; the largest data set has a best-fitting period of ∼40 h, but this is not a unique solution. This data set also shows a large amplitude variation implying an axial ratio a/b≥ 1.9.
The data on 36P were obtained at a range of phase angles 1 ≤α≤ 11°. Including the uncertainty on the snapshot/short time-series data due to the incomplete phase coverage, all the points are consistent with a linear phase function with β= 0.060 ± 0.019 mag deg−1. We also measure an approximate phase function for 47P, with a very steep β= 0.083 ± 0.006 mag deg−1.
VRI-band photometry was obtained on seven of the comets, including 36P, and the distribution of their colours was investigated. JFC nuclei and KBOs are found to have a similar trend of increasing (R−I) with increasing (V−R), with the JFCs being less red in general. We define a single parameter x to measure the redness of the objects across the VRI bands. We show that the distribution of JFC colours provides a good match to the blue end of the distribution of KBO colours, and that it is possible to recreate the JFC distribution by applying a ‘dereddening’ function that goes as f(x) ∝−x to the KBO distribution. One interpretation of this model is that it relates to the age of the comet.
The history of previous observations of comets are taken from Gary Kronk's Cometography (http://cometography.com/). Dates of last observation and orbital parameters are also sourced from the Minor Planets Centre (http://cfa-www.harvard.edu/iau/mpc.html) and the JPL Small-Body Database (http://ssd.jpl.nasa.gov/sbdb.cgi).
Note that the R-band magnitude of the Sun used by Lowry et al. (1999, 2003) and Lowry & Fitzsimmons (2001, 2005), m⊙=−27.26, was based on the often quoted value of (V−R)⊙= 0.52 from Allen (1973), which is for the Johnson filter system, not the modern Johnson–Cousins system used by Landolt (1992). In the Johnson–Cousins system (V−R)⊙= 0.35 (Holmberg, Flynn & Portinari 2006). The difference between m⊙=−27.26 and the true value of m⊙=−27.09 means that while the magnitudes measured in these works are accurate, the true radii are 100.2(−27.09+27.26)= 8 per cent larger. The radii for 75P, and for all others quoted from this group of papers, have been corrected to account for this.
Objects with 5.5 ≤a≤ 30.1 au are designated Centaurs.
http://epoxi.umd.edu/– 103P has now been confirmed as the target of this mission, with a fly-by date in 2010.
In this case taking the rN= 2.8 km quoted by Lamy et al. (2004) and calculating the nuclear magnitude at the time of their HST observations. The uncertainty on this radius is not reported. The error bar on this point is set equal to that on INT data (0.04 mag) for the purposes of weighting the best fit. This does lead to some uncertainty on the phase function; if the error bar is instead set equal to that from our extended NTT observations (0.007 mag) then the corresponding increase in weight on the point gives β= 0.076 mag deg−1.
We wish to express our gratitude to Eduardo Gonzalez-Solares of the Cambridge Astronomical Survey Unit for providing us with pipeline processed INT data from the 2005 run. We also thank the Director General of ESO for awarding 4 h of DDT for the final follow-up observations on 36P. SCL acknowledges support from the Leverhulme trust.
REFERENCES
Author notes
Based on observations collected at the European Southern Observatory, Chile (proposals: ESO Nos 74.C-0125, 278.C-5040), and at the Isaac Newton Group of telescopes on La Palma (proposals: I/2005A/11, I/2006A/7).
