


Abstract
The Wide Angle Search for Planets (WASP) survey currently operates two installations, designated SuperWASP-N and SuperWASP-S, located in the Northern and Southern hemispheres, respectively. These installations are designed to provide high time-resolution photometry for the purpose of detecting transiting extrasolar planets, asteroids, and transient events. Here, we present results from a transit-hunting observing campaign using SuperWASP-N covering a right ascension (RA) range of 06h < RA < 16h. This paper represents the fifth and final in the series of transit candidates released from the 2004 observing season. In total, 729 335 stars from 33 fields were monitored with 130 566 having sufficient precision to be scanned for transit signatures. Using a robust transit detection algorithm and selection criteria, six stars were found to have events consistent with the signature of a transiting extrasolar planet based on the photometry, including the known transiting planet XO-1b. These transit candidates are presented here along with discussion of follow-up observations and the expected number of candidates in relation to the overall observing strategy.
1 INTRODUCTION
More than 30 extrasolar planets are now known to transit their parent stars, most of which were discovered through photometric monitoring. Transit surveys which use a narrow field and a large magnitude depth have had some success, most notably that of the OGLE transiting planets (e.g. Konacki et al. 2003). Surveys which utilize the ‘wide and shallow’ technique of monitoring relatively bright field stars have achieved recent rapid success, including the discoveries of TrES-3 (O'Donovan et al. 2007), XO-2b (Burke et al. 2007), and several new HATNet planets (see e.g. Kovács et al. 2007). The transit technique has matured through overcoming serious obstacles which were impeding the data analysis, such as improved optimal photometric methods for wide-field detectors (Hartman et al. 2004) and reduction of correlated (red) noise (Tamuz, Mazeh & Zucker 2005; Pont, Zucker & Queloz 2006).
The Wide Angle Search for Planets (WASP) project currently operates two SuperWASP instruments (Pollacco et al. 2006), one in the Northern hemisphere on La Palma (SuperWASP-N) and the other (SuperWASP-S) located at the South African Astronomical Observatory (SAAO). The relatively large field of view (FOV) of the SuperWASP design allows each instrument to monitor a substantial amount of the visible sky with relatively high time-resolution. SuperWASP-N has been acquiring data since late 2003, achieving photometric precision of 1 per cent for stars brighter than V∼ 11.5.
The process of extracting reliable transit signatures from the SuperWASP data involves a systematic approach of removing trends from the photometry, employing an efficient transit detection algorithm (Collier Cameron et al. 2006), and performing spectroscopic follow-up using both low-/medium-resolution and high-resolution spectrographs to identify false positives and confirm planetary candidates. This method has already been used successfully on SuperWASP data to detect the planets WASP-1b and WASP-2b (Collier Cameron et al. 2007a). However, this process typically begins with millions of light curves from which many transit candidates are found and provides an extremely useful reference source for future surveys which monitor the same fields. For this reason, the transit candidates detected in several right ascension (RA) ranges have been published for the benefit of the transit survey community (Christian et al. 2006; Clarkson et al. 2007; Lister et al. 2007; Street et al. 2007).
We present the results of a photometric search for exoplanetary transits using data from SuperWASP-N, covering the fields in the range 06h < RA < 16h. Section 2 describes the 2003/2004 SuperWASP-N observing campaign, the predicted transit recovery rate, and the data-reduction techniques. Section 3 discusses the transit detection algorithm and the candidate selection criteria. The results of this search are presented in Section 4 with discussion of the candidates which have been followed up and those which are considered high-priority candidates. Section 5 discusses the results from the analysis and the number of final candidates in relation to the limitations of the survey for this particular RA range.
2 DATA ACQUISITION
2.1 Observations and recovery rate
The SuperWASP-N instrument is a robotic observatory designed to provide precision photometry for large areas of sky. First light was achieved in 2003 November and observations have continued until the present time. The instrument consists of a fork mount which is able to support up to eight lens/detector combinations simultaneously, described in more detail in Pollacco et al. (2006). When the instrument is operating at full capacity, the sky coverage becomes substantial leading to a total FOV of 482 deg2 with a pixel-scale of 13.7 arcsec pixel−1. During the 2003/2004 (hereafter referred to as 2004) observing season, five out of the eight detectors were installed. Even so, the data rate from those five cameras exceeded the electronic transfer capability of the ethernet connection on La Palma at that time and so data were stored via a tape (DLT) autoloader then mailed to data-reduction sites.
The observing strategy during the 2004 observations was given careful consideration, mostly in an effort to reduce the false-alarm rate due to blended eclipsing binaries (Brown 2003). This is a particularly important problem to solve for instruments such as SuperWASP whose wide fields can encompass a significant gradient in stellar densities and whose large pixel sizes greatly increase the chance of blending. The fields monitored were selected at 1h increments in RA and lying along declination Dec. =+28°. This avoided the Galactic plane and hence overcrowding in the fields. In addition, the ecliptic was avoided to reduce sky contamination from the Moon and other bright Solar system objects. An exposure time of 30 s was used for maximum dynamic range and observations cycled between up to eight fields. The slew-time of the mount ensured that an observing cadence of ∼8 min per field was achieved. The resulting data set contains light curves for over 6.7 million stars in the magnitude range 8 < V < 15. These data were divided by RA range into six separate data sets which each contained approximately one million stars.
This paper presents the analysis of the stars in the range 06h < RA < 16h. A total of 1832 777 stars were monitored in this range over 56 fields and 95 526 frames were acquired. For each field, a series of constraints were applied to extract suitable stars for transit hunting. These include extracting only stars whose light curves have an rms precision better than 0.01 mag and whose baseline contains at least 500 frames spread over at least 10 nights. A summary of the fields observed in this data set is shown in Table 1. Out of the 56 fields, 23 did not meet the baseline criteria for light curve extraction and so are not included in Table 1. A total of 130 566 stars were extracted for transit hunting from the 729 335 remaining stars using the above criteria.
Fields observed using SuperWASP-N during 2004 in the range 06h < RA < 16h. The table shows the total number of stars monitored per field, as well as the number of extracted stars for transit hunting Ne, the initial number of candidates identified by the detection algorithm Ni, and the final number of candidates Nf.
| RA | Dec. | Nights | Frames | Stars | Ne | Ni | Nf |
| 0616 | +3126 | 37 | 627 | 128 284 | 23 936 | 280 | 0 |
| 1043 | +3126 | 31 | 653 | 15 014 | 2775 | 61 | 0 |
| 1044 | +2427 | 32 | 654 | 16 365 | 2785 | 18 | 0 |
| 1116 | +3126 | 31 | 584 | 14 234 | 2459 | 72 | 0 |
| 1117 | +2326 | 31 | 653 | 15 521 | 2586 | 39 | 0 |
| 1143 | +3126 | 51 | 1200 | 13 907 | 2508 | 80 | 0 |
| 1144 | +2427 | 52 | 1203 | 15 400 | 2591 | 78 | 1 |
| 1144 | +3944 | 45 | 908 | 14 985 | 2285 | 32 | 0 |
| 1216 | +3126 | 51 | 1111 | 15 177 | 2592 | 77 | 0 |
| 1217 | +2326 | 51 | 1200 | 13 045 | 2460 | 82 | 0 |
| 1243 | +3126 | 86 | 2378 | 15 082 | 2605 | 115 | 1 |
| 1244 | +2427 | 85 | 2382 | 13 287 | 2547 | 161 | 0 |
| 1244 | +3944 | 78 | 1985 | 15 065 | 2410 | 111 | 0 |
| 1316 | +3126 | 86 | 2277 | 15 259 | 2566 | 147 | 0 |
| 1317 | +2326 | 87 | 2386 | 12 207 | 2408 | 134 | 0 |
| 1342 | +3824 | 103 | 2846 | 14 792 | 2724 | 139 | 0 |
| 1342 | +4642 | 101 | 2689 | 15 928 | 2556 | 155 | 0 |
| 1343 | +3126 | 101 | 2842 | 15 357 | 2616 | 115 | 0 |
| 1417 | +3824 | 102 | 2848 | 15 509 | 2871 | 154 | 0 |
| 1418 | +3025 | 103 | 2854 | 16 374 | 2933 | 167 | 0 |
| 1443 | +3126 | 125 | 4018 | 16 847 | 3071 | 167 | 0 |
| 1444 | +2427 | 113 | 3918 | 19 502 | 3180 | 131 | 0 |
| 1444 | +3944 | 117 | 3503 | 17 476 | 3285 | 289 | 0 |
| 1516 | +3126 | 123 | 3881 | 20 125 | 3448 | 253 | 0 |
| 1517 | +2326 | 123 | 3986 | 21 242 | 3468 | 245 | 1 |
| 1543 | +3126 | 130 | 4775 | 23 180 | 3963 | 208 | 0 |
| 1544 | +2427 | 113 | 4560 | 22 737 | 3907 | 179 | 0 |
| 1544 | +3944 | 122 | 4271 | 20 097 | 3874 | 296 | 0 |
| 1616 | +3126 | 127 | 4626 | 28 627 | 5133 | 381 | 2 |
| 1617 | +2326 | 129 | 4722 | 30 043 | 5110 | 433 | 1 |
| 1643 | +3126 | 129 | 5333 | 35 443 | 6233 | 363 | 0 |
| 1644 | +2427 | 112 | 4969 | 33 266 | 6378 | 274 | 0 |
| 1644 | +3944 | 121 | 4883 | 29 958 | 6303 | 9 | 0 |
The lack of baseline coverage suffered by many of the fields due to the visibility of the fields over the observing campaign was particularly acute at small RA. Consequently, the sensitivity to planetary transits varies greatly over the RA range in this data set. This is illustrated by the transit recovery plots shown in Fig. 1. Transit signatures were randomly generated with periods in the range 1 < P < 5 and injected into the times of observation for each field. A transit signature is considered ‘recovered’ if both the ingress and egress of the transit are observed. Fig. 1 shows the results of this simulation for four fields which span the range of RA in this data set, in each case using two, four and six transits as the requirement for detection. The reduction in the transit recovery rate is clearly quite dramatic for fields which are observed for less than ∼60 nights.

Transit recovery rates for the fields SW0616+3126, SW1216+3126, SW1417+3824 and SW1644+3944, observed for 37, 51, 102 and 121 nights, respectively. The solid line represents the recovery of two transits, the dashed line four transits, and the dotted line six transits.
2.2 Data reduction
Reduction in the SuperWASP-N data required producing millimagnitude photometry whilst managing a high data rate. An automated reduction pipeline was constructed which was able to achieve this goal and is described in more detail in Pollacco et al. (2006). This description will concentrate on the main factors to be considered when reducing wide-field data from instruments such as SuperWASP. Wide-field issues such as vignetting, point spread function (PSF) distortion, and spatial dependence were encountered with the WASP0 prototype instrument (Kane et al. 2004). The WASP0 data set provided an excellent starting point around which to solve the same wide-field issues that would affect the SuperWASP data and pipeline.
The calibration frames include bias, dark, and flat-field frames which are generally acquired on a nightly basis when the automated enclosure commences operations at dusk. These frames are handled by the pipeline through a series of statistical tests which are able to classify them and create master frames. To create the master flat-field, a vignetting map and a shutter time-correction map are created and then combined with the flat-field through an inverse variance weighted linear least-squares fit. Iterative sigma-clipping and smoothing via spline-fitting leads to an accurate representation of the sky brightness for the wide-field.
Rather than fitting the spatially-variable PSF shape of the stellar images, weighted aperture photometry is used to compute the flux in a circular aperture of tunable radius. This is achieved by implementing a flux-weighted astrometric fit which uses an automatically extracted subset of the Tycho-2 (Høg et al. 2000) catalogue, and then fixing the aperture locations based on entries within the USNO-B1.0 (Monet et al. 2003) catalogue with a second-epoch red magnitude brighter than 15.0. This also allows the correction of spatially-dependent aspects which are normally assumed to be constant across the frame, for example, the airmass and heliocentric time-correction. The vignetting and barrel distortion produced by the camera optics can result in serious blending effects for stars whose neighbours possess significantly distorted stellar profiles. It has been shown by Brown (2003) and Torres et al. (2004) that blending can have a detrimental effect on transit searches. Stars which are significantly affected by blending are identified by computing blending indices B1= (F3−F1)/F1 and B2= (F3−F2)/F2, where F1, F2 and F3 are the flux measurements from aperture radii of 2.5, 3.5 and 4.5, respectively. The comparison of these indices leads to an effective exclusion of blended stars as described by Kane et al. (2005).
The photometric data which are produced by the pipeline are further refined by applying corrections for the primary and secondary extinction through an iterative process which is explained in detail by Collier Cameron et al. (2006). The instrumental magnitudes are then transformed to Tycho-2 magnitudes by using local calibrators observed on exceptional nights. These corrected data are stored as Flexible Image Transport System (FITS) binary tables and ingested into the SuperWASP Data Archive which is located at the University of Leicester.
3 HUNTING FOR TRANSITS
This section describes the methodology used to sift the archived photometric data for transit signatures. The description here is based on the principles suggested by Collier Cameron et al. (2006) and Collier Cameron et al. (2007b) with applications to these particular data in mind.
3.1 De-trending light curves
Achieving the photometric accuracy necessary to be sensitive to transiting extrasolar planets is a major challenge for wide-field instruments such as SuperWASP. The stellar light curves which are extracted from the archive typically have systematic errors which have the strong potential to produce false-alarms when scanned for transit signatures. The severity of the effects of correlated noise on the planet yield was demonstrated by Pont et al. (2006). The SysRem algorithm proposed by Tamuz et al. (2005) is effective at identifying and removing correlated noise and was the method adopted for the SuperWASP data prior to transit hunting.
As shown by Collier Cameron et al. (2006), the SysRem algorithm identified four basis functions, each of which represents a distinct systematic noise pattern, which were used to model the global systematic errors. The frequency structure of the noise outside transit was found to be correlated and characterized by a power law. As a result of this frequency dependence, the entire correlated noise is referred to as red noise. Applying the deduced correction to the SuperWASP data reduced the rms amplitude of the red noise from 0.0025 to 0.0015 mag. These basis functions were representations of such effects as colour corrections, extinction, and the vignetting function. Further basis functions were identified but these were not applied to the error model to avoid the risk of removing real variability. The resulting detrended light curves are then ready to be analysed for periodic variability including transit signatures.
3.2 Transit detection algorithm
The automation of transit detection algorithms for very large data sets has presented a major challenge for the transit survey teams, prompting extensive studies into optimal solutions (e.g. DeFaÿ, Deleuil & Barge 2001; Kovács, Zucker & Mazeh 2002). The transit model which is applied needs to be optimized to correctly balance the computational time and the efficiency of avoiding false-positive detections. The hybrid algorithm suggested by Collier Cameron et al. (2006) uses a refined version of the Box Least-Squares (BLS) algorithm to perform a search on a coarse grid of transit epochs. The algorithm then rejects candidates based on such features as strong variability, the number of transits, and significant gaps in the phase-folded light curve. This removes more than 95 per cent of the search sample, allowing for a finer grid search on the remaining stars using the Newton–Raphson method of Protopapas, Jimenez & Alcock (2005). Recall also from Section 2.1 that a requirement imposed before transit searching was that each star has ≥500 measurements obtained over ≥10 nights with an rms precision of ≤0.01 mag. In practice, the rms restriction results in the inclusion of stars with Tycho V≲ 13.
For the SuperWASP fields, a coarse grid search was conducted with periods in the range 0.9 ≤P≤ 5.0. The fine grid search to the remaining stars yields a candidate list which includes measurements of basic transit fit parameters, such as the period, duration, depth and epoch of the first transit. Additionally provided are the Δχ2 of the fit, the ratio of the best-fitting transit model to that of the best-fitting antitransit model Δχ2/Δχ2− (Burke et al. 2006), the signal-to-red noise ratio Sred (as described by Pont et al. 2006), and the signal-to-noise ratio of the ellipsoidal variation, S/N ellip, to reduce false-alarms due to eclipsing binaries (Sirko & Paczyński 2003). The combination of these statistics allows for a powerful analysis tool in sifting transit candidates from the list.
3.3 Candidate selection criteria
The evolution of the candidate list provided by the detection algorithm and the final list of candidates proceeds in three distinct stages. The first stage is the visual inspection of the folded light curves, a process by which we are able to discard many of the candidates for which there is clear evidence of a secondary eclipse. In addition, candidates whose best-fitting period is closely correlated with an integer number of days are rejected in order to minimize the number of aliases. This stage is also used to discard those whose data are of exceptionally poor quality. It should be emphasized that this step is not to select transit candidates, rather it is to reject obvious false-alarms. Through this visual inspection stage, also employed using identical criteria by the other SuperWASP-N 2004 candidate releases (Christian et al. 2006; Clarkson et al. 2007; Lister et al. 2007; Street et al. 2007), generally over 95 per cent of the candidates are rejected.
The second stage of candidate sifting uses the quantities computed by the detection algorithm. Candidates were systematically removed from the list if any of the following is true: (i) the Sred is low (Sred < 8.0), (ii) there are significant ∼1 d aliases (P < 1.05 d), (iii) less than three transits are observed, (iv) the antitransit ratio is low (Δχ2/Δχ2− < 2.0), or (v) the ellipsoidal variation is high (S/Nellip > 8.0). The surviving candidates are combined together and sorted by RA so that any close companions can be easily identified.
The third stage ingests the candidates from the second stage into the Variable Star Investigator (vsi) which is an automated query tool developed by the SuperWASP consortium to provide colour information from existing photometric catalogues. The vsi tool returns photometric information from such catalogues as Tycho-2 and the Two-Micron All-Sky Survey (2MASS) (Skrutskie et al. 2006) via vizier (Ochsenbein, Bauer & Marcout 2000). The information is used to provide estimates of basic stellar parameters, such as spectral type, effective temperature (see Street et al. 2007), and radius R★. The transit depth then translates into a direct estimate of the planetary radius Rp. The transit parameters allow a calculation of the exoplanet diagnostic parameter ηp which serves as a measure of the candidate reliability and is described by Tingley & Sackett (2005). Moreover, finder-charts from DSS (Cabanela et al. 2003) are used to reveal the presence of any close companions within a 48-arcsec aperture. Candidates are removed from the list if either (i) there is a brighter object within the 48-arcsec aperture or (ii) the estimated radius is too large (Rp≳ 1.6RJ). This radius cut-off was selected to remain consistent with the previous SuperWASP candidate papers and also the relatively large radius of the recently discovered planet TrES-4 (Mandushev et al. 2007).
4 RESULTS
This section presents results from the transit search for the 33 fields monitored in the 06h < RA < 16h range which met the search criteria, including the candidate-rejection process and description of the surviving candidates.
4.1 Planetary transit search
As described in Section 2.1, we required that a number of conditions be satisfied before subjecting the data to the transit search algorithm. A total of 729 335 stars from 33 fields achieved the baseline requirement for transit hunting, and 130 566 of these stars also met the photometric precision requirement. These stars were processed by the detection algorithm, yielding an output of fit parameters and light curves folded on the best-fitting period. This output contained 5445 stars which were selected by the detection algorithm as having transit signatures that require further investigation. Table 1 lists the number of stars extracted for transit hunting Ne, the initial number of candidates detected Ni, and the final number of candidates Nf per field.
The first stage (visual inspection) of the candidate-sifting process yielded 36 candidates from the original list of 5445. Table 2 presents these candidates in order of increasing RA. Only those candidates for which a clear transit was visible were selected to populate this list. The criteria described in Section 3.3 for the second stage of candidate sifting were then applied to this list, using the information displayed in the table. The code in the final column of the table shows which test from the second stage was failed by that star. In the instance where more than one test is failed by a star, the first test failed is shown. Half of those which failed to pass through the second stage were eliminated due to the degree of ellipsoidal variation in the out-of-transit light curve, emphasizing the potential contamination by grazing eclipsing binary stars.
List of candidates that passed the visual inspection (first stage) of the transit candidates detected by the BLS algorithm. The final column lists a rejection code for those which were rejected according to the information available from the BLS search, as described in Section 3.3. The codes are as follows: (R) –Sred, (P) – period, (A) – antitransit ratio, and (E) – S/N of ellipsoidal variation S/Nellip.
| SWASP ID (1SWASP+) | Period (d) | Depth (mag) | Duration (h) | Epoch (245 0000+) | Nt | Δχ2 | Δχ2/Δχ2− | S/Nellip | Sred | Code |
| J113655.81+281708.5 | 0.960 430 | 0.0344 | 2.592 | 3127.5413 | 8 | 336.2065 | 5.3844 | 3.953 | 9.181 | P |
| J115418.56+351211.5 | 1.427 904 | 0.2355 | 2.184 | 3127.9543 | 6 | 1672.4440 | 14.0745 | 3.814 | 15.175 | |
| J115718.66+261906.1 | 1.226 804 | 0.0170 | 2.784 | 3128.1643 | 7 | 140.3018 | 7.6224 | 2.214 | 12.916 | |
| J120214.02+332920.4 | 2.589 406 | 0.1456 | 3.696 | 3126.5193 | 5 | 3569.5464 | 12.8868 | 2.515 | 10.962 | |
| J120933.96+335637.2 | 1.167 674 | 0.0278 | 2.040 | 3128.1484 | 8 | 1131.8057 | 1.5813 | 35.972 | 10.319 | A |
| J121653.45+263804.1 | 0.982 613 | 0.0301 | 1.152 | 3128.3462 | 3 | 90.3980 | 5.2886 | 1.985 | 12.937 | P |
| J122557.80+334651.1 | 1.362 462 | 0.0811 | 2.568 | 3127.7017 | 13 | 4330.1172 | 24.3831 | 15.725 | 14.670 | E |
| J122600.12+274221.5 | 1.366 517 | 0.0265 | 1.896 | 3127.6277 | 5 | 124.4934 | 2.7044 | 3.387 | 7.215 | R |
| J122640.99+310203.0 | 1.337 858 | 0.0139 | 1.368 | 3127.8386 | 7 | 63.7055 | 1.8859 | 0.133 | 10.476 | A |
| J122812.01+324132.3 | 3.090 437 | 0.0874 | 2.376 | 3126.7476 | 4 | 2586.7490 | 24.3444 | 11.980 | 20.691 | E |
| J124428.08+255631.5 | 2.763 064 | 0.0547 | 1.800 | 3127.8606 | 4 | 80.7336 | 1.6915 | 0.031 | 19.010 | A |
| J125704.45+320657.4 | 2.899 515 | 0.0196 | 2.688 | 3127.5493 | 6 | 36.5989 | 1.3138 | 1.670 | 8.645 | A |
| J130303.23+423223.7 | 2.858 061 | 0.0829 | 2.208 | 3125.7209 | 5 | 1505.2094 | 3.2609 | 5.610 | 10.246 | |
| J130322.00+350525.4 | 2.674 207 | 0.0179 | 3.264 | 3127.3608 | 6 | 304.3417 | 5.6491 | 2.001 | 8.467 | |
| J130409.52+201138.5 | 1.084 250 | 0.1161 | 1.200 | 3127.5449 | 10 | 1827.6654 | 12.9069 | 8.689 | 13.746 | E |
| J133022.79+330746.7 | 3.626 903 | 0.0863 | 2.568 | 3125.3120 | 5 | 1229.3250 | 35.5255 | 0.677 | 10.713 | |
| J133156.81+460026.6 | 3.166 482 | 0.0844 | 5.088 | 3128.2366 | 10 | 1924.8636 | 10.2625 | 5.186 | 12.102 | |
| J133623.52+283745.3 | 0.959 561 | 0.0586 | 2.712 | 3127.6365 | 25 | 3638.7996 | 8.4634 | 22.666 | 15.258 | P |
| J141558.71+400026.7 | 2.450 924 | 0.0397 | 1.632 | 3126.7324 | 8 | 281.4857 | 3.5665 | 2.999 | 13.474 | |
| J142947.03+230708.4 | 4.219 485 | 0.0868 | 2.976 | 3125.0061 | 8 | 2755.3987 | 32.1253 | 7.453 | 18.133 | |
| J144659.77+285248.3 | 3.798 768 | 0.1094 | 3.048 | 3125.3835 | 11 | 3284.5603 | 27.9419 | 4.250 | 20.591 | |
| J151508.36+301413.7 | 1.394 774 | 0.2315 | 2.280 | 3128.1123 | 15 | 13 151.5469 | 11.0242 | 8.328 | 23.730 | E |
| J152131.01+213521.3 | 1.338 018 | 0.0259 | 2.952 | 3127.7908 | 21 | 579.2580 | 7.1841 | 1.342 | 13.865 | |
| J152645.62+310204.3 | 1.409 102 | 0.0297 | 1.248 | 3127.3904 | 16 | 1648.0901 | 3.5165 | 13.729 | 12.944 | E |
| J153135.51+305957.1 | 4.467 224 | 0.0367 | 4.080 | 3128.3252 | 10 | 1652.4308 | 17.8900 | 5.468 | 18.038 | |
| J153741.83+344433.4 | 0.963 514 | 0.0296 | 1.320 | 3127.8230 | 24 | 253.6837 | 2.0412 | 2.376 | 19.644 | P |
| J160211.83+281010.4 | 3.941 554 | 0.0238 | 2.352 | 3127.0391 | 11 | 1176.7375 | 3.6554 | 1.896 | 13.653 | |
| J160242.43+290850.1 | 1.304 693 | 0.0454 | 1.872 | 3127.2471 | 23 | 1878.1125 | 2.5227 | 4.079 | 14.767 | |
| J160944.95+202609.7 | 1.644 243 | 0.0917 | 2.784 | 3127.7603 | 16 | 20 028.2793 | 25.3475 | 8.789 | 15.681 | E |
| J161644.68+200806.8 | 3.967 135 | 0.1608 | 4.176 | 3124.4480 | 8 | 3263.7249 | 32.0755 | 5.043 | 30.317 | |
| J161732.90+242119.0 | 1.453 738 | 0.0157 | 1.440 | 3127.6799 | 16 | 325.0795 | 4.4974 | 0.801 | 12.968 | |
| J162437.86+345723.8 | 4.423 851 | 0.0238 | 2.952 | 3124.5613 | 6 | 514.2166 | 11.8262 | 0.755 | 19.494 | |
| J163245.61+321754.9 | 3.538 188 | 0.0928 | 2.808 | 3128.3401 | 10 | 24 310.1016 | 72.4177 | 13.176 | 23.421 | E |
| J163844.53+411849.0 | 3.859 897 | 0.1098 | 3.552 | 3125.8313 | 10 | 7159.1206 | 26.1351 | 10.467 | 39.587 | E |
| J165424.59+241318.7 | 2.571 173 | 0.0434 | 2.160 | 3127.1179 | 14 | 755.8041 | 10.8147 | 2.247 | 16.440 | |
| J165949.13+265346.1 | 2.682 413 | 0.0206 | 1.848 | 3128.1721 | 11 | 957.7991 | 4.5615 | 14.616 | 14.128 | E |
The 18 candidates which passed through the second stage were then subjected to further analysis using vsi. These candidates are listed in Table 3 along with the relevant information extracted from vsi, including the number of brighter stars Nbri and fainter stars Nfai (<5 mag) within the 48-arcsec aperture. Since the Tycho-2 catalogue is incomplete below V∼ 11.5, the USNO-B1.0 catalogue is used to identify individual objects within the aperture. Two of the candidates were rejected due to their sharing the aperture with at least one brighter object. The colours from the photometric catalogues returned by vsi combined with the fit parameters provided by the detection algorithm are sufficient to calculate approximate values of stellar parameters for the host star. The code column of Table 3 shows that most of the candidates have a predicted planet size that is significantly larger than one would expect, and are therefore excluded from the final list.
List of candidates that passed the second stage tests and were subsequently subjected to catalogue-based tests, as described in Section 3.3. The rejection codes shown in the final column are as follows: (B) brighter object within the specified aperture, and (S) the estimated size (radius) of the planet. A total of six candidates passed all of the tests.
| SWASP ID (1SWASP+) | VSW | VSW−K | J−H | H−K | R★ (R⊙) | Rp (RJ) | ηp | Nbri | Nfai | Code |
| J115418.56+351211.5 | 12.994 | 1.16 | 0.329 | 0.070 | 1.00 | 5.47 | 0.64 | 0 | 1 | S |
| J115718.66+261906.1 | 11.116 | 1.06 | 0.177 | 0.037 | 1.32 | 1.55 | 1.06 | 0 | 2 | |
| J120214.02+332920.4 | 12.533 | 1.63 | 0.290 | 0.060 | 1.08 | 3.23 | 1.09 | 0 | 0 | S |
| J130303.23+423223.7 | 11.657 | 1.56 | 0.235 | 0.055 | 1.21 | 2.58 | 0.67 | 0 | 1 | S |
| J130322.00+350525.4 | 10.893 | 1.77 | 0.275 | 0.099 | 1.12 | 1.06 | 1.21 | 0 | 0 | |
| J133022.79+330746.7 | 12.529 | 1.78 | 0.268 | 0.081 | 1.12 | 2.33 | 0.76 | 0 | 0 | S |
| J133156.81+460026.6 | 12.627 | 2.13 | 0.466 | 0.104 | 0.78 | 1.98 | 1.73 | 0 | 1 | S |
| J141558.71+400026.7 | 12.393 | 1.44 | 0.211 | 0.063 | 1.25 | 1.90 | 0.53 | 0 | 0 | S |
| J142947.03+230708.4 | 12.149 | 1.57 | 0.281 | 0.060 | 1.10 | 2.61 | 0.79 | 0 | 0 | S |
| J144659.77+285248.3 | 12.726 | 1.73 | 0.286 | 0.084 | 1.08 | 2.68 | 0.86 | 0 | 1 | S |
| J152131.01+213521.3 | 12.188 | 1.36 | 0.240 | 0.046 | 1.19 | 1.62 | 1.17 | 0 | 1 | |
| J153135.51+305957.1 | 11.778 | 1.28 | 0.252 | 0.060 | 1.16 | 2.03 | 1.00 | 0 | 1 | S |
| J160211.83+281010.4 | 11.319 | 1.79 | 0.338 | 0.074 | 0.98 | 1.21 | 0.76 | 0 | 0 | |
| J160242.43+290850.1 | 12.417 | 1.99 | 0.380 | 0.051 | 0.91 | 1.53 | 0.88 | 0 | 1 | |
| J161644.68+200806.8 | 12.352 | 1.77 | 0.587 | 0.156 | 0.69 | 3.18 | 1.12 | 1 | 3 | B |
| J161732.90+242119.0 | 11.959 | 2.61 | 0.477 | 0.122 | 0.77 | 0.76 | 0.77 | 0 | 0 | |
| J162437.86+345723.8 | 10.764 | 1.19 | 0.200 | 0.072 | 1.28 | 1.71 | 0.75 | 0 | 1 | S |
| J165424.59+241318.7 | 12.774 | 1.19 | 0.351 | 0.099 | 0.96 | 2.31 | 0.63 | 1 | 3 | B |
Shown in Fig. 2 is a plot of the depth produced by orbiting extrasolar planets of radii 0.5, 1.0, and 1.5RJ as a function of stellar radius. The transit candidates from Table 3 are shown in the plot: the surviving candidates as the solid five-pointed stars and the rejected candidates as the open circles. The candidate host stars are predominantly F–G–K stars as expected of the spectral distribution amongst field stars; hence, there does not appear to be a significant bias towards early- or late-type stars. Therefore, although bloated gas-giant planets transiting late-type stars can result in transit depths of ∼25 per cent, these kinds of detections from wide-field surveys such as SuperWASP will be quite rare.

The transit depth for planets of radii 0.5, 1.0 and 1.5RJ as a function of stellar radius. The rejected transit candidates from Table 3 are shown on the diagram as the open circles and the final accepted candidates are shown as the solid five-pointed stars.
4.2 Transit candidates
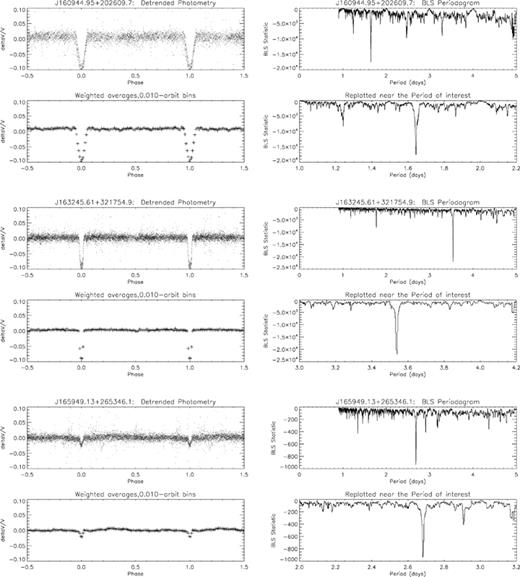
Presented here is a brief discussion for each of the six surviving candidates from the third stage of the transit-sifting process. The detrended and phase-folded light curves of these candidates along with their respective BLS periodograms are shown in Figs 3 and 4. These figures also include phase-binned average light curves weighted by 1/σ2i, where σ2i is the total estimated variance on each data point.

Final transit candidates 1–3, showing the unbinned and binned light curves (left-hand panel) and the BLS periodograms (right-hand panel).

Final transit candidates 4–6, showing the unbinned and binned light curves (left-hand panel) and the BLS periodograms (right-hand panel).
1SWASP J115718.66+261906.1. This candidate has seven transits observed with a period of ∼1.22 d (the shortest period of the final candidates) and a 2.78 h duration. However, the periodogram reveals that there are significant peaks at longer periods, especially at 2.45 d. There is a relatively large amount of scatter in the light curve and the S/N of the ellipsoidal variation S/Nellip is barely inside the rejection cut-off. It should also be noted that there are two fainter objects within the 48-arcsec aperture. Even so, the light curve exhibits a flat-bottomed transit and flat out-of-transit behaviour. The estimates of the host spectral type and transit depth indicate a planet size of 1.55RJ.
1SWASP J130322.00+350525.4. This is the brightest of the final candidates although only six transits were observed during the 2004 campaign. The period of ∼2.67 d is well matched with the 3.26 h duration according to the value of ηp. The low value of S/Nellip indicates that there is almost no ellipsoidal variation and is further strengthened by the lack of any faint companions within the aperture. The estimated size of the planet is 1.06RJ. The transit appears to be ‘V-shaped’, however, so there is still a strong chance of this transit candidate being a grazing eclipsing binary. Also, the lack of transits causes the period determination to be relatively uncertain, as evidenced by the lack of a strongly unique Fourier power in the periodogram.
1SWASP J152131.01+213521.3. This candidate is the faintest to meet all of the selection criteria. A total of 21 transits were observed, however, resulting in a very strong peak in the periodogram at a period of ∼1.34 d. The ellipsoidal variation is very low, the Sred is very high, and the transit is flat-bottomed. The estimate of the planetary radius in this case is 1.62RJ, which is slightly above the radius cut-off described in Section 3.3 but the other positive attributes of the candidate justified its inclusion in the final list.
1SWASP J160211.83+281010.4. This candidate is in fact the known transiting planet XO-1b, which was discovered by McCullough et al. (2006). It is encouraging that this planet was detected with a high degree of confidence (high Δχ2) by the detection algorithm, for which 11 transits were observed. The vsi analysis detected no brighter or fainter companions within the aperture. The orbital period of 3.94 d and estimated radius of 1.21RJ are in good agreement with the values reported by McCullough et al. (2006). A more detailed analysis of the SuperWASP-N XO-1b data may be found in Wilson et al. (2006).
1SWASP J160242.43+290850.1. This relatively faint candidate has 23 observed transits with a best-fitting period of ∼1.30 d and a duration of 1.87 h. Based on the spectral type of the host star, the estimated radius of the planet is 1.53RJ. However, there is a fainter object within the aperture and the transit is ‘V-shaped’ which means that this is possibly due to a grazing eclipsing binary rather than a true planetary transit. Additionally, there is a second dominant peak in the periodogram at ∼2.61 d. Folding the data on this longer period reveals two eclipses of slightly different depths. This further evidence indicates that this candidate is most likely not due to a planet.
1SWASP J161732.90+242119.0. There are 16 transits observed for this candidate with a period of ∼1.45 d and a duration of 1.44 h. The ellipsoidal variation is extremely low and there are no detected faint companions within the aperture. The large colour index of this star indicates a late-K spectral type which leads to a relatively small estimate for the planet radius of 0.76RJ. The promising nature of this candidate led to spectroscopic follow-up observations, described in Section 4.3.
4.3 Follow-up of transit candidates
The major source of transit mimics amongst candidates is eclipsing binaries. These can be either grazing eclipsers of ∼1 per cent depth or blended eclipsers contributing ∼1 per cent of light (Brown 2003). Wide-field surveys such as SuperWASP and WASP0 generally suffer from heavily undersampled stellar profiles due to the large pixel sizes. In most cases, eclipsing binaries can be excluded through photometric analysis, the catalogue queries provided by vsi, or straightforward multicolour observations using a higher angular resolution telescope to resolve blended objects.
The techniques described in Section 3 were used on all the SuperWASP-N 2004 fields to construct a list of high-priority candidates. Further study of these candidates required precision radial velocity measurements to test the planet hypothesis of the observed transit events. A sample of the high-priority candidates were subsequently observed using the SOPHIE cross-dispersed echelle spectrograph on the 1.93-m telescope at the Observatoire de Haute-Provence (Collier Cameron et al. 2007a). SOPHIE achieved first light on 2006 July 31, and so the follow-up campaign undertaken by the SuperWASP consortium was amongst the first science applications of the instrument.
Amongst these candidates observed during these runs was the last of the candidates shown in Table 4: 1SWASP J161732.90+242119.0. A single narrow-lined cross-correlation function was observed for each of the spectra obtained. Evidence of pressure broadening was seen in the Na i D and Mg i D lines with slight asymmetry and redshifted emission in the Hα line. A radial velocity variation of only a few m s−1 determined from three spectra was used to conclude that there is no significant evidence of radial velocity induced behaviour due to the presence of a planet. Hence, this candidate has been ruled out as a transiting planet from the SOPHIE observations. The remainder of the candidates have been assigned priorities and await further observations.
The final list of candidates that passed all of the selection criteria, including the errors on the major fit parameters.
| SWASP ID (1SWASP+) | Period (d) | Depth (mag) | Duration (h) | Epoch (245 0000+) |
| J115718.66+261906.1 | 1.226 804 ± 0.000 128 | 0.0170 ± 0.0014 | 2.784 ± 0.006 | 3128.1643 ± 0.0031 |
| J130322.00+350525.4 | 2.674 207 ± 0.000 203 | 0.0179 ± 0.0010 | 3.264 ± 0.005 | 3127.3608 ± 0.0025 |
| J152131.01+213521.3 | 1.338 018 ± 0.000 041 | 0.0259 ± 0.0010 | 2.952 ± 0.003 | 3127.7908 ± 0.0017 |
| J160211.83+281010.4 | 3.941 554 ± 0.000 079 | 0.0238 ± 0.0007 | 2.352 ± 0.003 | 3127.0391 ± 0.0012 |
| J160242.43+290850.1 | 1.304 693 ± 0.000 014 | 0.0454 ± 0.0010 | 1.872 ± 0.001 | 3127.2471 ± 0.0007 |
| J161732.90+242119.0 | 1.453 738 ± 0.000 030 | 0.0157 ± 0.0008 | 1.440 ± 0.002 | 3127.6799 ± 0.0012 |
4.4 Rejected candidates
Presented here is a brief discussion for a subset of the rejected candidates shown in Tables 2 and 3. The purpose of this discussion is to highlight the quality of these candidates and hence the potential for false-alarms being needlessly observed with spectroscopic follow-up. The light curves and BLS periodigrams for these six examples are shown in Figs 5 and 6. These exhibit strong transit-like signatures but the information available for the majority of the rejected candidates from stages two and three of the sifting process indicated that the size of the secondary is too large to be a planetary companion.
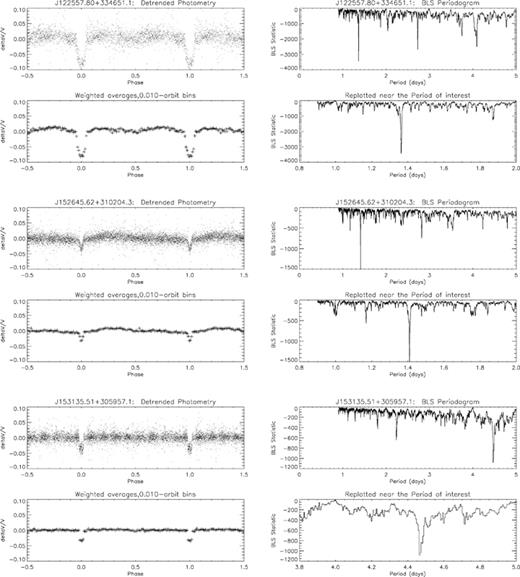
Example rejected candidates, showing the unbinned and binned light curves (left-hand panel) and the BLS periodograms (right-hand panel).
Example rejected candidates, showing the unbinned and binned light curves (left-hand panel) and the BLS periodograms (right-hand panel).
1SWASP J122557.80+334651.1. This candidate was very high in the list from the 12h fields, as can be seen from the high Δχ2 in Table 2. A total of 13 transits were observed and folding the data on the strongest periodogram peak ∼1.36 d yields a flat-bottomed transit light curve, as shown in Fig. 5. However, binning the data reveals the out-of-eclipse variation which is further supported by the high value of S/Nellip, although the value of Δχ2/Δχ2− is very high due to the depth of the eclipse. This candidate was rejected on the basis of its high ellipsoidal variation.
1SWASP J152645.62+310204.3. A total of 16 transits observed with a well-constrained period of ∼1.41 d favoured this candidate. A relatively high ellipsoidal variation, however, excluded this candidate from passing through the second stage of selection criteria. Indeed, the out-of-eclipse variation becomes especially apparent when the data are binned.
1SWASP J153135.51+305957.1. This appears to be a promising candidate with a strong Sred and 10 transits observed. The flat-bottomed transits in the light curve folded on a period of ∼4.47 d appear to be very convincing and the candidate passed through to the third stage of candidate sifting. Even though the exoplanetary diagnostic ηp is unity for this candidate, the estimated size of the planet based on the spectral type is 2.03RJ and so was excluded from appearing in the final list. A brown dwarf companion, though possible, is only likely for relatively young ages where ongoing contraction allows for a large radius (Stassun, Mathieu & Valenti 2006). Detection of low-mass stellar companions such as OGLE-TR-122b (Pont et al. 2005) and HAT-TR-205-103 (Beatty et al. 2007) has shown that even low-mass stars can have radii comparable to or even less than giant planets. This target will be the subject of further observations in a low-mass eclipsing binary study.
1SWASP J160944.95+202609.7. A large transit depth, or which 16 were observed, contributed to this star having a very high Δχ2 and Δχ2/Δχ2−. Additionally, the period of ∼1.64 d is well determined by the strong peak in the periodogram. However, the transits are distinctly ‘V-shaped’ in appearance and the ellipsoidal variation is slightly too large to prevent exclusion from the list of candidates.
1SWASP J163245.61+321754.9. This candidate was one of the strongest candidates selected by the detection algorithm and the subsequent visual inspection. The Δχ2, Δχ2/Δχ2− and Sred are all exceptionally high. Indeed, the relative strength of the primary peak in the periodogram at a period of ∼3.54 d is striking. The transits are flat-bottomed and there is little evidence of out-of-eclipse variation for the 10 eclipses observed, although there is slight evidence for a secondary eclipse in the binned light curve. The measured ellipsoidal variation for this star is more than enough for it to be excluded from the candidate list, strengthening the case of this candidate being an eclipsing binary star.
1SWASP J165949.13+265346.1. This light curve is a good example of a transit mimic in that it is a subtle dip in the light curve with a small depth, which is generally the signature one would expect from a transiting planet. The 11 observed transits folded on the period of ∼2.68 d look convincing even when binned. However, once again the ellipsoidal variation reveals that this star is also likely to be either a blend of an eclipsing binary or a grazing eclipsing binary system.
5 DISCUSSION
The preceding sections have described how 130 566 stars were extracted from 729 335 for transit searching, and how the yield of 5445 candidates was reduced to a list of six candidates through the stringent selection criteria. The criteria were largely designed to aggressively remove the primary source of false-alarms, eclipsing binary stars, from the candidate list. In this sense, the criteria proved to be very successful since, for example, the ellipsoidal variation criteria dealt with a devastating blow against the kinds of false-alarms during the second stage and was the major cause for elimination. Though this removed some very promising candidates from the list, the evidence presented by a closer examination of a subset of the rejected candidates shows that there is indeed clear eclipsing binary behaviour in the binned light curves, if not in the unbinned data. The major source of elimination during the third stage of candidate sifting was an excessive estimate of the planet size, also generally due to an eclipsing binary star. Some flexibility was allowed in the size criteria, particularly in view of the recent detection of the large exoplanet TrES-4 (Mandushev et al. 2007).
The detection of XO-1b by the transit-detection algorithm and the subsequent passing of all the selection criteria is an important test for the transit-sifting process. However, the recent discovery of HAT-P-3b (Torres et al. 2007) was the cause for concern since it was observed in one of the 13h fields and has the identifier 1SWASP J134422.58+480143.2. The period of ∼2.9 d is within the parameter space which was searched by the detection algorithm. Based on the ephemeris information provided by Torres et al. (2007), the star was observed numerous times by SuperWASP-N during at least five predicted transits during the 2004 observing season. However, an examination of the data shows that the S/N for this star is exceptionally low which resulted in a correspondingly low Δχ2 during the fitting process. Combining the data with those from the 2006/2007 seasons will undoubtedly yield a better result for this star.
Considering the large amount of sky surveyed in the RA range presented in this paper, it is worth investigating the number of extrasolar planet candidates one should expect and the practical limitations on achieving this number. An analysis of radial velocity surveys such as Santos et al. (2003) and Fischer & Valenti (2005) has shown that planet host stars are preferentially higher in metallicity. The field stars surveyed in these fields are predominantly F–G–K dwarfs in the solar neighbourhood and so solar metallicity is a reasonable approximation. Based on the Besançon model (Robin et al. 2003) constructed by Smith et al. (2006), ∼46 per cent of the stars in typical SuperWASP fields are of F–G–K type and are therefore of small enough size to produce detectable transit dips. Out of the 130 566 stars in the 06h–16h fields searched for transits, around 60 000 stars will meet these criteria.
It has been noted before by such papers as Kane et al. (2005) that the frequency of hot Jupiters and the geometric consideration of randomly oriented orbits will result in ∼0.1 per cent of stars having an observable transiting planet in a 1 < P < 5 d orbit. This produces an estimate of 60 transit candidates for the fields considered in this paper. However, despite the large amount of sky coverage in the 06h–16h RA range and the correspondingly large amount of stars monitored, the largest constraint on these data is the lack of baseline coverage which severely impedes the ability to detect multiple transits. The probability plots shown in Fig. 1 demonstrate this clearly with even the 14h fields only having a 20 per cent chance of observing four transits of a 5 d period planet. Given this limitation for transit hunting in this data set, the final number of six transit candidates is not an unreasonable detection rate. The eventual combination of several years of SuperWASP data will greatly help to alleviate this deficiency for this particular RA range.
Though the criteria used to remove eclipsing binary stars were generally very successful, the problem of blended eclipsing binaries (as discussed by Brown 2003) is more difficult to solve. O'Donovan et al. (2006) gives a particularly tricky example in which the light from a K dwarf binary system was blended with the light from a late F dwarf star. Avoiding confusion with these kinds of systems requires the use of careful spectroscopic follow-up to identify blended light. The strategy adopted for SuperWASP targets was to obtain high-resolution spectroscopic snapshots of high-priority candidates for fast and efficient elimination of blends (described in detail by Street et al. 2007; Lister et al. 2007). The follow-up campaign during 2006/2007 is continued photometric monitoring, medium-resolution spectra for blend elimination, two-colour precision photometry at the predicted times of transit, and finally precision radial velocity monitoring using such instruments as SOPHIE.
6 CONCLUSIONS
This paper has described the acquisition, analysis, and results from the transit-hunting SuperWASP-N 2004 observing campaign covering a right ascension range of 06h < RA < 16h. Even though 56 fields were monitored during this campaign, the lack of baseline coverage resulted in the rejection of 23 fields from which 130 566 stars were extracted to be searched for transit signatures. The selection criteria which were applied to the resulting candidates proved to be exceptionally powerful at removing eclipsing binaries from the candidate list due to the ellipsoidal variations and the estimated planet size based on the transit depth. Amongst the final candidates is the known transiting planet XO-1b which further demonstrates the strength of the transit-sifting process.
From the final list of six transit candidates, the photometry alone indicates that 1SWASP J160242.43+290850.1 is in fact likely to be the signature of a eclipsing binary rather than a planet. Furthermore, follow-up spectroscopy of 1SWASP J161732.90+242119.0 shows that there is no significant radial velocity variation, resulting in its rejection as a planet candidate. Further follow-up observations, both photometric and spectroscopic, are being undertaken for these and other fields from the 2004 SuperWASP observing campaign. However, the real strength of the 06h–16h range will be realized when the 2004 data are combined with those of subsequent years to create an exceptional baseline for transit hunting.
The WASP consortium consists of representatives from the Queen's University Belfast, University of Cambridge (Wide Field Astronomy Unit), Instituto de Astrofísica de Canarias, Isaac Newton Group of Telescopes (La Palma), University of Keele, University of Leicester, Open University, and the University of St Andrews. The SuperWASP-N instrument was constructed and operated with funds made available from the Consortium Universities and the Particle Physics and Astronomy Research Council. SuperWASP-N is located in the Spanish Roque de Los Muchachos Observatory on La Palma, Canary Islands which is operated by the Instituto de Astrofísica de Canarias (IAC). The data reduction and analysis described in this paper made extensive use of the Starlink Software Collection, without which this project would not have been possible. This research also made use of the SIMBAD data base and VIZIER catalogue service, operated at CDS, Strasbourg, France. In addition, we made use of data products from 2MASS, which is a joint project of the University of Massachusetts and the Infrared Processing and Analysis Centre/California Institute of Technology, funded by the National Aeronautics and Space Administration and the National Science Foundation.
REFERENCES
