


Abstract
We revisit the polarization induced by Faraday rotation when cosmic microwave background photons traverse magnetized plasma. We compute the secondary B-mode angular power spectrum from Faraday rotation due to magnetic fields in galaxies and galaxy clusters with masses ranging from 1011 to 1016.5M⊙. We investigate its dependence on the electron and the magnetic field profiles. Namely we consider both the β-profile of electron density as well as an electron density distribution based on the Navarro–Frenk–White dark matter profile. We model the magnetic field structure in galaxies and clusters motivated by recent observations. We further account for its redshift evolution and we examine the importance of its coherence length. We find that the B-mode polarization from Faraday rotation depends on the normalization parameter Cl∝σ58–σ68. At 30 GHz for σ8= 0.8, the B modes from Faraday rotation range between 0.01 and 4 × 10⁻³μK2 at l= 104 in the case of a maximally coherent fields. For smaller coherence lengths, those amplitudes are smaller and they peak at higher multipoles.
1 INTRODUCTION
Recent cosmic microwave background (CMB) observations allowed significant progress in cosmology. The CMB temperature anisotropies have been measured in detail and, as a result, we know that the universe is spatially flat and that the power spectrum of the density fluctuations is consistent with scale invariance (Spergel et al. 2006), strongly supporting the inflation scenario.
One of the main targets for the next generation of CMB observations is the detailed measurement of the CMB polarization. The CMB polarization is traditionally split into two components: E and B modes (Kamionkowski, Kosowsky & Stebbins 1997b; Zaldarriaga & Seljak 1997). Particularly, the detection of the B-mode polarization is important for further testing the inflation scenario. Gravitational waves, predicted by inflation scenario but not detected yet, generate the primordial B-mode polarization, while the density fluctuations do not (Kamionkowski, Kosowsky & Stebbins 1997a; Seljak & Zaldarriaga 1997). Therefore, the measurement of B-mode polarization is an essential step towards constraining the inflationary scenario.
However, there are other sources of B-mode polarization. One of them is gravitational lensing (Zaldarriaga & Seljak 1997). Gravitational lensing distorts the CMB polarization fields so that a secondary B-mode polarization is induced from the primary E-mode polarization. These secondary B modes contaminate the primary B-mode polarization. However, significant effort has been made to find ways how to remove the secondary B-mode polarization due to gravitational lensing from the polarization maps (see e.g. Hu & Okamoto 2002; Hirata & Seljak 2003), in order to recover the primordial B-mode angular power spectrum with high accuracy.
The presence of cosmic magnetic fields, observed on various scales, is also an important source for both primary and secondary B-mode polarization. The main ways of detection and measurement of magnetic fields are Zeeman splitting effect, synchrotron emission and Faraday rotation. Zeeman splitting provides direct observation of magnetic fields. However, the signal is so small with respect to Doppler broadening that it is essentially useless in the cosmological context where magnetic fields are week and velocities are high. Extragalactic magnetic fields are mainly detected by the other two methods. The amplitude of the fields measured in galaxies and galaxy clusters are typically of the order of 1–10 μG. These methods only provide information on magnetic fields integrated along the line of sight. Nevertheless, in conjunction with complementary measurements (electron number density), they have been successfully applied to show that the coherence length of magnetic fields can be as large as cluster scales, or even bigger (Kim et al. 1989). Similarly, magnetic fields have been measured with the same amplitudes in high-redshift objects at z > 2 (Athreya et al. 1998).
Although magnetic fields are observed on all scales with increasing accuracy, we still do not know where they originated from. Primordial magnetic fields are one of the candidates for the origin of magnetic fields in galaxies and galaxy clusters. Primordial magnetic fields act as sources of the primary B-mode polarization by generating vorticity in the cosmic plasma and additional gravitational waves (Seshadri & Subramanian 2001; Mack, Kahniashvili & Kosowsky 2002; Subramanian, Seshadri & Barrow 2003; Lewis 2004; Tashiro, Sugiyama & Banerjee 2006). However, those waves arise on small scales and therefore do not interfere with the detection of the polarization due to inflation-generated gravitational waves.
Magnetic fields also create B-mode polarization by Faraday rotation, i.e. the rotation of the linear polarization plane through the interaction between CMB photons and magnetized plasma along their path. Faraday rotation distorts the CMB polarization fields like gravitational lensing, so that it induces B-mode polarization from the E modes. The effects of Faraday rotation due to primordial magnetic fields were investigated in some papers (Scóccola, Harari & Mollerach 2004; Kosowsky et al. 2005). In addition to primordial magnetic fields, extragalactic magnetic fields of several μG (Carilli & Taylor 2002) will produce Faraday rotation and therefore add to the B-mode polarization. This effect was first studied by Takada, Ohno & Sugiyama (2001) who investigated the B-mode polarization due to Faraday rotation in galaxy clusters. They found that homogeneous magnetic fields of several μG produce 1-μK B-mode polarization around l= 1000. However, it has been shown that magnetic fields in galaxy clusters are not uniform (see Murgia et al. 2004 and references therein). The radial profile of the magnetic fields may affect the B-mode polarization maps on small scales. Ohno et al. (2003) discuss the possibility of the reconstruction of the magnetic fields in a galaxy cluster from the B-mode polarization map via the Sunyaev–Zel'dovich (SZ) effect and X-ray emission.
In this paper, we revisit the secondary B-mode polarization from Faraday rotation in galaxy clusters. We complete the study by taking into account galaxies as well. In spiral galaxies, observations show that the magnetic fields spread widely not only in the galactic plane but also over the halo, with an average amplitude of about 10 μG (Hummel, Beck & Dahlem 1991). Even in elliptical galaxies, magnetic fields corresponding to many μG are observed (Greenfield, Roberts & Burke 1985).
The paper is organized as follows. In Section 2, we introduce the formalism of the power spectrum for the Faraday rotation angle and we derive the angular power spectrum of B-mode polarization due to Faraday rotation. In Section 3, we discuss the two different profiles of gas density and magnetic fields that we use, motivated by observations and numerical simulations. In Section 4, the resulting B-mode polarization angular power spectrum is shown, taking into account the effects of both galaxies and galaxy clusters. Section 5 is devoted to discussions and summary. Throughout the paper, we use the Wilkinson Microwave Anisotropy Probe (WMAP) values of cosmological parameters, i.e. h= 0.73 (H0=h× 100 km s−1Mpc−1), T0= 2.725 K, h2Ωb= 0.0223 and h2Ωm= 0.128 (Spergel et al. 2006).
2 POLARIZATION ANGULAR POWER SPECTRUM FROM FARADAY ROTATION
2.1 Angular power spectrum of the rotation angle
Our aim is to calculate the angular power spectrum of the CMB polarization produced by Faraday rotation on the galaxy and galaxy cluster scales. To do so, we first need to compute the angular power spectrum of the rotation angle.
 and
and  are the directions of the line of sight and the magnetic field, respectively.


 and we take p≈ 0.3, q= 0.75 (Cooray & Sheth 2002). In equation (4), we use the linear bias described as b(M, z) = 1 +qν− 1/δc+ 2p/δc(1 + (qν)p) (Scoccimarro et al. 2001).
 . This means that the coherence length of magnetic fields is the virial radius and the orientation of the magnetic fields is random from structure to structure. We discuss the case of different coherence lengths in Section 4.2.
2.2 B-mode polarization from Faraday rotation
 direction, Q is the difference between the intensity in
  and
and  directions, and U is the difference between intensities in directions obtained by rotating
  and
and  by 45°. If the CMB radiation passes through a magnetized plasma, it undergoes Faraday rotation by an angle α (equation 1). The Stokes parameters after passing through the plasma can be written as


3 GAS AND MAGNETIC FIELD DISTRIBUTION IN COLLAPSED OBJECTS
In order to evaluate Faraday rotation on the galaxy or galaxy cluster scales, we need the distributions of the electron number density and the magnetic field strength.
3.1 Gas distribution
As for the electron number density, we will consider two cases.
3.1.1 β-profile
3.1.2 Navarro–Frenk–White profile
We also consider a different electron density profile from the β-profile. Namely we use a density profile motivated by the Navarro–Frenk–White (NFW) dark matter profile (Navarro, Frenk & White 1997).


3.2 Magnetic field distribution
 . Assuming typical magnetic field amplitudes of 3 and 10 μG for clusters and galaxies, respectively, we model the magnetic field growth by
4 RESULTS
In order to evaluate the effect of Faraday rotation due to galaxies and galaxy clusters on CMB polarization, we arbitrarily consider that the contribution from galaxies is associated with haloes of mass lower than 1013M⊙. Objects with halo masses larger than this limit are considered as galaxy clusters. The particle number density in galaxies is higher than that in galaxy clusters. Moreover, in cold dark matter scenario, the number density of galaxies is higher than that of galaxy clusters. Therefore the Faraday rotation produced in galaxies presumably cannot be neglected against that generated in galaxy clusters.
4.1 Rotation angle power spectrum
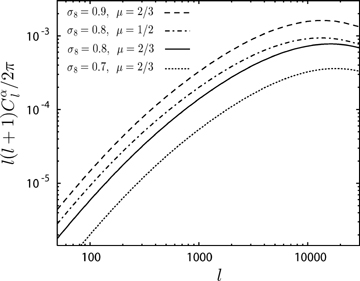
In Fig. 1, we show the angular power spectrum of the Faraday rotation angle due to galaxy clusters only. We assume that their mass range is between 1013 and 1016.5M⊙ and that all clusters follow the β-profile with a magnetic field distributed following equation (28) and Bc= 3 μG. We checked that the Poisson term in equation (2) dominates in the mass region of galaxy clusters. The contribution from correlated haloes is thus neglected. We note that increasing β increases the amplitude of the power spectrum and shifts its peak to smaller angular scales. This is because large β value gives steeper profiles and smaller core radii. The magnetic field profile also affects the angular power spectrum. However, this dependence is weaker than that of the electron density profile. Fig. 2 shows the dependence of the angular power spectrum on the normalization of the density fluctuation σ8. We find l2Cl∝σ58 somewhat different from the SZ case (Komatsu & Seljak 2002). We compared this result with that of Takada et al. (2001) and found it in general agreement. The location of the peaks in our case and their case is slightly different. This can be explained by the fact that we take into account distribution of the magnetic fields with central peak, while Takada et al. (2001) consider homogeneous magnetic fields over the whole cluster scale.
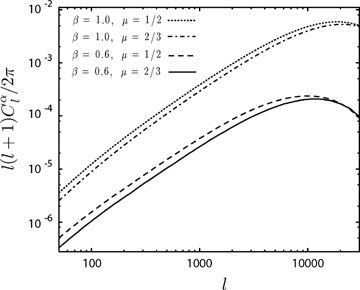
The power spectra of Faraday rotation angle caused by 3 μG magnetic fields in galaxy clusters for the β-model case. The solid line is for β= 0.6 and μ= 2/3 and the dashed line is for β= 0.6 and μ= 1/2. We also plot the case of β= 1.0 and μ= 1/2, and β= 1.0 and μ= 2/3 as a dotted line and a dash–dotted line, respectively. We use σ8= 0.8 and set the CMB frequency to 30 GHz.
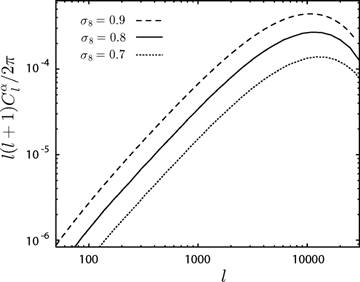
The dependence on the density fluctuation amplitude of the power spectra of Faraday rotation angle. We choose 30 GHz as the CMB frequency and adopt the β-profile with β= 0.6, μ= 2/3 and a 3 μG magnetic field. The dashed, the solid, the dotted lines are σ= 0.9, 0.8 and 0.7, respectively.
In Fig. 3, we represent the redshift distribution of Cl, d ln Cl/d ln z, for different l values. The power spectrum of the rotation angle on large scales (small l) is mostly due to lower redshift galaxy clusters. The rotation angle strongly depends on the frequency (see equation 1). As a result, low-redshift clusters have a larger contribution to Cl than in the SZ effect. For example, while most of the contribution at l= 10 000 in the SZ power spectrum comes from galaxy clusters at redshift z= 2 (Komatsu & Seljak 2002), the power spectrum of the Faraday rotation angle at the same multipole is associated with galaxy clusters at redshift z= 1. On scales below l= 100, the contribution to the rotation angle Cl from galaxy clusters at redshift lower than z= 0.01 is large. The angular distance of the redshift z= 0.01 is about 40 Mpc while the virial radius of the galaxy cluster with mass 1013M⊙ is about 2 Mpc. This means that the small angle approximation used in equation (6) is not valid at l < 100. Similarly, we plot the mass distribution of Cl for different l values, d ln Cl/d ln M, in Fig. 4. For all l values, the main contribution is due to galaxy clusters with masses between 1013 and 1014M⊙. The amplitude of the rotation angle power spectrum at multipoles larger than l= 5000 is mostly due to clusters with 1013M⊙. Comparing the mass contribution of the SZ effect (Komatsu & Seljak 2002), we find that the Faraday rotation angle is less affected by the massive haloes. This is because the high-redshift clusters do not contribute significantly to the amplitude of the Faraday rotation spectrum (see discussion on the redshift dependence above).
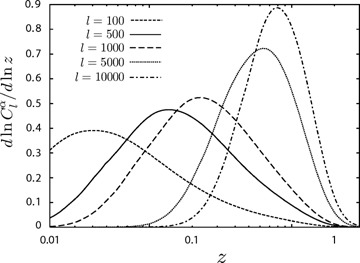
The redshift contribution for various l modes. The short-dashed, the solid, the long-dashed and the dash–dotted lines represent l= 100, 500, 1000, 5000 and 10 000, respectively. This figure is calculated for the β-profile with β= 0.6 and μ= 2/3 and a 3 μG magnetic field.
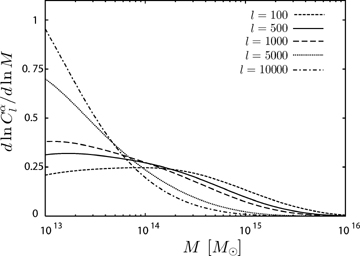
The mass contribution for various l modes. The short-dashed, the solid, the long-dashed and the dash–dotted lines represent l= 100, 500, 1000, 5000 and 10 000, respectively. This figure is calculated for the β-profile with β= 0.6 and μ= 2/3 and a 3 μG magnetic field.
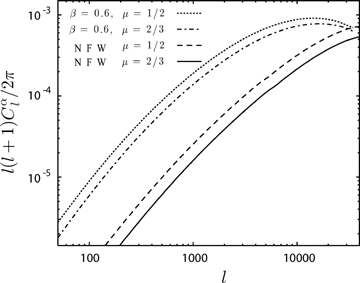
If we take into account the contribution from the whole population of structure including galaxy clusters and galaxies we obtain the results shown in Fig. 5. We calculate both Poisson and halo–halo correlation terms in equation (2) in the mass range 1011≤M < 1013M⊙. In the mass range of clusters 1013≤M < 1016.5M⊙, we neglect the halo–halo correlation term as mentioned previously. The peak of the power spectrum is shifted to smaller angular scales (l= 20 000) because of the contribution from galaxies. In Fig. 5, we use β= 0.6 and check that varying μ in equation (28) does not modify significantly the power spectrum. We also compare the results with different normalization parameters. The dependence of the amplitude of the rotation measurement is approximately l2Cl∝σ5.58–σ68. The redshift distribution for the power spectrum computed using the β-profile is given in Fig. 6. It also takes into account the evolution of magnetic field equation (30) which influences the redshift distribution. The contribution of high-redshift objects (mainly galaxies) is suppressed for z > 1. Moreover the redshift distribution at high multipoles is shifted to lower z (see dot–dashed line in Fig. 6). Most of the Faraday rotation-induced signal is thus due to low-redshift objects. If we now explore the mass distribution of Cl for different l (Fig. 7), we notice that the contribution from galaxies (left-hand panel) overwhelms that of galaxy clusters (right-hand panel). We also note the difference in amplitudes between the two panels is mainly due to the difference in magnetic field strength between galaxy clusters (3 μG) and galaxies (10 μG) described in equation (30).
The angular power spectra of Faraday rotation angle caused by galaxy clusters and galaxies. The solid line is the case of the β-profile with β= 0.6 and μ= 2/3 and the dash–dotted line is the case of the β-profile with β= 0.6 and μ= 1/2. Both are calculated using σ8= 0.8. The dashed and the dotted lines are plotted as the case of σ8= 0.9 and 0.7, respectively. In all plots, the CMB frequency is 30 GHz.
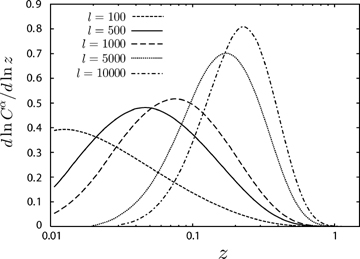
The redshift contribution to various l modes. The short-dashed the solid, the long-dashed and the dash–dotted lines represents l= 100, 500, 1000, 5000 and 10 000, respectively. This figure is calculated in the β-profile with β= 0.6 and μ= 2/3.
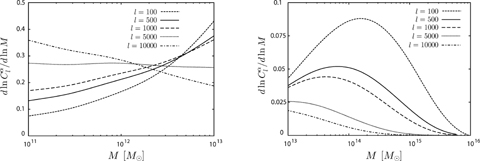
The mass contribution to various l modes. The left-hand panel shows the contribution from the galaxy mass range while the right-hand panel shows that of the galaxy cluster mass range. The short-dashed the solid, the long-dashed and the dash–dotted lines represent l= 100, 500, 1000, 5000 and 10 000, respectively. This figure is calculated for the β-profile with β= 0.6 and μ= 2/3.
Now, following the same approach as for the β-model, we compute the angular power spectrum of Faraday rotation angle for the NFW profile given in Fig. 8. In this plot, we show the results at 30 GHz, and we assume that the magnetic field distribution within clusters or galaxies writes as equation (29). For comparison, we plot in the same figure the angular power spectrum for the β-profile and magnetic field given by equation (28). The NFW profile is more peaked than the β-profile. As a result, the power spectrum using the NFW profile is shifted to smaller scale (multipoles larger than 30 000) as compared to those of β-profile.
The angular power spectra of Faraday rotation angle by galaxy clusters and galaxies at 30-GHz CMB frequency. The solid line is the NFW case with magnetic fields frozen into matter, μ= 2/3, and the dashed line is the NFW case with magnetic fields which energy density decrease outward like the electron distribution. We also plot the β-profile cases with μ= 2/3 and 1/2 as the dash–dotted and the dotted lines, respectively.
4.2 Polarization power spectrum
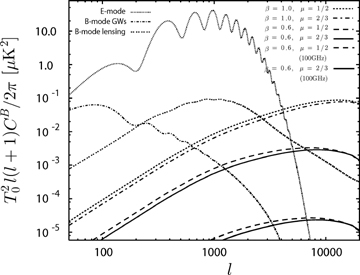
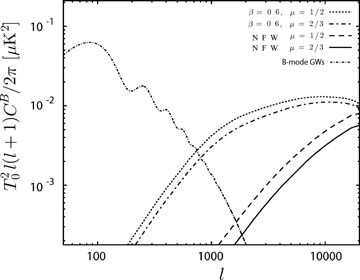
The angular power spectra of the B-mode CMB polarization caused by Faraday rotation for the β-model. The solid line is for β= 0.6 and μ= 2/3 the dashed line is for β= 0.6 and μ= 1/2, the dash–dotted line β= 0.6 and μ= 2/3 and the dotted line is for β= 1.0 and μ= 1/2. We use σ8= 0.8 and set the CMB frequency to 30 GHz. For comparison, we plot, for 100 GHz, the spectrum for β= 0.6 and μ= 2/3 (thick solid line), and for β= 0.6 and μ= 2/3 (thick dashed line). We also give the power spectra of the primordial E-mode polarization, the B-mode polarization caused by gravitational waves with a tensor to scalar ratio r= 0.6, and the gravitational lensing B-mode polarization.
For comparison, we plot in the same figure the power spectrum of the primary E-mode polarization (thin dotted line), the B-mode polarization due to the gravitational waves (thin dot–dashed line) and the lensing B-mode polarization (thin dot–dotted line). The polarization from gravitational waves is computed with a tensor to scalar ratio r= 0.6 which is the upper limit from the WMAP three years data (Spergel et al. 2006). This signal dominates on large angular scales. On small scales, the power spectrum of the polarization caused by Faraday rotation dominates the B-mode polarization due to gravitational lensing at frequencies lower than 30 GHz, for reasonable values of the cluster magnetic field. When the frequency increases, the gravitational lensing B-mode polarization dominates. We plot the power spectrum of the Faraday induced polarization for different parameters β and μ describing the electron density and the magnetic field profiles (see line styles in caption). Similarly to the rotation angle power spectrum Fig. 1, we note that varying μ has very little effect whereas varying β changes the amplitude of the power spectrum by two orders of magnitude.
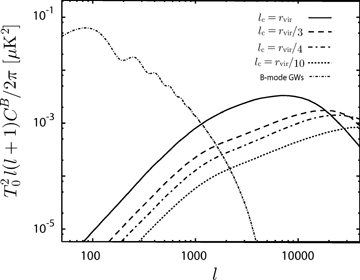
The angular power spectra of the B-mode CMB polarization by Faraday rotation for the different coherence lengths. The solid line corresponds to the model with lc=rvir. The dashed, the dash–dotted and the dotted lines are for lc=rvir/3, lc=rvir/4 and lc=rvir/10. For comparison, we plot the B-mode polarization caused by gravitational waves.
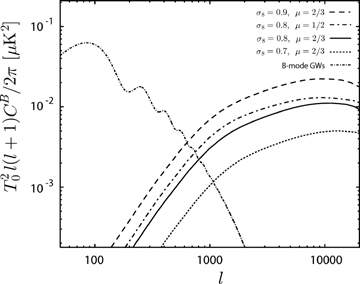
The angular power spectra of the B-mode polarization caused by Faraday rotation galaxy clusters and galaxies for the β-profile. The solid line is for β= 0.6 and μ= 2/3, and the dash–dotted line is for β= 0.6 and μ= 1/2. We also plot the case of σ8= 0.9 and 0.7 for β= 0.6 and μ= 2/3 (dashed and dotted lines, respectively). For comparison, we give the B-mode polarization induced by gravitational waves with r= 0.6.
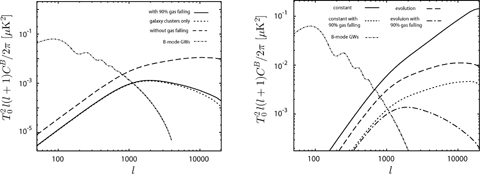
Left-hand panel: The angular power spectra of the B-mode polarization caused by Faraday rotation in galaxy clusters and galaxies. For the solid line, we assume that 90 per cent of gas in galaxies is condensed in the disc. The dotted line shows the contribution from galaxy clusters only. For comparison, we plot the power spectrum for the case without gas depletion and that due to gravitational waves with r= 0.6 as the dashed and the dash–dotted lines, respectively. Right-hand panel: The angular power spectra of the B-mode polarization for different evolutions of magnetic fields. The solid line is for the model where magnetic fields are constant. The dotted line corresponds to the case where magnetic fields are constant and gas is depleted in galactic haloes. We also plot the case where the time-scale of the magnetic field evolution is the dynamical time-scale as the dashed line. The dash–dotted line is takes into account both magnetic field evolution and gas depletion.
The contribution from galaxies appears only at small scales and is totally overwhelmed by that from galaxy clusters. This result tells us that we may neglect Faraday rotation from galaxies, if most of gas is condensed on to the disc.
In Fig. 11, we showed the B-mode power spectrum taking into account magnetic field evolution according to equation (30). However, the magnetic field evolution, especially in galaxy clusters, is not fully understood yet. In some scenarios, the time-scale of the evolution is shorter than the dynamical time-scale (e.g. Brandenburg & Subramanian 2005). To highlight the importance of the magnetic field evolution, we calculate the angular spectrum in the case of constant magnetic fields and we plot the results in the right-hand panel in Fig. 12. For higher l modes, the main contribution comes from galaxies at redshifts higher than z= 1. Due to this, in the case of constant magnetic fields, the amplitude of the power spectrum is higher and the tail at high l is also amplified.
The angular power spectra of the B-mode polarization caused by Faraday rotation from galaxy clusters and galaxies at 30 GHz. The solid line is the case of the NFW profile with μ= 2/3, and the dashed line is for μ= 1/2. For comparison, we plot the power spectra for β-profiles with β= 0.6 and μ= 2/3 and β= 0.6 and μ= 1/2 (dash–dotted and dotted lines, respectively). We also show the B-mode polarization induced by gravitational waves with r= 0.6.
5 DISCUSSION AND SUMMARY
In this study, we calculated the secondary B-mode polarization caused by Faraday rotation. Particularly, we investigated the dependence of the B-mode angular power spectrum from Faraday rotation on the electron and the magnetic field profiles in galaxies and galaxy clusters. We considered both the β-profile of electron density as well as an electron density distribution based on the NFW dark matter profile. We modelled the magnetic field structure in galaxies or galaxy clusters motivated by observations and further accounted for the redshift evolution of its amplitude.
We showed that the electron and magnetic field profiles in galaxies and galaxy clusters modify the position of the spectrum peak. The amplitude of magnetic fields affects the amplitude of the spectrum, mainly. The B-mode polarization from Faraday rotation at 30 GHz is  at l= 104 for the β-profile, whereas it is
  at the same l for the NFW profile. We also investigated the impact of different coherence lengths on the angular power spectrum. Small coherence length induces the depolarization and the peak of the power spectrum shifts to smaller scales and its amplitude is suppressed.
The Faraday rotation angle power spectrum as well as the B-mode angular spectrum are dominated by the contribution from galaxies at redshifts z < 1 and with masses from 1011 to 1012M⊙. In other words, the detection of a secondary polarization from Faraday rotation would give the average strength of magnetic fields in low-redshift galaxies. However, the B-mode angular power spectrum is strongly dependent on the evolution of magnetic fields in galaxies and galaxy clusters, as well as on the diffuse gas fraction in galactic haloes. If the time-scale of the magnetic field evolution is shorter than the dynamical time-scale, the contribution from galaxies at redshifts higher than z= 1 is dominant. The power spectrum has higher amplitude and the peak is on smaller scales. Conversely, if the gas evolution is rapid and most of gas in galaxies condensed on to their discs, the contribution from galaxies becomes much smaller and can be neglected.
The contribution from Faraday rotation from clusters and galaxies appears always small enough, on large scales, to be neglected as compared with the primary B modes from gravitational waves. It is also important to compare the secondary B modes from Faraday rotation with the secondary B modes caused by gravitational lensing. The B-mode polarization by Faraday rotation dominates that due to gravitational lensing at l > 8000 at 30 GHz. It has been shown that gravitational lensing polarization can be removed from the CMB polarization map leaving a residual contribution of about only 10 per cent (Hu & Okamoto 2002; Hirata & Seljak 2003). Considering this cleaning, the B-mode polarization from Faraday rotation will exceed the remaining signal from lensing at l= 2000 (30 GHz), or at l= 7000 (100 GHz). These values are obtained in the β-profile case with σ8= 0.8.
There are other contributions from secondary polarization sources on small scales that we compare to our results. One of them is polarization from inhomogeneous reionization. The coupling between the primordial CMB temperature quadrupole anisotropy and the density fluctuations of free electrons due to inhomogeneous reionization produces a second-order polarization. Some authors estimated this polarization by using a semi-analytic approach (Liu et al. 2001; Mortonson & Hu 2006). For example, Liu et al. (2001) gave  at l∼ 104. Recently, Doré et al. (2007) have revisited this topic using up-to-date numerical simulation. Their results are consistent with those of Liu et al. (2001). The polarization from Faraday rotation due to the realistic magnetic fields in galaxies and galaxy clusters thus dominates the secondary polarization from inhomogeneous reionization, at 30 GHz. However, Faraday rotation has a strong dependence on frequency, Cl∝ν4. As a result, the polarization by Faraday rotation becomes subdominant with respect to the polarization due to inhomogeneous reionization when the frequency exceeds 60 GHz. Next, we considered the polarization from ionized gas in filaments and large-scale structure (LSS). The primary quadrupole produces the polarization by interaction with the free electron gas captured in potential wells of LSS. Liu, da Silva & Aghanim (2005) have evaluated the resulting polarization and obtained
  at l∼ 104. This value is somewhat lower than the polarization due to Faraday rotation at 30 GHz. While the Faraday rotation depends on frequency, the polarization from LSS does not. Therefore, although the polarization of the Faraday rotation dominates the polarization of LSS at frequencies lower than 30 GHz, the former is subdominant for ν < 30 GHz.
Another source of polarization that needs to be considered is galactic foregrounds. On small angular scales, the main contributions come from synchrotron emission and dust in our Galaxy. Tucci et al. (2005) estimated these contributions, focusing on the polarization at multipoles larger than l= 1000. We extrapolated their results to smaller scales and obtained, straightforwardly,  at l∼ 104 at 30 GHz. In order to detect the polarization caused by Faraday rotation, we need to remove the galactic foreground polarization carefully as it will be a major contamination. However, we have to bear in mind that such an extrapolation relies on the assumption that there is significant dust contribution on scales, l≈ 104. On one hand, present observations indicate that the power spectrum of the dust fluctuations decrease as fast as k−3 (Miville-Deschênes, Lagache & Puget 2002) suggesting a fast decrease of the dust contribution on small scales. On the other hand, the contribution from synchrotron emission on those small scales depends on the structure and amplitude of the galactic magnetic field on the same scales. The distribution of the magnetic fields in the Galaxy has been widely studied. Magnetic fields in the Galaxy will, therefore, also act as a Faraday rotation source (Dineen & Coles 2005), but their contributions need to be studied in more detail.
We thank an anonymous referee for useful comments to improve our paper.
REFERENCES
Appendix
APPENDIX A: B-MODE POWER SPECTRUM CALCULATIONS


 . Equation (A7) shows that the Faraday rotation produces B-mode polarization from E-mode polarization and transforms a part of the pre-existing B-mode polarization into E modes.


