-
PDF
- Split View
-
Views
-
Cite
Cite
E. L. Allard, J. H. Knapen, R. F. Peletier, M. Sarzi, The star formation history and evolution of the circumnuclear region of M100, Monthly Notices of the Royal Astronomical Society, Volume 371, Issue 3, September 2006, Pages 1087–1105, https://doi.org/10.1111/j.1365-2966.2006.10751.x
Close - Share Icon Share
Abstract
Context. Star-forming nuclear rings in barred galaxies are common in nearby spirals, and their detailed study can lead to important insights into the evolution of galaxies, their bars and their central regions. We present integral field spectroscopic observations obtained with SAURON of the bar and circumnuclear region of the barred spiral galaxy M100, complemented by new Spitzer Space Telescope imaging of the region.
Aims. We use these data to enhance our understanding of the formation, evolution and current properties of the bar and ring.
Methods. We derive the kinematics of the gas and the stars and quantify circular and non-circular motions using kinemetry. We analyse this in conjunction with the optical and infrared morphology, and our previously published dynamical modelling. By comparing line indices to simple stellar population models we estimate the ages and metallicities of the stellar populations present within the region, especially in and around the ring.
Results. The stellar and gaseous velocity fields are remarkably similar, and we confirm that the velocity fields show strong evidence for non-circular motions due to the bar and the associated density wave. These are strongest just outside the nuclear ring, where our kinemetric analysis indicates inflow across the spiral armlets and into the ring region. The line strength maps all indicate the presence of a younger population within this ring, but detailed modelling of the line strengths shows that in addition to this young population, old stars are present. These old stars must have been formed in an event of massive star formation which produced the bulk of the mass, and which ended some 3 Gyr ago, a constraint set by the age of the stars in the bar and the nucleus. Our best-fitting model is one in which the current star formation is but the latest of a series of relatively short bursts of star formation which have occurred for the last 500 Myr or so. A clear bipolar azimuthal age gradient is seen within the ring, with the youngest stars occurring near where the bar dust lanes connect with the ring.
Conclusions. Our kinematic and morphological results all confirm the picture in which the nuclear ring in M100, considered typical, is fed by gas flowing in from the disc under the action of the bar, is slowed down near a pair of resonances, and forms significant amounts of massive stars. Detailed stellar population modelling shows how the underlying bulge and disc were put in place a number of Gyr ago, and that the nuclear ring has been forming stars since about 500 Myr ago in a stable succession of bursts. This confirms that nuclear rings of this kind can form under the influence of a resonant structure set up by a bar, and proves that they are stable features of a galaxy rather than one-off starburst events.
1 INTRODUCTION
The presence of a bar or other asymmetric perturbation of the gravitational potential within a spiral galaxy can strongly influence the dynamics of the gas and the stars. Bars are commonly formed within dynamically unstable galactic discs. During their evolution they can experience vertical buckling instabilities, which thicken the bar and increase the vertical velocity dispersion (Combes et al. 1990; Raha et al. 1991), and which we now know can be recurrent (Martinez-Valpuesta, Shlosman & Heller 2006). Bars are present in up to 70 per cent of spiral galaxies (Eskridge et al. 2000; Knapen, Shlosman & Peletier 2000a; Grosbøl, Patsis & Pompei 2004), indicating that they must be long-lived components of a galaxy. This strong conclusion is confirmed by recent results suggesting that the bar fraction is roughly constant out to z∼ 1 (e.g. Jogee et al. 2004).
Dust lanes are often seen within large-scale bars, offset from the bar major-axis. The main families of periodic orbits making up the bar are elongated parallel to the bar, and perpendicular orbits are present if one or more inner resonances exist (Contopoulos & Papayannopoulos 1980), so called x1 and x2 orbits, respectively. At the location of such resonances, between the bar pattern speed and the period of the radial oscillations of the stars and gas, the stellar orbits abruptly change orientation. The gas orbits can only do this gradually, and this leads to the existence of shocks within the bar. The compression of this gas is manifested by increased dust extinction.
The shocks can lead to angular momentum loss in the gas, as a result of which the gas will flow in towards the nucleus until it stalls in a ring-like region in the vicinity of the inner Lindblad resonances (ILRs), where there is no net torque acting on the gas (Knapen et al. 1995a, hereafter K95a; Heller & Shlosman 1996). The accumulation of gas in such a nuclear ring can easily lead to enhanced massive star formation (Heller & Shlosman 1994; K95a). Such star-forming rings are found within the central 1–2 kpc of 20 per cent of spiral galaxies, practically all barred (Knapen 2005), and are traced by strong line emission. Overall, nuclear rings contribute around 3–5 per cent to the local star formation rate (Kennicutt et al. 2005), and may play a role in the secular evolution of galaxies (see review by Kormendy & Kennicutt 2004).
The galaxy M100 (=NGC 4321) was chosen as the focus of this study due to its relative proximity (16.1 Mpc, Ferrarese et al. 1996), giving a scale of 70 pc per arcsec, and the moderate strength of its bar. The bar strength (Qb) of M100 has been estimated at 0.2 by Laurikainen & Salo (2002), who suggested that significant asymmetric forces are present for bar strengths of Qb > 0.05. M100 exhibits a particularly clear resonant circumnuclear structure which has been described in detail by K95a and Knapen et al. (1995b, hereafter K95b, and 2000b, hereafter K00). The morphology changes dramatically between wavebands. In the K band, a small-scale bar is clearly visible, at the same position angle (PA) as the large-scale bar (see also Section 6.3). The picture, therefore, is of a single bar dissected by a nuclear ring. Hotspots of K-band emission are located at the ends of the inner part of the bar. In blue optical light, as well as in Hα emission, a bright star-forming two-armed spiral structure is evident, delineated by the offset dust lanes which can be traced inwards through the main bar, through the ring, and towards the centre. We define the contact points as the locations on the ring dissected by a line through the nucleus and perpendicular to the bar major-axis.
In this paper, we present stellar and gas kinematics, absorption line indices (Hβ, Mgb and Fe5015), and Spitzer Space Telescope (SST; Werner et al. 2004) near- and mid-infrared imaging across the nuclear ring and bar region in M100. We aim to study the detailed interplay between the dynamics on the one hand, and the ancient and recent history of the star formation in the bar and ring on the other.
This is the second paper presenting results from our new data set on this galaxy. In the first paper (Allard, Peletier & Knapen 2005; hereafter Paper I), we presented emission line and gas velocity dispersion maps which showed how massive star formation occurs at the precise locations of relatively cool gas, and related these results to the dynamical origin of the ring in terms of a resonance structure set up by the bar. This paper is structured as follows. Section 2 describes the observations, data reduction and analysis of the SAURON and SST data, Section 3 briefly describes the morphology and line ratios, Section 4 concentrates on the kinematics and Section 5 on the stellar populations. Our discussions and conclusions are presented in Sections 6 and 7.
2 OBSERVATIONS, DATA REDUCTION AND ANALYSIS
2.1 SAURON observations
The central region of M100 was observed with the SAURON (Bacon et al. 2001) integral field unit (IFU), mounted to the William Herschel Telescope (WHT), on La Palma on 2003 May 2. To cover the whole bar region, three separate pointings were made, the positions of which are shown in fig. 1 of Paper I. Each separate field of view covers an area of 33 × 41 arcsec2 on the sky, which is mapped by a lenslet array, containing 1431 square lenses of 0.94 × 0.94 arcsec2 in size. A further 146 lenses are available 1.9 arcmin away from the field for simultaneous observation of the sky background. After passing through the lenslet array, the light from the source enters a transmisson filter, which is tilted to prevent overlap of the spectra on the CCD array. The filter allows the wavelength range 4760–5400 Å to be observed. The large number of spatial elements in SAURON limits the wavelength coverage due to lack of space on the CCD array (EEV 12 with 2148 × 4200 pixels). This range was chosen as it contains the stellar absorption features Hβ, Mgb, some Fe i features, and the emission lines Hβ, [O iii] and [N i]. The light through each lens is then dispersed by a spectrograph, giving 1577 spectra on the CCD array. Each field was exposed for 3 × 1800 s, and dithered by one or two lenses to avoid systematic errors. Each single exposure was taken between two comparison neon lamp exposures for accurate wavelength calibration. Standard stars were also observed for flux calibration, and continuum and sky-flat exposures were taken for flat-fielding. The seeing was around 1 arcsec during the night and the conditions were clear but not entirely photometric.
2.2 SAURON data reduction
The data were reduced, extracted and calibrated using the specially developed xsauron software (Bacon et al. 2001). First, the raw images are bias and dark subtracted using standard methods. Secondly, each individual spectrum must be extracted from the 2D image and placed in its correct position within a data cube. This requires the creation of a mask model, which finds the position of each individual spectrum. Data cubes of all the object, lamp and flat-field exposures are created. The neon lamp data cubes are used to calibrate the wavelength dimension, and the continuum lamp and sky-flat data cubes are used to remove low-frequency flat-field effects. The spectral resolution of each lens may be different, due to optical distortions across the field. Bacon et al. (2001) found that the instrumental spectral resolution can range from 90 km s−1 in the centre to 110 km s−1 in the outer regions. This had to be corrected since multiple exposures of the same object are to be combined, which may fall on different regions on the detector. The instrumental resolution is measured from the sky-flat data cube, and each lens is then smoothed to the lowest resolution (σ= 2.1 Å) using a Gaussian convolution. Cosmic rays are removed using an algorithm which contains both spatial and spectral morphological criteria, the sky background is subtracted, and the object data cube is flux calibrated using the standard stars observed. The wavelength range of each lens will vary slightly across the field. This is due to the filter being tilted to avoid ghost images. To achieve a common range all the spectra are truncated to the range 4800–5380 Å. To merge the three 1800-s exposures, an image is created by integrating the total flux and collapsing each data cube along its spectral dimension. As standard stars were not taken after each galaxy exposure to save time, the data cubes are normalized to correct for small errors in the flux calibration. Using the integrated images, the data cubes can be recentred on a bright star or object within the field. The separate regions of the galaxy observed are then mosaiced to produce one large data cube. As there is only a small region of overlap between the three fields, there are no bright objects with which to match the fields together. Instead, the PAs and RA and Dec. of each field were obtained from the file header, and used to calculate the rotation and offsets needed to mosaic the field together and align it north-east. An Hα image of the galaxy was used to verify that this had worked correctly.
The final data cube has a new spatial grid with a sampling of 0.8 × 0.8 arcsec2, a spectral sampling of 1.1 Å and now contains 5775 individual spectra. The data cube was spatially binned using the Voronoi 2D binning method of Cappellari & Copin (2003) to achieve a minimum signal-to-noise ratio (S/N) across the field to extract accurate kinematics and line strengths. The data were binned to an S/N of 60 per resolution element which resulted in 802 bins. The bins have been left unsmoothed in all subsequent images used in this paper.
2.3 SAURON data analysis
The spectrum of M100 contains contributions from each star along the line of sight. The spectral features are broadened due to the differences in velocity between the stars which were observed with each SAURON aperture. The observed spectrum is a superposition of the spectra of these stars, and, assuming they share the same kinematics, can be well described by the sum of the spectra representative of the stellar population, each convolved by the line-of-sight-velocity distribution (LOSVD). In addition to stars, gas is also observed along the line of sight, and so the spectrum of M100 additionally contains a number of strong emission lines (Hβ, [O iii], [N i]). This gas contribution needs to be removed to obtain a clean stellar spectrum before any absorption line strengths can be determined.
The SAURON stellar kinematics of M100 were obtained by the fitting of its spectra with a linear combination of single-age, single-metallicity population models from Vazdekis (1999) convolved with a Gauss–Hermite parametrization of the stellar LOSVD (Gerhard 1993; van der Marel & Franx 1993). The best-fitting parameters were determined using the penalized pixel fitting (pPXF) method of Cappellari & Emsellem (2004), which allows the exclusion of the regions containing strong emission lines.
The adopted template library contains 48 models with ages ranging from 250 Myr to 17.78 Gyr, and metallicities ranging from −1.68 to +0.20 [Fe/H]. This library is similar to that used by Falcón-Barroso et al. (2006) and Ganda et al. (2006) for the analysis of spiral galaxies.
The procedure to measure the gas kinematics has been refined since Paper I. We now follow the new procedure as described in Sarzi et al. (2006) in which the gas emission lines are treated as additional Gaussian templates, which are fitted to the data simultaneously with the stellar population models. Furthermore, the fitting of the emission lines has been performed unconstrained, allowing the derivation of separate [O iii] and Hβ kinematics. Our previously determined gas kinematics were derived by fitting the emission lines together, and as Hβ is the dominant line over most of the field, the gas kinematics of Paper I are closely matched by the Hβ kinematics presented in this paper.
Once the gas contribution has been successfully estimated, it can be removed from the original galaxy spectrum to produce a clean, emission-free stellar spectrum, and this is repeated for each spectrum in the data cube. This cleaned data cube is used for the measurements of absorption line strengths.
2.4 Instrumental dispersion issues
The stellar dispersion map (Fig. 1b) shows an unusual area of high dispersion offset towards the south-west of the centre by Δ(RA) =−10 arcsec, Δ(δ) =−15 arcsec. This area is also visible to a lesser extent in the dispersion maps for the gas emission lines. An effect such as this could be produced by an inaccurate homogenization of the spectral resolution across the field, so this step in the data reduction process was investigated more carefully. It should be noted that this data reduction process is identical to that used for other SAURON papers (Bacon et al. 2001; de Zeeuw et al. 2002; Emsellem et al. 2004; Cappellari et al. 2006; Falcón-Barroso et al. 2006; Kuntschner et al. 2006; McDermid et al. 2006; Sarzi et al. 2006) and no issues of this kind have been seen before. To check whether the correction made was adequate, the same correction was applied to one of the lamp data cubes for each of the three positions, and the dispersion of the lamp lines was then measured. A residual gradient was found of around 0.2 Å, or 10 km s−1, in each of the three fields. A correction map was created which was applied to the stellar dispersion map, but the problem area remained. Not only was this residual dispersion not large enough to account for the observed region of high dispersion, it affected the three fields in the same way, whereas the high-dispersion region is predominantly in the eastern field. As all the observations were taken on the same night without any large movement of the CCD and instrument it is unlikely that the resolution of the lens changed between observations. Furthermore, we used lamp data cubes instead of the sky-flat data cube to compute the spectral resolution correction for each corresponding object data cube, but the high-dispersion region remained in each case. We also checked whether the proximity of the sky lenses to the galaxy could cause strange features within the object spectra, and found that this was not the case. Batcheldor et al. (2005) presented IFU observations of the stellar kinematics of M100 for the central 33 × 29 arcsec2. Their stellar velocity field agrees very well with ours, but their maps show no sign of this high-dispersion region.
![(a) Stellar velocity field. The systemic velocity of 1571 km s−1 has been subtracted. (b) Stellar velocity dispersion, overlaid with Hβ emission contours at relative intensity levels [0.05, 0.3, 0.5, 1, 2]. Units are in km s−1. In this figure, and all following figures, north is up and east is to the left.](https://oup.silverchair-cdn.com/oup/backfile/Content_public/Journal/mnras/371/3/10.1111/j.1365-2966.2006.10751.x/2/m_mnras0371-1087-f1.jpeg?Expires=1750199108&Signature=fjw6EOcRfXvOjo4-YOeah7KB00oYNZ5b95amEGccyAxUR9QpFAAwAEe58V~HFY4cTdOfICQ-UC~1V9LpojMgKqUmD59SywWkEbt9J9z1Jl4NQnf~NLn--2jq1rehXYzma8nkvV8bRl2ad9dvjEWt8YROsH~Ooez8rjCtcTNOjC6sdho00WR9dcZiLk7J60iJU2-7KxSeigyHLt7IDsgeY1bnd9mCb4nij16cU7LpQ5oEYEqc-Qf~NiTfTCOIB9Nw30Q8QTalICl5kU4saq~IbEcm2cWaJM7Ed6MeHYuLKXasZRua1jlw2KeYqcTuuioOjSFvYAWYdnvSF4wz3DDWEg__&Key-Pair-Id=APKAIE5G5CRDK6RD3PGA)
(a) Stellar velocity field. The systemic velocity of 1571 km s−1 has been subtracted. (b) Stellar velocity dispersion, overlaid with Hβ emission contours at relative intensity levels [0.05, 0.3, 0.5, 1, 2]. Units are in km s−1. In this figure, and all following figures, north is up and east is to the left.
We conclude that, even though the stellar velocity dispersion on the eastern side of the centre might appear too high, we cannot identify an observational or instrumental cause. It is important to note, however, that whatever causes this effect will only impact on the stellar and gas dispersion maps, and not the gas fluxes, or the line ratios, as these measurements are not dependent on the width of the spectral features. The line strength measurements are affected, since they are corrected for velocity dispersion (see Section 5.1), but the corrections are small (<0.2 Å) since the velocity dispersions are <100 km s−1 (see e.g. Davies, Sadler & Peletier 1993).
2.5 SST imaging
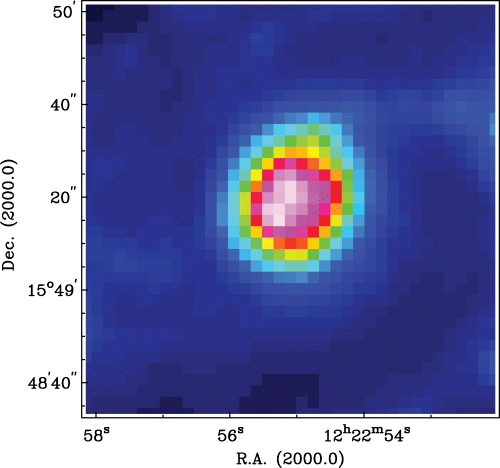
We obtained SST Infrared Array Camera (IRAC; Fazio et al. 2004) and Multiband Imaging Photometer for Spitzer (MIPS; Rieke et al. 2004) imaging data of M100 from the archive, data which were obtained as part of the Spitzer Infrared Nearby Galaxy Survey (SINGS) project (Kennicutt et al. 2003). For each of the bands, we combined the two sets of data taken. We refer to Kennicutt et al. (2003) and subsequent papers by the SINGS team for all details of the observations and data reduction. We subtracted residual sky backgrounds, rotated the images to place them in a north-east configuration to be compared directly with our other data, and produced colour index images for the IRAC data. The latter were made in magnitudes, by taking the logarithm of the ratio of two images and multiplying that with 2.5. Following the prescription of Pahre et al. (2004) and Calzetti et al. (2005), we produced a ‘dust emission’ image at 8 μm by subtracting the 3.6-μm stellar image. Pixel scales are 1.2 arcsec for IRAC and 2.45 arcsec for MIPS 24 μm. The spatial resolution is just over 2 pixel in each band. We present IRAC images in the 3.6, 4.5, 5.8 and dust-only 8.0-μm bands of the bar region of M100 in Fig. 2, and of the nuclear ring region in Fig. 3. Colour index images of the bar region are shown in Fig. 4. The MIPS images have too low spatial resolution to be of much use in our study of the nuclear ring region of M100, however, we do make reference to the 24-μm image in Section 6.5 and hence show it in Fig. 5.

SST IRAC 3.6-, 4.5- and 5.8-μm images of the central region of M100, as well as (bottom right-hand panel) the dust-only 8-μm image (Section 2.5). Contours are plotted logarithmically at 0.63, 1, 1.6, 2.5, 4, 6.3, 10, 15.8, 25.1 and 39.8 MJy sr−1 for the 3.6-, 4.5- and 5.8-μm images, with an additional contour at 63.1 MJy sr−1 for the 3.6- and 5.8-μm images. The nucleus of the galaxy is indicated with a cross.
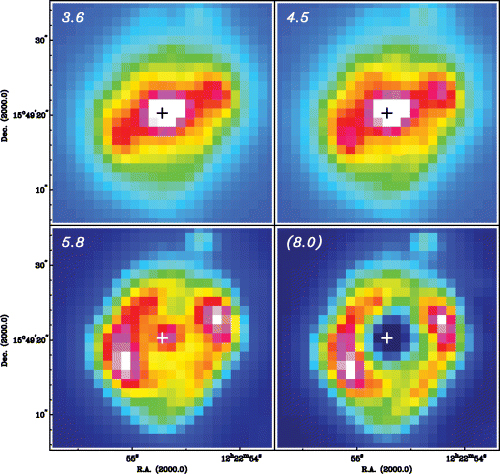
SST IRAC images as in Fig. 2, but now highlighting the structure of the nuclear ring region.
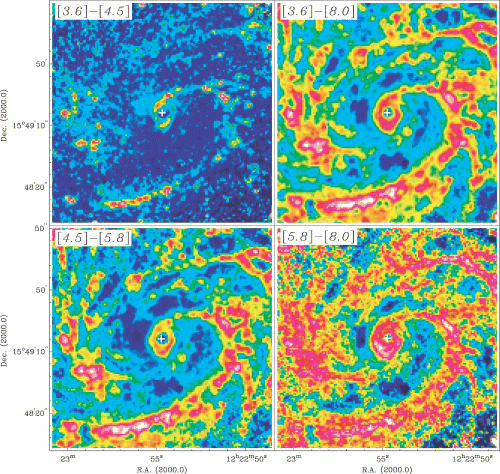
SST IRAC colour index maps of the central region of M100. In all maps, blue tones indicate blue colours (e.g. more 3.6 than 4.5-μm emission), while on the other extreme of the range red and white tones indicate the reddest colours. The nucleus of the galaxy is indicated with a white cross.
3 MORPHOLOGY AND LINE RATIOS
3.1 SAURON morphology
The SAURON fields were chosen to cover the complete bar of M100, found at a PA of 110° (K95b). The positions of the three fields are shown in fig. 1f of Paper I. The reconstructed total flux within the observed spectral range is shown in Fig. 6. The bright spiral armlets are visible, along with the offset dust lanes. The observed morphology in the two brightest emission lines, Hβ and [O iii], can be seen in figs 1(a) and (b) of Paper I and is summarized here. Contours of the Hβ emission are shown in various figures in this paper, e.g. Fig. 6. The Hβ emission follows closely the Hα morphology (K95b, K00). The emission is brightest in a ring of emission surrounding the centre, and at the western end of the large bar. A thin arc of emitting material connects the ring with both ends of the bar, more strongly on the western side. The [O iii] emission is strongly centrally peaked, most likely caused by the low-ionization nuclear emission region (LINER) nucleus. The emission also faintly traces the Hβ emission.
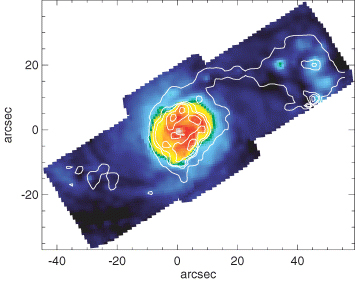
Total intensity map, reconstructed from our SAURON data cubes. Overlaid in white are the contours of the Hβ emission of Fig. 1.
3.2 Line ratios
An emission line ratio map of [O iii]/Hβ is presented in Fig. 7. A line ratio containing one heavy element and one hydrogen Balmer line is relatively insensitive to changes in abundance (Veilleux & Osterbrock 1987), and helps indicate the ionization mechanism powering the lines. Photoionization of gas caused by non-thermal- or power-law-type continuum radiation results in [O iii]/Hβ > 3. Lower values of [O iii]/Hβ are suggestive of star formation, and photoionization by OB type stars. The metallicity of the gas can also affect the [O iii]/Hβ ratio, but as metallicity does not change abruptly within a single galaxy, large fluctuations in [O iii]/Hβ within a galaxy are likely to be caused by changes in the ionization mechanism (Sarzi et al. 2006).
![[O iii]/Hβ line ratio map, overlaid with the Hβ emission contours of Fig. 1. The scale is logarithmic.](https://oup.silverchair-cdn.com/oup/backfile/Content_public/Journal/mnras/371/3/10.1111/j.1365-2966.2006.10751.x/2/m_mnras0371-1087-f7.jpeg?Expires=1750199108&Signature=w8ADzTPwA6KJ7DA0skQsKu0fEJfTcpsljSJEiH0Zvjvkp~ZojUiR9QVI0UBipGNCk~9RZH7eNGGKRuV5P4zDi9~otZZMMSVhpvfavsiqoIJ0jC8YKgh1Yec2S4N8ghwTN1Ufba~Y~dMGp6fScm1C5JZVINH8HmOUutk2pXXAG-jih4nG~cjVydbM8DN6mO3kQqPZ3jfnFkWOXgAbC7gGNmc5VFarvsEyBipFwh83oLClA5jRsovu2wvrooq0Os~xkJsSIeICPI-WNj4novh9xPIMSWWe525hg6CQLTnAD8e6vtIQ8YwbrzzQS9Jo6MAIinK1l4sMyDjdVOLmjwM9Bw__&Key-Pair-Id=APKAIE5G5CRDK6RD3PGA)
[O iii]/Hβ line ratio map, overlaid with the Hβ emission contours of Fig. 1. The scale is logarithmic.
Fig. 7 shows the [O iii]/Hβ ratio across the inner region of M100. The nuclear ring and the emission-line regions on the Eastern side of the bar contain much lower values (less than [O iii]/Hβ= 0.1) than the rest of the galaxy, confirming the presence of massive star formation. Within the nucleus, [O iii]/Hβ∼ 1, a value typical of LINER galaxies (Veilleux & Osterbrock 1987).
3.3 Near- and mid-infrared morphology
The overall morphology of the SST IRAC images describes emission predominantly from the stellar photospheres of the old population, unhindered by dust extinction, and, at the longer wavelengths, by tiny dust grains and by the large molecules known collectively as polycyclic aromatic hydrocarbons (PAHs). The colour index images highlight the relative differences between the different bands. The distribution of the old stellar population is seen at 3.6 and 4.5 μm. The main bar of M100, of relatively modest strength, is seen clearly, the spiral arms in the disc are outlined, and the star-forming regions at the ends of the main bar are relatively modest. The most obvious feature in all bands in Fig. 2 is the strong emission from the circumnuclear region, in which the emission from the inner part of the bar (K95a) dominates (shown in detail in Fig. 3).
The IRAC colour index images (Fig. 4) show how the emission varies with wavelength. The nucleus is consistently ‘blue’, and the nuclear ring, as well as the disc spiral arms, predominantly ‘red’. The [3.6]–[4.5] image highlights the most intense star-forming regions, presumably because of the emission by hot dust which is more prominent at 4.5 than at 3.6 μm. The colour index images involving the 5.8- and 8-μm emission show how they trace the star-forming regions through the emission from small dust grains and PAHs. We will discuss the implications of the SST imaging on our understanding of the central region of M100 in Section 6.
4 KINEMATICS
The kinematics of the nuclear ring region in M100 has been studied in detail by K00, who used observations in the Hα and CO J= 1 → 0 lines, and compared them to the numerical model of K95a. Our SAURON data allow us to extend the kinematic analysis by studying the stellar as well as the gas kinematics over a larger spatial area, and by using a more quantitative technique to investigate the non-circular motions in the ring region.
We have used the technique known as kinemetry (Copin 2002; Krajnović et al. 2006) to analyse the stellar and gas velocity fields quantitatively. Kinemetry involves a procedure similar to surface photometry, but for the non-zero order moments of the LOSVD. Best-fitting ellipses are determined across the surface of the velocity maps, along which the profiles of the moments can be extracted and analysed by means of harmonic expansion. In photometry, galaxy light can be described by an ellipse, with any deviations from this giving rise to extra terms in the Fourier expansion. These terms represent quantities such as the disciness or boxiness of the ellipse. When using kinemetry to analyse velocity maps, these extra terms carry information on how the velocity field deviates from circular motion viewed for a given inclination. Each fitted ellipse is defined by two parameters, PA and flattening, q, where q is related to the ellipticity e by q= 1 −e, and to the inclination i (assuming a thin disc) by q= cos (i). We have fixed the PA at 153° and the inclination at 27° (Knapen et al. 1993, K00).
The velocity profiles along sampling ellipses in galaxies are well represented by a cosine law (Krajnović et al. 2006). A velocity map V(r, θ) can be divided into elliptical rings with velocity profiles described by a number of harmonic terms as follows:

where (r, θ) are the polar coordinates of the velocity field. In the case of perfect circular motion, c0=Vsys and c1=Vc sin i, with all other coefficients equal to zero. The line-of-sight velocities can then be represented by the following:

The subtraction of a disc model of circular motion from the observed velocity field then reveals the non-circular motions.
In the case of velocity fields containing non-circular motions, the higher order coefficients cn and sn become non-zero. Franx, van Gorkom & de Zeeuw (1994), Schoenmakers, Franx & de Zeeuw (1997) and Wong, Blitz & Bosma (2004) have investigated the behaviour of these coefficients for a number of disc models. It is possible to discriminate between various models of non-circular motions (e.g. radial flows, warps and elliptical streaming) by an inspection of the c1, s1 and s3 terms. The coefficient c1 is always dominant, and relates to the amplitude of the rotation curve. All other coefficients are commonly expressed as fractions of c1. The simplest interpretation of the s1 term is as a radial flow, with its sign indicating inflow (−) or outflow (+). The s3 term reveals asymmetric structures in the disc, where a constant non-zero s3 is a signature of a global, elongated potential such as a bar, whereas fluctuations in s3 reveal localized structures such as spiral arms.
The velocity field reconstructed from the derived coefficients will reproduce the overall rotation and non-circular motions of the observed velocity fields. We present such reconstructed maps in Fig. 8, where we used all components in Figs 8(c) and (g) and only component c1 in Figs 8(a) and (e) (circular rotation only). Subtracting these reconstructed maps from the observed velocity field yields the residual maps shown in Figs 8(d), (h), (b) and (f), respectively. The analysis is restricted to the central 60 × 40 arcsec2 because only for this area the velocity field is fully sampled at a given radius.
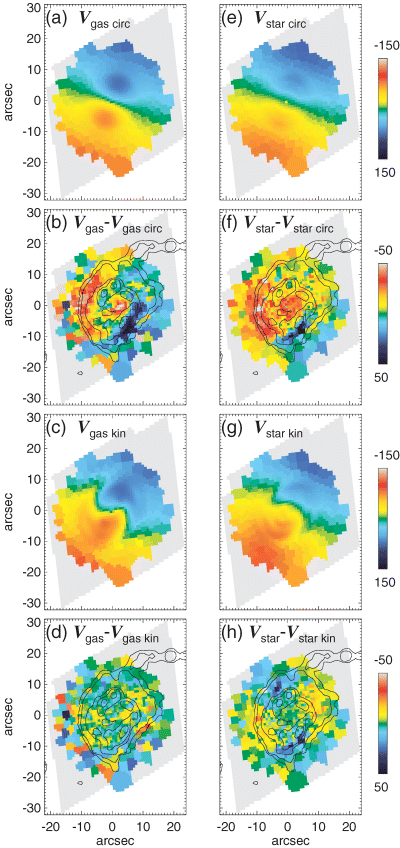
(a) Model circular velocity field of the gas, for the region sampled, derived using only the first coefficient of the harmonic expansion. This is a simple model of an inclined rotating disc. (b) The residuals from the Hβ gas velocity field minus the model circular velocity field. (c) Model reconstructed velocity field of the gas, using the first five coefficients of the harmonic expansion. (d) The residuals from the Hβ gas velocity field minus the reconstructed gas velocity field. (e, f, g and h) As above, but now for the stars.
4.1 Gas kinematics
The gas velocity fields of [O iii] and Hβ (Fig. 9) both show slightly faster rotation than the stars, and are more complicated. Hβ rotates slightly faster than [O iii] at larger radii. In the central 30 arcsec diameter region which contains the nuclear ring, K00 reported two distinct sets of features in the Hα velocity field which they related to non-circular motions due to gas streaming around the nuclear part of the bar and the spiral arms just outside the nuclear ring. We confirm the existence of these features in our gas velocity fields. First, we see the distinct S-shaped deviation due to the inner part of the bar in the velocity contours of Hβ, at a radius of ∼5 arcsec, which is also apparent but less clear in the [O iii] velocities. Secondly, at a radius of ∼9 arcsec we see the spiral density wave streaming motion as a set of deviations from circular motion, but in the opposite sense as those due to the inner part of the bar. Similar effects on the isovelocity contours are regularly seen in the central regions of other galaxies observed using IFUs (e.g. Falcón-Barroso 2002; Hernandez et al. 2005; Ganda et al. 2006; Sarzi et al. 2006).
![(a) Hβ gas velocity field. (b) Hβ gas velocity dispersion field. (c) [O iii] gas velocity field. (d) [O iii] gas velocity dispersion field. Units are in km s−1. The systemic velocity of 1571 km s−1 has been subtracted from velocity maps. Overlaid are Hβ emission line intensity contours, as in Fig. 1.](https://oup.silverchair-cdn.com/oup/backfile/Content_public/Journal/mnras/371/3/10.1111/j.1365-2966.2006.10751.x/2/m_mnras0371-1087-f9.jpeg?Expires=1750199108&Signature=NXJg0usq7goxQPI9eYiKUy79WlKX-Y4-d9JfqVUrt78X0OdoszPofHOELXsl~tbBTw9AgDwa65OfM~N26AlvlTXywpH7SLXax~8CAWJeRnYdHQCu1wWOKQT0j6t5wmwDn9CD67TG6GmufeuFRJvzS5k1NJTIHWkbg0w6i0~yCrN0rERKQ0iN3xLuh6eBJU5JuHO5M~lpg~Sm~4OSL106uQtX0ImvcKSxpxpvgatkfARZKHFN6~h~~1bLYXdhzNdKFopNxQO-8-q1DXR4VuN2Gvm7ghIr5xKMe-ty4A9mOigWf~1mehhqSBMzFD5frlnhXCEBlBZr7swx439NbGpnWw__&Key-Pair-Id=APKAIE5G5CRDK6RD3PGA)
(a) Hβ gas velocity field. (b) Hβ gas velocity dispersion field. (c) [O iii] gas velocity field. (d) [O iii] gas velocity dispersion field. Units are in km s−1. The systemic velocity of 1571 km s−1 has been subtracted from velocity maps. Overlaid are Hβ emission line intensity contours, as in Fig. 1.
K00 used their kinematic observations to confirm the predictions from the three-dimensional numerical modelling of K95a. This model required the existence of two ILRs in the region, with the nuclear ring lying at the inner ILR. They explained the origin of the non-circular motions first, as gas streaming along the inner part of the bar, and secondly, as the effects of a bar-induced spiral density wave.
In Paper I, we presented a map of the combined Hβ and [O iii] gas velocity dispersion, which shows a ring of lower dispersion gas, lying at the exact position of the nuclear ring as seen in Hβ emission. We suggested that massive stars are forming from the relatively cool gas which flows in from the disc through the bar (Paper I), consistent with the very low values of [O iii]/Hβ seen in the ring. In Fig. 9, we show the gas velocity dispersion separately for Hβ and [O iii]. These maps obviously show the same structure as the combined map presented in Paper I, albeit with a lower S/N. Also, the [O iii] gas velocity dispersion does not reach values as low as Hβ within the ring, and has a much higher value in the centre. This can be understood considering that the [O iii] lines are not as reliable as Hβ to trace the denser and dynamically colder components of the interstellar medium (ISM), where star formation is more likely to occur. Indeed sources other than ionization by O stars can contribute efficiently to the production of [O iii], such as shocks and AGB stars.
Fig. 10 shows the results from the kinemetric analysis for the gas. Both Hβ and [O iii] gave similar results, so we present the full kinemetric analysis for Hβ only. The rotation curve for the gas rises quickly, to a value of 135 km s−1 within a radius of 5 arcsec (Fig. 10). The velocities then flatten out to around 150 km s−1, up to 20 arcsec. The combination of the large offset between the PA of the bar (110°) and that of the kinematic axis (153°) with the footprint of our three combined SAURON pointings means that ellipses can only be fitted out to a radius of 20 arcsec. The general shape of the gas rotation curve is similar to that derived by K00 using Hα Fabry–Pérot data. Their initial gradient within the Hα data is much steeper due to the increased spatial and spectral resolution, but at larger radii the two curves are comparable.
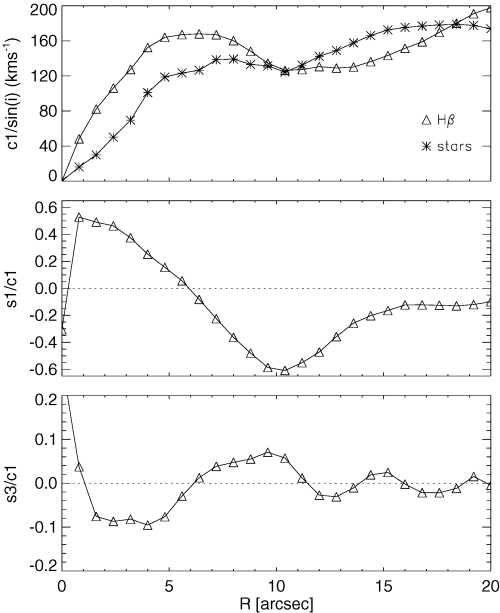
Coefficients of the harmonic expansion against radius for the gas. Upper panel: circular velocity (c1/sin i, for both the gas and the stars, in km s−1). Middle panel: s1/c1. Lower panel: s3/c1.
The higher order coefficients s1 and s3 are non-zero (Fig. 10), revealing the non-circular contributions to the velocity profiles. Wong et al. (2004) performed a kinematic analysis of M100 using CO and H i data for the outer 20 to 200 arcsec, and our data from 0 to 20 arcsec match up well with theirs. The s1/c1 graph is positive within the inner 5 arcsec, and then becomes negative for the rest of the radial range. The most negative values lie at the location of the nuclear ring at ∼10 arcsec. This may indicate radial inflow at this location. The s3/c1 graph shows a number of small fluctuations within the 20 arcsec range, with a positive peak at ∼9 arcsec and a smaller peak at ∼15 arcsec, which correspond to the locations of the nuclear ring and spiral arms, respectively, indicating that these structures are responsible for localized perturbations in the gravitational potential.
The residual velocity field (Fig. 8b) shows large regions of non-circular motions in the gas. Along the bar minor-axis, the sign of the residual changes twice, indicating the two sets of streaming features mentioned above. The residuals of the observed velocity field minus the reconstructed velocity field (Fig. 8d) are a measure of the accuracy of the kinematic fit. The residuals are small except for two regions along the bar major-axis, where the model does not quite match the steep initial gradient in the velocity field.
4.2 Stellar kinematics
The stellar kinematics of M100 across the bar and central region are presented in Fig. 1. The stellar velocity field shows mostly regular rotation, with velocities increasing with radius until, just outside the nuclear ring, they reach a constant velocity of ±∼150 km s−1. The field is mostly smooth and typical of disc rotation. We can recognize the two sets of features described above for the gas kinematics, which are due to bar and density wave streaming. This proves, for the first time, that the dynamics giving rise to the observed non-circular motions in the gas affects the stars to a very similar extent, contrary to many other spirals (see e.g. Falcón-Barroso et al. 2006; Ganda et al. 2006).
In comparison to the gas kinematics, the stellar kinematics in M100 have received very little attention in the literature. Batcheldor et al. (2005) presented the stellar velocity field of M100 for the central 33 × 29 arcsec2, which agrees well with ours, with similar rotational velocities and non-circular motions. Barth, Ho & Sargent (2002) measured a central velocity dispersion of 92 ± 4 km s−1 from their red spectra using an aperture of 3.74 arcsec, while a value1 derived from a similar aperture on our data yields 85 ± 4 km s−1.
The kinemetry analysis described in Section 4.1 was repeated for the stars. The higher orders of the harmonic coefficients are not shown as they are difficult to interpret in the case of the stars. The stellar rotation curve, derived here for the first time, is different in details from that of the gas. The stellar curve has a shallower initial gradient, rising to around 110 km s−1 within 7 arcsec. This value then stays constant until around 12 arcsec, when the velocities rise again to become comparable with the gas velocities.
The residuals between the observed velocity field and the circular velocity and reconstructed velocity fields are shown in the right-hand side of Fig. 8. Fig. 8(f) shows a similar structure to that of the gas (Fig. 8b) but less extreme. This similarity could be the kinematical signature of young stars forming within the inflowing gas. The residuals shown in Fig. 8(h) are small (less than 10 km s−1), indicating that our assumption when applying kinemetry that the motions can be fitted to zeroth order by an inclined rotating disc is justified.
5 STELLAR POPULATIONS
5.1 Deriving line strengths
The combination of the wavelength range of SAURON and the systemic velocity of M100 allows the measurement of the Hβ, Mgb and Fe5015 indices, as defined on the Lick/IDS system (Worthey 1994). The line indices are measured from the spectrum after the gas emission contribution has been removed. The use of indices to measure absorption line strengths on this system requires the definition of a band containing the feature and two side bands containing the red and blue continuum levels. The mean level in each of the two side bands is determined and a linear relation is fitted through the midpoints to define the continuum. The difference between this continuum and the observed spectrum within the feature band provides the index value.
In order to compare indices with other published data and model predictions, the index measurements need to be calibrated to the Lick/IDS system, which involves three steps. First, the observed spectra need to be degraded in resolution to match that of the Lick/IDS system, from a full width at half-maximum (FWHM) of 2.1 to 8.4 Å. Secondly, the LOSVD will broaden spectral features, and so will affect observed line strength measurements compared to intrinsic values. A correction factor is determined for each spectrum individually from the optimal template. Finally, the original Lick/IDS spectra were not flux calibrated, and so small offsets are introduced by differences in continuum shape. These offsets, as well as details of the methods stated here, can be found in Kuntschner et al. (2006).
The final selection of the 48 templates in the library used to derive the stellar and gaseous kinematics, and which is described in Section 2.3, was decided on by judging the quality of the fit to the continuum in a number of lenses across the field.
5.2 Absorption line maps
Maps of the Hβ, Mgb and Fe5015 stellar absorption indices are presented in Fig. 11. These indices change over the lifetime of a star, and can thus be used as age indicators for integrated stellar populations. They are, however, affected to a similar degree by variations in metallicity. In subsequent sections, we will interpret the absorption line measurements in detail by comparing them with stellar population modelling, but we will briefly describe the general morphology of the absorption line maps before doing so.
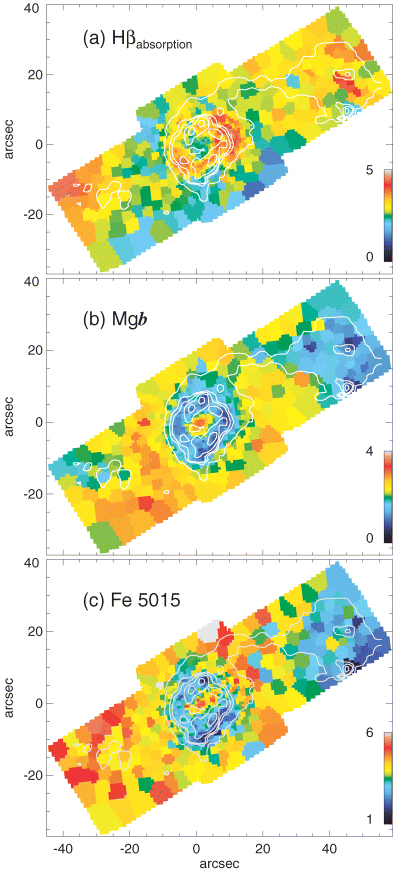
Absorption line strength maps: (a) Hβ, (b) Mgb, (c) Fe5015. Contours as in Fig. 1. Units are in Å.
The Hβ absorption map shows an incomplete ring. The missing parts of the ring are where the strongest Hβ emission is found, near the contact points between the dust lanes and the ring. The two maxima in Hβ absorption index are ∼4 in value and lie on opposite sides of the ring along the bar major-axis. The Mgb absorption map shows a much lower value within the nuclear star-forming ring, which we will quantify and model in the following section. The Mgb index is anticorrelated with Hβ emission across the whole map. The lowest values are found at the contact point between the dust lane and the ring, where the Hβ emission is strongest. The Fe5015 absorption map shows similar structure to that of Mgb. A ring can be seen with the lowest values occurring at the same position as strong Hβ emission.
5.3 Comparisons to model predictions: Hβ versus MgFe50
Using the three absorption line indices, we can place age and metallicity constraints on the stellar populations by using the model predictions of Bruzual & Charlot (2003, hereafter BC03). Typically, metallicity and age affect galaxy spectra in similar ways, but we can combine our available indices to break this degeneracy. The Hβ index is most sensitive to the age of a population (Worthey 1994), with the strongest Hβ absorption occurring in stars of around 250 Myr (see Fig. 12). The Mgb and Fe5015 indices are more sensitive to metallicity effects. Falcón-Barroso (2002) defined a new index,  which minimizes the effect of the differing abundance ratios across the galaxy (see Section 5.4), and which we will use in conjunction with Hβ. Circular apertures of 2 arcsec in radius were taken at points on the ring (squares in Fig. 12) and along the bar (triangles), as well as at the nucleus (diamond). These locations are shown, relative to the morphology of the Hβ emission, in the inset of Fig. 12 (the locations of hotspots K1/2 and Hα3/4 as defined in K95a are shown in Fig. 22). The errors on the absorption line strengths, indicated in the bottom left-hand corner of most figures for this section, are Poisson errors within our apertures.
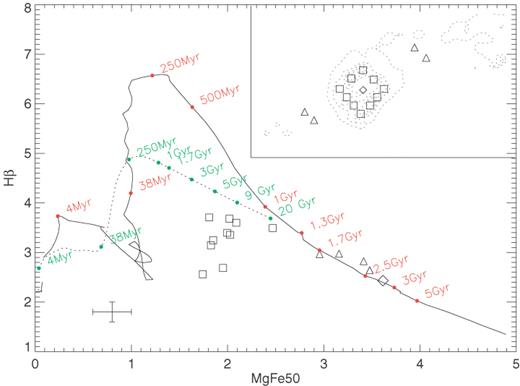
Evolution of the Hβ and MgFe50 indices with time. The inset shows the locations of the apertures taken to measure the data points relative to the Hβ emission (contours). The solid line shows the track for an SSP starburst model, with indicative ages shown in red. The dashed line shows the track for the continuous starburst model, which has a constant star formation rate. The error bars in the bottom left-hand side are typical errors for the data points.
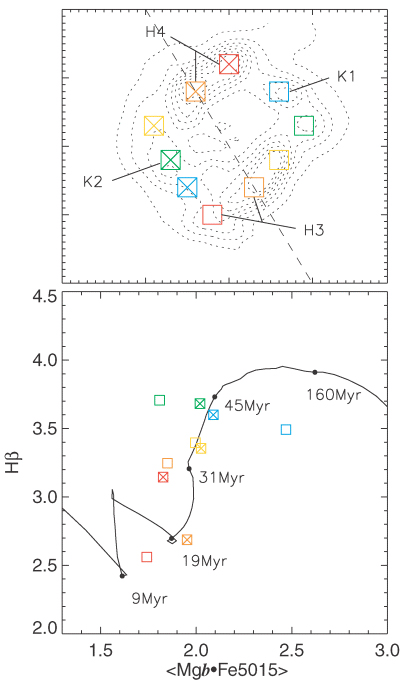
Upper Panel: the location of the points of Fig. 21 within the ring, shown relative to Hβ emission in the central region. K1, K2, H1 and H2 refer to the locations of regions K1, K2, Hα1 and Hα2 as given by K95b. Lower panel: the position of these points in the index diagram, plotted with a double burst model for comparison.
5.3.1 SSP models
As illustrated in Fig. 12: if the Hβ absorption is low, the stellar population is either old, or very young. The Mgb and Fe5015 indices increase as stellar population ages, so combining these indices with Hβ allows a more accurate estimate of the age of a population. To use the model predictions of BC03 we must first make assumptions on the star formation history of M100, for example whether the star formation has been continuous, or has consisted of discrete bursts. Fig. 12 shows the time-evolution of the MgFe50 index versus the Hβ index for a single-burst stellar population (SSP; solid line), as well as for continuous star formation (dashed line). We chose to adopt solar metallicity throughout this paper, but Fig. 13 justifies this choice by showing the effect of sub and supersolar metallicity on the part of the Hβ versus MgFe50 diagram relevant to the nuclear data point. We see that it is impossible to fit this nuclear point with a subsolar metallicity, whereas a fit with supersolar metallicity implies an age of less than 1.5 Gyr. This age is rather less attractive than the 3 Gyr age estimated from the curves at solar metallicity, however, we are strictly speaking unable to distinguish between the two metallicities. We have adopted to use solar metallicity in all the following models, although it should be noted that increasing the metallicity to subsolar will scale down all ages (relative ages will not be affected).

Three SSP models of different metallicites are shown with the nucleus plotted as a diamond. The coloured lines represent lines of constant age.
The basic trend in Fig. 12 is that MgFe50 increases steadily with time for an SSP, and Hβ first increases rapidly, peaks at around 250 Myr, then decreases gradually. The nuclear point (diamond) is well fitted by this SSP at an age of 2.5–3 Gyr. At other locations this model also appears to be a reasonable fit, such as in the bar (triangles). The points within the ring (squares), however, are not well fit, and so an SSP cannot be dominating the spectrum. A composite population must be built up to match these ring points. Fig. 12 also shows the MgFe50 index versus the Hβ index for a population with a continuous star formation rate (dashed line) but this does not fit any of the points. For continuous star formation, the values of MgFe50 increase much more slowly, and values of up to 3.5 such as we observe in the nucleus and bar would not be obtainable within the lifetime of the Universe.
5.3.2 Double SSP models
The location of the ring apertures in Fig. 12 can be explained as a luminosity-weighted combination of relatively few, but bright young stars of a few tens of Myr in the ring, and of many more, less bright, and much older bulge stars, a few Gyr old. To model this, we start out by constructing rather simplistic double-burst models, which we then develop into more realistic multiburst models in Section 5.3.3. There are two basic free parameters when constructing double-burst models, namely the delay between the first star formation event and the second, and the relative masses (amplitudes) of the stellar populations created. Changing these two parameters affects the spectral indices in similar ways. To demonstrate this, models with the same burst amplitudes but two different delays, of 3 and 10 Gyr, are shown in Fig. 14. Increasing either the relative amplitude of the second burst or the delay between the two bursts causes the model tracks to move to the upper left-hand side in the index diagram (higher Hβ and lower MgFe50). This means that we cannot fit a unique model to the nuclear ring apertures, as a number of different combinations of burst amplitudes and burst delays would fit our data points. We can, however, use such families of models to exclude certain past histories of star formation, and to identify the most plausible ones.
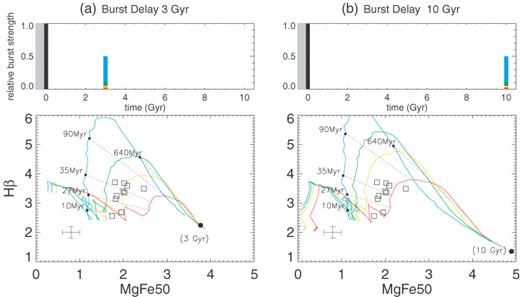
The evolution of the MgFe50 and Hβ indices with time for four populations with varying burst strengths. The upper panels show a representation of the star formation history for each model, where the initial star formation event is shown by a black bar, and other bursts are given as fractions of mass of this initial event. The grey area represents our uncertainty at what happened before the end of the first star formation event. The time since the first star formation event is given on the lower axis. All bursts are instantaneous. The delay between the initial burst and the second burst is 3 Gyr (a) and 10 Gyr (b). Dotted lines of equal age are plotted with the time labelled since 3 or 10 Gyr (when the last burst occurred). The age given in brackets represents the location of an SSP of that age. The relative burst strengths for both (a) and (b) are as follows: 0.02 (red), 0.05 (yellow), 0.1 (green) and 0.5 (blue).
To start, we assume an underlying bulge and disc population in M100 as the result of a star formation event which occurred up to 3 Gyr ago, a time-scale which coincides with our estimated age of the nuclear point in M100. The exact time at which this initial burst of star formation occurred is not critical, as the spectral indices change only very gradually with time for stars over 2 Gyr. We set time, t, to 0 at the end of the first star formation event. The exact nature of this initial event (e.g. single burst, multiple burst) is also unimportant. What is important is that by far most of the stellar mass was formed in this past event (see the implausibility of the high relative second burst strength models in Fig. 14, shown in blue). We know that star formation is occurring now in the ring from the presence of Hβ emission and the low [O iii]/Hβ ratio, so for these positions in the galaxy we are justified to add the current burst of star formation, which occurs 3 Gyr after the disc and bulge population was consolidated.
Fig. 14 shows that a double-burst model can reproduce the line indices observed throughout the nuclear ring of M100 (for instance, a model with a 3-Gyr delay and a relative second burst strength of 5 per cent: the yellow model in Fig. 14a). The location of the ring apertures compared to the model predictions further suggests the presence of an age gradient within the ring (see Section 6.6). However, such a model is not too attractive because it implies that the nuclear ring has only ever had one starburst episode, which is the one we are witnessing at present. Considering the proposed close dynamical connection between the ring and the long-lived bar, one would rather assume that the actively star-forming phase of the ring had been more extended. We thus enhance our model by adding additional bursts between the end of the past star formation event and the current burst.
5.3.3 Multiple SSP models
Star formation must have stopped after the initial event to be followed only by episodic bursts, otherwise the Hβ index would have become too high and the Mgb and Fe5015 indices would have never increased to the observed values, as shown by the continuous star formation model of Fig. 12. As star formation rates in nuclear rings are high, it is likely that star formation will quickly use up available gas in the ring, until more gas is supplied to the bar, causing the pattern of star formation to be episodic rather than continuous. We tested this by starting out from the model with just the current burst of star formation, and observing the behaviour of the spectral indices as extra bursts were added one at a time. The results of this can be seen in Fig. 15 for a time separation of 0.5 Gyr between bursts, and in Fig. 16 for a time separation of 0.1 Gyr. As more bursts are added, the position of the line in Fig. 15 moves vertically upwards and slightly to the left after the first extra burst, then comes back down. Regardless of the number of bursts, the spectral indices do not change significantly, as long as the time between the bursts is quite large (∼0.5 Gyr). But, importantly, Fig. 16 shows what happens if the time separation is decreased to 0.1 Gyr, a number which is more plausible in a scenario of recurrent ring activity. The red line corresponds to the original model described above and shown in Fig. 14. As the number of bursts is increased, the modelled values move significantly to the left and up (higher Hβ and lower MgFe50). Due to the orbital movement of stars and gas around the ring, determining the number of bursts a particular star-forming clump has experienced will be impossible. Additionally, the errors on the individual points do not allow us to be this specific about the exact number of bursts. Fig. 16 shows that the ring apertures can be matched by short time separation multiburst models. Although it appears from Fig. 16 that the variation in Hβ values is due to varying numbers of bursts, the orbital movement of stars and gas around the ring will erase any signature of this in the integrated spectra. Additionally, the errors on the individual points do not allow us to be this specific about the exact index values. From the multiburst models, it is evident that stellar age increases as one moves vertically and to the right in the index diagram, as was the case in the double-burst models (see Section 6.6).
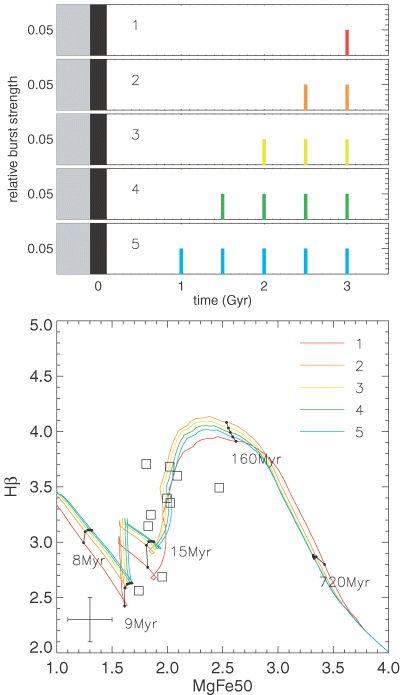
Five different models are shown, with the upper panels representing their star formation history. Note: the relative amplitudes of each burst are not shown to the same scale as in Fig. 14. Each coloured burst has a burst strength of 0.05 (relative to the initial burst, shown in black). The grey area represents our uncertainty at what happened before the end of the first star formation event. The time separation between the bursts is 0.5 Gyr. Dotted lines of equal age are plotted with the time labelled since 3 Gyr.
5.4 Mgb versus Fe5015 index
The Mg/Fe abundance ratio in galaxies is found to vary from that in the Galactic stars normally used for calibration (Worthey, Faber & Gonzalez 1992; Worthey 1994). There is often an over-abundance of Mg as compared to Fe in elliptical galaxies (Peletier 1989; Worthey et al. 1992; Davies et al. 1993). The two elements are created predominantly in supernovae of different types: Fe in Type Ia and Mg in Type II supernovae. Type Ia supernovae are due to the accretion of a binary companion on to a white dwarf – a relatively long process. Type II supernovae are produced from the core collapse of massive stars which have much shorter lifetimes. An overabundance of Mg suggests that the population is dominated by massive stars, which can be the result of a flat IMF, short time-scales for star formation, or a low fraction of binaries experiencing Type Ia supernovae (Worthey et al. 1992).
Fig. 17 shows the evolutionary track for the Mgb and Fe5015 indices for an SSP model, with the data points from the centre and the bar overplotted. The points are not well fitted by the model, and have larger Mgb and/or smaller Fe5015 values, indicating that the abundance ratio of M100 is different from that in the local stars used in the models. Combining the indices as in the previous section helps to remove this problem when determining ages.2 In Fig. 18, we plot the indices for apertures on the ring compared to three multiburst models. These points fit much better, considering that the exact model parameters are uncertain.
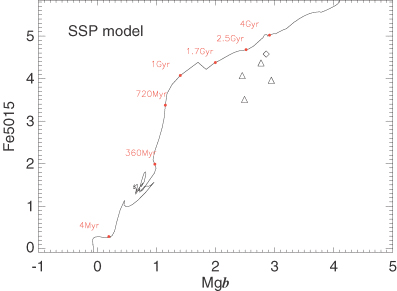
The evolution of the Mgb and Fe5015 indices with time for an SSP, with the points from the centre and bar plotted.
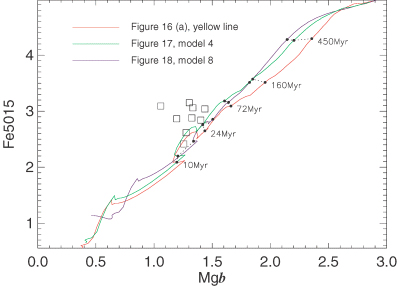
The evolution of the Mgb and Fe5015 indices with time for three models, with the points within the ring plotted. Dotted lines of equal age are plotted with the time since 3 Gyr (when the last burst occurred) labelled.
The stars in the centre and along the bar all have Mg/Fe ratios which are too high, suggesting that the initial star formation event in the galaxy (∼3 Gyr ago) occurred over short time-scales, and most of the stars were formed before enough Type Ia supernovae had enriched the ISM with Fe, which can take several Gyr (Worthey et al. 1992). The new stars forming in the nuclear ring do not have an overabundance of Mg, which makes sense as enough Type Ia supernovae from the original burst should have occurred by now. This offers support for the assumption that the gas creating these new stars has been brought in from the disc under the influence of the bar. Beauchamp & Hardy (1997) studied the abundance gradient Mg/Fe in the disc of M100 and found that it drops at larger radii. Peletier et al. (in preparation) show from SAURON data that the Mg/Fe in early-type spirals is generally larger than solar, with considerable scatter, however. The scenario they suggest, with quick bulge formation and subsequent additional bursts, agrees with our model for M100.
Thomas, Maraston & Bender (2003) and Thomas, Maraston & Korn (2004) have provided SSP models (which we label TM04) with variable abundance ratios, which we have used to plot our Mgb against Fe5015 measurements compared to three models with different α/Fe3 ratios for solar metallicity (Fig. 19). As the α/Fe ratio increases, the Mgb against Fe5015 track moves down and to the right, encompassing the data points from the bar and nucleus. These results confirm the discussion in the previous paragraph, whereas the ages derived from these particular models are consistent with those determined in Section 5.3.1.
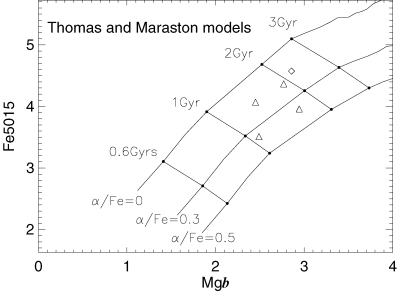
The evolution of the Mgb and Fe5015 indices with time for an SSP, using the TM04 models with varying α/Fe ratios.
6 DISCUSSION
6.1 Orbits in the inner region
The twisting of the velocity contours of the gas, previously observed and now confirmed, has been explained by K00 as a combination of streaming motions caused by the inner part of the bar and by an associated spiral density wave within the central region. The stellar kinematics, which, as described in more detail above (Section 4.2), follow the general characteristics of the gaseous velocity field, demonstrate that the stars are also undergoing streaming motions due to these two separate effects. According to non-linear theory, stars belonging to the bar follow highly elongated orbits aligned parallel to the bar, which leads to the observed non-circular motions as we see at a radial distance of ∼5 arcsec from the nucleus. This had been discussed for the gas in the inner part of the bar in M100 by K00, but is now reported for the first time in the stars. Knapen et al. (1993) had earlier found the same effect on the gas in the large bar of M100, but the detailed study of its stellar counterpart is beyond the quality of our data set.
The second set of velocity contour twists, at radii of ∼12 arcsec, was explained by K00 as streaming motions in the gas due to the effects of a spiral density wave, which lead to a gradual skewing of the gas orbits. We confirm these motions in the gas, but also observe them clearly in the stellar velocity field. In fact, their radial position coincides with the region where our kinemetric analysis of the gas velocity field suggests a localized radial region of inflow – presumably due to material which flows through the spiral arm wave and in doing so moves to smaller radii. We note that K00 made a qualitative comparison of the observed and modelled gas velocity fields and found that the streaming features due to both bar and spiral armlets were reproduced well in the model.
6.2 Age distribution of stars around the ring
One similarity between various models of ring formation is the net inflow of gas into the ring near the contact points between the ring and the dust lanes. To investigate whether this inflow directly influences the massive star formation, we can measure ages for the brightest clumps in a nuclear ring to see whether there are any underlying azimuthal trends. Ryder, Knapen & Takamiya (2001) carried out such a study of the nuclear ring in M100, using UKIRT NIR spectroscopy, and discovered marginal evidence for a gradient in clump ages around the ring, with the youngest clumps found at the contact points. This would support a picture where the gas inflow near the contact points immediately causes gravitational collapse and massive star formation, rather than one in which the gas inflow gradually fills the ring with gas, and where massive star formation would then occur more stochastically around the ring. Mazzuca et al. (2006) investigate this across a sample of 22 nuclear rings and find that most follow the latter scenario, with a small minority of the rings showing evidence for significant azimuthal age gradients.
Our data allow an analysis of such gradients in the ring of M100 using two different techniques, a comparison of the stellar absorption line strengths with the BC03 models, and a measurement of the Hβ emission equivalent width (EW). The EW of the Hβ emission of an SSP decreases extremely quickly and monotonically with time in the age range from 2 to 6 Myr (e.g. Leitherer et al. 1999; Terlevich et al. 2004). Because this basic behaviour is independent of metallicity and of the shape of the IMF, we can use the EW as a sound relative age indicator, and do so for the emitting regions around the ring. We determine the Hβ EW by measuring the flux of the Hβ emission line, after correcting for the velocity dispersion and instrumental resolution. To estimate the continuum flux, we determine the median flux level across the complete spectral range from the emission-corrected stellar spectra. Dividing the flux of the line by this continuum level gives the EW of the line. Fig. 20 shows the Hβ EW map of the nuclear ring region, whereas Fig. 21 shows the EWs for the nuclear ring apertures defined in Fig. 22, plotted as a function of their PA, in the same format as used by Mazzuca et al. (2006) for their sample of 22 galaxies.
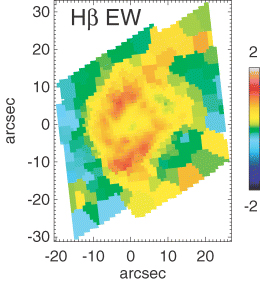
The Hβ emission EW map for the ring region. The colour scale is logarithmic.
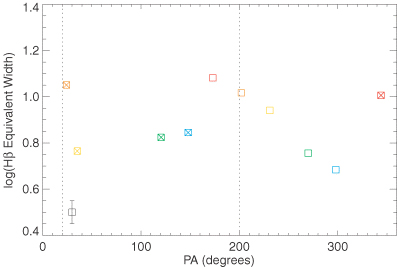
The Hβ emission EWs of points along the ring, plotted against their PA. The contact points are marked with dashed lines. Fig. 22 gives the location of these points relative to the ring.
Fig. 21 indicates that the highest EWs, thus youngest ages, occur near two positions along the ring, ∼180° apart. EWs between these two positions are lower, indicating older ages, while the western apertures, between PA = 170° and 300°, show a monotonically decreasing set of EW values.
Fig. 22 plots, for the same apertures within the ring, the Hβ against MgFe50 absorption line strengths. Although it is impossible to give exact ages for each clump due to the uncertainties in the star formation history, a vertical sequence in colours is prominent, with red and orange points at the bottom of the plot, and green and blue colours towards the top. Relating to the ages given by the model, this sequence is readily interpreted as the same bipolar age sequence as seen in EW (younger to older from bottom to top). The red and orange points indicate an age of around 10–30 Myr, and the green and blue points around 30–50 Myr. The absolute ages of these stars are of course model dependent, but the differences between ages are significant.
Using two independent methods we have therefore found convincing and consistent evidence for the presence of a bipolar age gradient in the nuclear ring of M100, with the youngest stars located near the contact points, where the gas flowing from the disc and through the bar (Paper I) reaches the ring. Massive star formation occurs here, and as these newly formed H ii regions move along the ring, stars get older and gas emission faints. The age gradient along the ring we inferred using the EW of the Hβ emission and the stellar absorption line strengths is consistent with the time needed for gas and stars to move from one contact point to the other along the ring, which is a few tens of Myr (assuming a ring radius of ∼5 arcsec = 350 pc and a velocity of ∼100 km s−1).
6.3 The star formation history of the bar and nuclear ring
From the comparison of our SAURON observations with the theoretically expected absorption- and emission-line behaviour of evolving stellar populations in the central region of M100, we can construct a coherent picture of its star formation history. The different parts of this comparison have been described in detail in the preceding sections, but we aim to summarize the results here and place them into the context of our understanding of the bar and the nuclear ring which it fuels. The main premise of this understanding is that the asymmetric potential outlined by the bar extracts angular momentum from the gas, which flows inwards as a result (Prendergast 1983; Shlosman, Begelman & Frank 1990; Athanassoula 1992). The inflow of gas slows down in the vicinity of a pair of ILRs, and between them, near the inner ILR, massive star formation occurs as a result of the gravitational collapse of accumulated gas, and does so in a ring-like region which we observe as the nuclear ring. This picture has been confirmed from the observed morphology at a variety of wavelengths, from kinematics in the different emission lines, and from numerical modelling (K95a,b; K00). The basic dynamics of a bar-induced nuclear ring (cf. Athanassoula 1992; K95a; Heller & Shlosman 1996), as well as the resulting massive star formation properties, have been observed and modelled for a variety of other galaxies (e.g. Benedict, Smith & Kenney 1996; Regan, Vogel & Teuben 1997; Jogee et al. 2002a,b; Maciejewski 2004a,b), and can be considered a generally valid interpretative framework for such systems.
In the first publication resulting from our SAURON data set of M100 (Paper I), we in fact corroborated this framework further by showing graphically how relatively cool gas flows in through the bar, and into the nuclear ring. The locations of the cool gas coincide exactly with those of the current massive star formation as observed through its Hβ emission, but are significantly offset in the bar region from the curved dust lanes which trace the location of the shocking and compression of the gas.
This paper attempts to use both new kinematic and morphological measurements, and the strengths of emission- and absorption-line features due to stars and gas, to further elucidate the history of star formation within the bar and nuclear ring region in M100. The absorption line indices of Hβ and MgFe50, first of all, show how the light from the nucleus of M100 and from its bar can be described simply by an old stellar population, whose age we estimate to be around 3 Gyr (Fig. 12). We thus confirm that the bar and the nucleus (bulge) are formed by old stars, as expected, and as confirmed in, e.g. the SST 3.6- and 4.5-μm maps (Fig. 3). The light from the nuclear ring, however, cannot be described neither by any single past star formation event, nor by continuous star formation (Fig. 12). For the ring, we thus develop alternative models, and find that the only way to reproduce the observed intermediate values of MgFe50 in combination with low Hβ is to introduce a past star formation event which stopped around 3 Gyr ago (where this figure is given by the age of the stars in the bar and nucleus). We cannot constrain the form of that event, whether it was one or several discreet bursts or a more continuous star formation, because each of these scenarios would by now have led to an identical old population, but the line index measurements in the ring do dictate an end to this episode of disc and bulge formation roughly at the time stated above. In addition, our model invokes recent and current star formation in the ring, which we of course know must exist to give the observed massive star formation rate. We can reproduce the observed line indices by a combination of the past event and one current burst of star formation (Fig. 14), but this particular model has the conceptual disadvantage that the ring would have been quiescent from 3 Gyr ago to very recently, which is at odds with the scenario in which the (long-lived and old) bar continuously feeds the ring with gas.
Our preferred model, then, reproduces the observed line indices by combining our past star formation event with a number (around five, say) of discreet but rapidly repetitive bursts, separated by, say, 100 Myr. In addition, our line indices and, independently, Hβ emission EW measurements show how the ages of the individual star-forming regions vary systematically azimuthally around the ring, with the youngest regions lying near the contact points where the dust lanes connect the bar and ring (discussed in more detail in Section 6.2). Given the nature of our data and the time-behaviour of line indices in such complex populations, we cannot constrain the parameters describing this series of bursts to high precision: for instance, five bursts of a certain intensity give the same line indices as six with slightly lower intensity. But the model we present here is entirely plausible, because it represents the star-forming nuclear ring as an entity that is regularly undergoing massive starbursts, and has done so during a period of time of the order of 5 × 10⁸ yr. This time-scale connects in a consistent manner the presence of a bar, which is presumably stable and long-lived (e.g. Jogee et al. 2004), and the nuclear ring, whose time-scales for both formation and, once formed, stability are entirely consistent with the modelling performed by K95a. Linear instability analysis (Elmegreen 1994) also suggests a time-scale of ∼108 yr for the lifetime of star formation in a nuclear ring. We thus confirm that nuclear rings are a stable configuration in which a bar feeds the ring with relatively cool gas flowing in from the disc, and in which the ring itself can host a number of consecutive massive star formation events.
6.4 Inner part of the bar
The 3.6- and 4.5- μm IRAC images allow us to revisit the parameters of the inner and outer parts of the bar of M100, which were inferred by K95a to be two parts of the same dynamical structure (i.e. bar). This conclusion was reached originally because the two bars have the same PA and a very similar radial ellipticity behaviour, and on the basis of the overall morphology of stars and dust lanes. The morphology of the inner part of the bar is severely distorted by the combined influence of dust extinction and emission by young stars, and this is even the case at 2.2 μm (see K95a for a detailed discussion). We can now use the IRAC images to revisit this issue; and for this purpose, we have run the ellipse-fitting task in the stsdas package of iraf on the 3.6-μm image. We were able to fit the radial runs of the surface brightness μ, the PA of the major-axis, and the ellipticity across the complete range in radius from the inner resolution limit near 2 arcsec to well into the optical disc, although the fits are less well constrained at the outer limits. The resulting fits, shown in Fig. 23, clearly confirm the results obtained in K95a on the basis of a K-band image of the inner part of the bar and an I-band image of the disc. The main characteristics are the two parts of the bar, defined by a very clear rise and fall of the ellipticity, in both cases from the disc value of 0.14 (corresponding to the inclination angle of the disc of 30°) to a maximum value of ε= 0.56 ± 0.015, which occurs at radii of r= 6.5 and 55 arcsec for the inner and outer parts of the bar, respectively. The PA is stable and identical (at a value of PA = 107°± 3°) at the location of both these peaks in ellipticity, but is higher in the region between them.
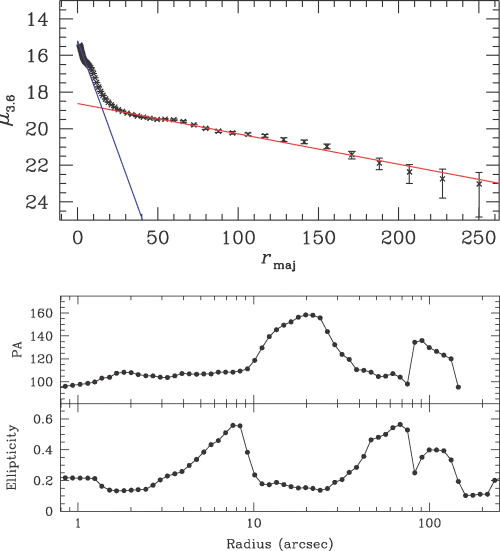
Radial profiles of surface brightness μ (top panel, with linear radial scale), and PA and ellipticity (middle and bottom panels, with logarithmic radial scale) as derived from ellipse fitting to the SST 3.6-μm image of the complete disc of M100. The μ profile has been calculated with fixed PA = 30° and ε= 0.149. Exponential scalelength fits are indicated for the bulge (blue) and disc (red), where the latter was fitted between radii of 35 and 150 arcsec. The two parts of the bar can be clearly seen as distinct rises and falls in the ellipticity profile.
The radial surface brightness profile shows the locations of both parts of the bar, but a detailed discussion of these and other features of this profile is outside the scope of this paper. We performed a bulge/disc decomposition on the 3.6-μm surface brightness profile, the results of which are shown in Fig. 23. The bulge fit yields an exponential scalelength of 4.5 arcsec, whereas the disc yields 65.6 arcsec. This latter value is not very different from the values given by Beckman et al. (1996), who report scalelengths between 67.5 and 76.4 arcsec for different optical wavebands (albeit determined over a larger radial than our 3.6-μm value). The fact that the scalelengths do not vary much, even going out to 3.6 μm, reinforces the conclusion by Beckman et al. (1996) that the galaxy does not contain much dust, except in localized areas (spiral arms).
In summary, we confirm the conclusion from K95a, but now on the basis of much better observational material, that the inner and outer parts of the bar of M100, located inside and outside the star-forming nuclear ring, have identical (within the error margins) radial elliptical and PA profiles. The inner part of the bar is not visible in the SAURON morphology maps, as it is primarily composed of older stars (K95a). The influence of the bar can be seen in the stellar kinematics, as a small deviation near the minor-axis. The stellar kinematics are derived from the stellar absorption features which contain a contribution from these older stars.
6.5 Nuclear ring morphology
The morphology of the nuclear ring changes dramatically with wavelength in the IRAC and 24-μm MIPS images considered here. Whereas the inner part of the bar and the emission regions K1 and K2 at its ends dominate the 3.6-μm image, the star-forming ring becomes gradually more prominent with increasing wavelength, as seen clearly in the colour index maps (Fig. 4) where the ring is consistently red. Because the emission from the nucleus is diminishing with increasing wavelength, the 8-μm image almost exclusively shows the ring, in which K1 and K2 are especially prominent. We interpret the tadpole shape of these regions as due to the emission from the well-known miniature spiral arm fragments due north and south of the nucleus, and labelled Hα3 and Hα4 in K95a (see Fig. 22). Comparison with the 24-μm image (Fig. 5). at much lower spatial resolution, shows that the northern spiral armlet, Hα4, is a much more active star-forming region than its southern counterpart Hα3. This is consistent with, but could not reliably have been deduced from, the other data: for instance, K95b found that Hα4 was not only a bit brighter, but also somewhat dustier than Ha3, and the 8-μm image also shows more emission from Hα4 than Hα3.
6.6 K1 and K2
The emission from the nucleus dominates at the shorter IRAC wavelengths, and emission from the two symmetrically placed regions at the ends of the inner part of the bar is equally strong in the western (called K1 in K95a) and the eastern (K2) sites. These were described by K95a to be symmetric regions of star formation, where K2 was postulated to be more obscured by dust than K1. The ages of K1 and K2 are similar, between 15 and 25 Myr, as modelled on the basis of UBV imaging (K95a) and near-IR spectroscopy (Ryder & Knapen 1999). The ages derived from the absorption line indices from the SAURON data are model dependent, but K1 and K2 are found to have similar Hβ absorption indices (indicating similar ages).
The SST imaging confirms that K1 and K2 are intrinsically very similar. By measuring the flux within two matched apertures of 2.4 arcsec in diameter centred on K1 and K2, we find that indeed the flux ratio K2/K1 is close to unity. The ratios (K2/K1 flux) measured in this way are 0.88 for Hβ (using the SAURON data), 1.13 for Hα, 0.95 at K (using images from K95a for Hα and K), 0.97 at 3.6 μm, 1.05 at 4.5 and 5.8, 1.09 at 8.0, and finally 1.29 at 24 μm. These ratios are consistent with K2 being more dusty than K1, and in fact the ratios at Hα and Hβ allow an estimate of dust extinction by a factor of 1.2 higher at K2 than at K1. K2 is forming more stars than K1, as indicated by the most direct SF tracer, the 24-μm image (Calzetti et al. 2005), and as corroborated by the high Hα K2/K1 ratio. The slow increase in the K2/K1 flux ratio from 2.2 to 8 μm is consistent with this picture. We should point out that we did not attempt to subtract the underlying emission from disc, bulge and nuclear ring from the fluxes at K2 and K1.
7 CONCLUSIONS
This paper presents SAURON integral field observations of the central region and bar of M100, which yields the gaseous and stellar kinematics, and emission and absorption line strength maps. We complement this data set with SST near- and mid-IR imaging of M100. The basic emission-line morphology is that of the well-known nuclear ring which shines brightly in Hβ, and which is linked to H ii regions at the eastern end of the bar by a thin arc of ionized gas, running alongside but offset from the dust lanes (see also Paper I). In [O iii] the morphology shows a central peak, while generally tracing the Hβ emission.
The Hβ and [O iii] gas kinematics show regular rotation along the bar, equivalent to an inclined rotating disc, but with characteristic kinks in the velocity field along the bar minor-axis, near the radius of the nuclear ring. The stellar velocity field is similar to that of the gas in the bar, and the non-circular motions are only slightly less evident near the centre, and practically as strong as in the gas along the bar minor-axis. As discussed in more detail in Paper I, the Hβ gas velocity dispersion shows a lower value where the star formation occurs, in the ring and at the ends of the bar, and also alongside the eastern dust lane. The [O iii] gas velocity dispersion shows a slight decrease in the ring, and has a much higher central value than Hβ.
The Mgb and Fe5015 absorption line indices show lower values within the ring suggesting that a younger stellar population is diluting the deep absorption features of the older bulge population. The Hβ absorption line index shows a broken ring, with the breaks occurring where the Hβ emission is the strongest. All three absorption line indices, as well as the Hβ EW, show that the youngest stellar populations are found at the contact points between the ring and the dust lanes.
Detailed modelling of the line strengths shows that old stars are present in addition to the young population which dominates the appearance of the ring, mostly so in emission lines like that of Hβ. These old stars must have been formed in a past star formation event which produced the bulk of the mass, and which stopped some 3 Gyr ago, a constraint set by the age of the stars in the bar and the nucleus. Our best-fitting model is one in which the current star formation is but the latest of a series of relatively short bursts of star formation which have occurred for the last 500 Myr or so. A clear bipolar azimuthal age gradient is seen within the ring, with the youngest stars occurring near where the bar dust lanes connect with the ring.
Our kinematic and morphological results thus confirm a picture in which the nuclear ring in M100, considered typical, is fed by gas flowing in from the disc under the action of the bar, is slowed down near a pair of resonances, and forms significant amounts of massive stars. Detailed stellar population modelling shows how the underlying bulge and disc were put in place a number of Gyr ago, and that the nuclear ring has been forming stars since about 500 Myr ago in a stable succession of bursts. This confirms that nuclear rings can form under the influence of a resonant structure set up by a bar, and proves that they are stable features of a galaxy rather than one-off starburst events.
We thank Isaac Shlosman and Tim de Zeeuw for comments on an earlier version of this manuscript. Based on observations made with the WHT, operated on the island of La Palma by the Isaac Newton Group in the Spanish Observatorio del Roque de los Muchachos of the Instituto de Astrofísica de Canarias, and with the SST, which is operated by the Jet Propulsion Laboratory, California Institute of Technology under a contract with NASA. We thank the SAURON team for making the instrument and the associated software available for this collaborative project. SAURON was made possible through grants from the Netherlands Organization for Scientific Research, the Institut National des Sciences de l'Universe, the Universities of Lyon I, Durham, Leiden, and Oxford, the British Council, the Particle Physics and Astronomy Research Council and the Netherlands Research School for Astronomy NOVA. ELA is supported by a PPARC studentship, and thanks the Kapteyn Astronomical Institute for its hospitality during a few visits. JHK acknowledges the Leverhulme Trust for the award of a Leverhulme Research Fellowship.
REFERENCES
This value differs from that given in Paper I, where we give 98 ± 4 km s−1 due to a correction applied to the stellar dispersion map (see Section 2.4), but this would not affect any of the conclusions of Paper I.
Thomas & Davies (2006) found that Hβ was the least abundance-sensitive Balmer line age indicator.
Mg is taken to be representative of all α elements.


