


Abstract
We have studied the kinematics and spatial distribution of the interstellar gas in the sky region 110°≤l≤ 135°, 10°≤b≤ 20°, using the extensive Leiden–Dwingeloo Survey of H i emission and the Columbia Survey of CO emission. The spectra show two main velocity components, namely feature A that has a mean local standard of rest (LSR) velocity of ∼0 km s−1 and is due to the Lindblad ring of the Gould belt, and feature C that has a mean LSR velocity of ∼−11 km s−1 and is associated to the local arm or Orion arm. The H i and CO distributions of feature A in the region trace a large complex of gas and dust known as the Cepheus Flare, which lies at a distance of 300 pc. The spectral line profiles of feature A, which are rather broad and often double-peaked, reveal that the Cepheus Flare forms part of a big expanding shell of interstellar matter that encloses an old supernova remnant associated with a void inside the Cepheus Flare. On the other hand, by analysing the distribution and velocity structure of feature C, we have detected a second large expanding shell in the region, located at a distance of 800 pc in the local arm. This shell surrounds the stellar association Cepheus OB4 and was probably generated by stellar winds and supernovae of Cepheus OB4. The radii, expansion velocities and H i masses of the two shells are approximately 50 pc, 4 km s−1 and 1.3 × 10⁴ M⊙ for the Cepheus Flare shell and 100 pc, 4 km s−1 and 9.9 × 10⁴ M⊙ for the Cepheus OB4 shell. Both shells have similar ages of the order of a few 106 yr.
1 INTRODUCTION
The Upper Cepheus-Cassiopeia region is seen well off the Galactic plane and is characterized by the presence of a large complex of dark clouds. This region is also known as the Cepheus Flare region since Hubble (1934) noted the extension toward high latitudes of the zone of avoidance of galaxies. The Cepheus Flare can therefore be considered as a prominent feature of the local interstellar medium (ISM), comparable to the Orion and Taurus complexes. There are two major systems of gas and stars around the Sun: the Gould belt and the Orion arm. Therefore, it is probable that part of the interstellar gas of the Upper Cepheus-Cassiopeia region is associated with the Gould belt and part with the Orion arm.
Heiles (1967) observations of the 21-cm line emission of atomic hydrogen in the Cepheus region (100°≤l≤ 140°, 13°≤b≤ 17°) revealed the existence of two relatively narrow velocity components. Heiles interpreted them as two sheets of interstellar gas, representing an expanding or colliding system at a distance interval of 300–500 pc. Two local velocity components, called features A and C (Lindblad 1967), are also seen in 21-cm observations over most of the Galactic plane. Feature C is identified with the local (or Orion) arm and feature A with the Gould belt as an expanding ring surrounding the Sun (Lindblad 1967; Olano 1982). The local standard of rest (LSR) velocities of the two H i components of the Cepheus region are ∼0 and ∼−12 km s−1, similar to the velocities that should correspond to features A and C in the region. It would then indicate that the H i components of Cepheus are identical to features A and C, forming part of the two large-scale local systems. If so, this view seems incompatible with the interpretation of two physically associated gas sheets such as the receding and approaching parts of an expanding shell, separated kinematically and spatially by 10 km s−1 and 200 pc.
Extensive CO mapping of Cepheus (Dame et al. 1987) shows that the global kinematics of molecular clouds of the region coincides with that of H i. Grenier et al. (1989), based on a study of CO, soft X-ray and radio continuum observations, found evidences of a supernova bubble in Cepheus. Grenier et al. (1989) concluded that the distance of the supernova bubble is of 300/400 pc and that it could be associated with the Lindblad H i expanding ring, that is, feature A of the Gould belt. However, the above mentioned studies show that the velocity structure of interstellar gas of the region is complex and it is difficult then to identify the pieces of an expanding shell that can be attributed to the supernova bubble proposed by Grenier et al. (1989). Hence, our objective is to investigate further the distribution and kinematics of interstellar H i and CO of the region 110°≤l≤ 135°, 10°≤b≤ 20°, in order to search for details in feature A of the Gould belt, or in feature C of the local arm, that may help to find the expanding shell of the supernova bubble.
2 ANALYSIS OF THE OBSERVATIONAL MATERIAL
The basic data set which we analyse is the Leiden–Dwingeloo H i Survey (Hartmann & Burton 1997) and the Dame et al. (1987) Galactic CO Survey. The 21-cm H i line measurements were made at regular intervals of 0°.5 in the Galactic coordinates l and b, with a resolution of 1.03 km s−1 in the radial velocity v. The angular spacing and the velocity resolution of the CO 1 → 0 line observations are similar to those of H i data. The elemental set of data provided by the Surveys is the spectrum observed in a fixed direction (l, b), which is expressed usually as the brightness temperature as a function of v, that is, Tb(v) (see Fig. 1).
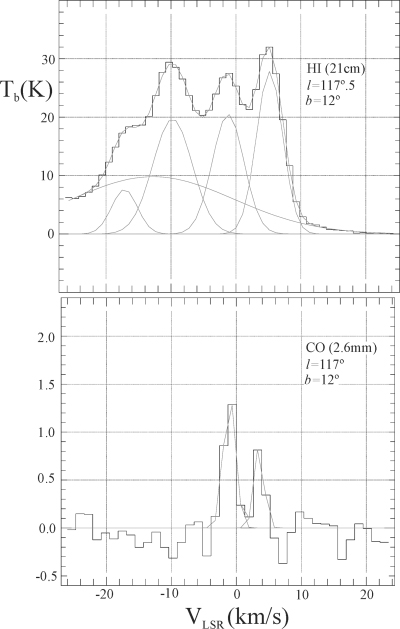
Spectrum of the 21-cm line of H i at l= 117°, b= 12° (upper panel) and spectrum of the 2.6-mm line of CO at a position close to that of H i (lower panel). The fitted velocity components and their sum are superposed on the observed spectrum (histogram).
In Section 2.1, we will analyse the representations Tb(v, l) for a given b and Tb(l, b) for a given v (see Figs 2–4), which are useful to obtain an overview of the region. In Section 2.2, we will analyse in detail each spectrum of the region in order to evaluate the physical parameters of the various velocity components of the interstellar gas in the Upper Cepheus-Cassiopeia region.
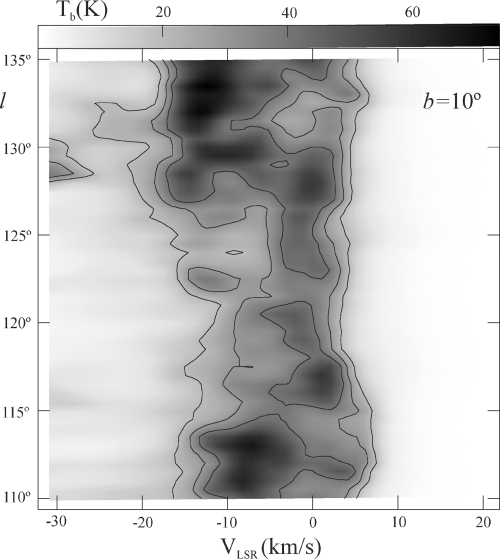
Brightness temperatures of the 21-cm line of the neutral atomic hydrogen as function of radial velocity (relative to LSR) and Galactic longitude (l= 110–135) at the Galactic latitude b= 10; The contours are at Tb= 20, 30 and 40 K.
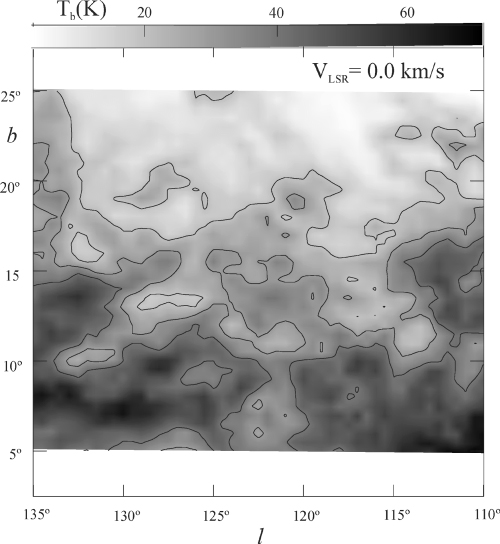
Map in Galactic coordinates of the intensity of the H i radiation at the mean velocity of feature A: 0 km s−1. The grey-scale at the top of the figure indicates the scale of intensities expressed in brightness temperatures. The drawn contours of brightness temperatures correspond to 20, 30 and 40 K.
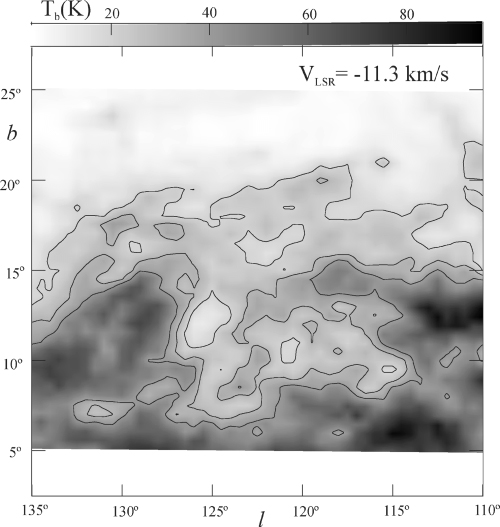
As Fig. 3, but for feature C.
In the following, we will propose a simple model for the kinematical and spatial structure of the ISM of the region in terms of two expanding shells, spatially and kinematically separated, that explains reasonably well some relevant facts resulting from the optical and radioastronomical observations. We will also show that the velocity field and the distribution of H i and CO in the region are very complex and that hence our description and interpretation of the observational data in the light of our model will be necessarily a simplification and synthesis of the reality.
2.1 General description of the region
Our Fig. 2 (see also fig. 5 of Heiles 1967) displays the characteristic pattern of the velocity distribution of H i in Cepheus: the two-component structure of the spectra. These two main velocity components at ∼0 and ∼−12 km s−1 were called the low-velocity sheet (LVS) and the high-velocity sheet (HVS) by Heiles (1967). On the basis of the kinematic structure of these two objects revealed by the position–velocity diagrams (e.g. Fig. 2), Heiles (1967) gave two possible interpretations: (1) they are the approaching and receding parts of an expanding shell or (2) the two sheets of gas are approaching each other, with a part in mutual collision (see fig. 8 of Heiles 1967). On the other hand, the mean velocities of these objects in the region as well as their distances from the Sun, 300 pc for LVS and 800 pc for HVS, permitted to identify the LVS with Lindblad's feature A and the HVS with Lindblad's feature C (Dame et al. 1987; Grenier et al. 1989; Kun 1998). In other words, the HVS lies behind the LVS. With this location of the features, the first interpretation should be discarded, while the second interpretation of Heiles (1967) can be conciliated within the general framework of a model for the local system of gas and stars (Olano 2001).
It is easily visible on Fig. 2 that features A and C are highly fragmented, a characteristic of the region described by Heiles (1967) as rifts within thin H i structures. Another characteristic is that these features have a complex fine structure (i.e. subcomponents overlapped partially in velocity). The upper panel of Fig. 1 shows the H i profile of a position in which four relatively narrow H i components are clearly distinguished. The corresponding CO counterpart at a close position (lower panel of Fig. 1) reveals the same double-peaked structure for feature A, while for feature C there are no CO detections at its velocities.
We interpret the two peaks closer to zero velocity as subcomponents of feature A, and those closer to −12 km s−1 as subcomponents of feature C. Feature A in the Cepheus region can be thought as a gas wall lying at a distance of 300 pc, and feature C as a gas wall at 800 pc (Dame et al. 1987). An explanation of the velocity structure in the region gas is that strong perturbations due probably to stellar winds and/or supernovae within each feature (wall) have formed an expanding shell. In other words, there are two H i shells along the line of sight in Cepheus, one associated with feature A and the other with feature C. Both features were split in subcomponents with velocities lower (the approaching parts of the shell) and greater than the mean velocity of the corresponding feature (the recceding parts of the shell). This idea is substantiated by the H i distributions of both features in Cepheus as seen at their mean velocities (see Figs 3 and 4), which show an ample region within each feature with a notable H i deficiency. In feature A, the region relatively depleted of atomic gas is coincident with a region also largely free of CO emission, centred at lc≃ 120°, bc≃ 13° and surrounded by a chain of nearby clouds forming a broad ring of 12° in diameter (Grenier et al. 1989). The striking H i hole in feature C (see Fig. 4) is centred at lc≃ 122°, bc≃ 12° and has a diameter of ≃10°. The comparison of our Fig. 4 with fig. 4 of Grenier et al. (1989) shows that this hole is also depleted of molecular gas. This would mean that within the angle subtended by the hole the original substratum of gas was completely disturbed, dissociating most of the molecules. Then an estimation of the original thickness of features A and C in Cepheus should be the diameter of their respective holes (60 and 140 pc). Thus, the denomination of wall or sheet of gas in Heiles (1967) paper for these features, then seems appropriate. Let us remember that the sections of features A and C observed in the Cepheus region are small when compared with the whole objects, which would constitute two large concentric rings that enclose the Sun (Olano 2001).
2.2 Gaussian analysis of the observed spectra
In order to derive physical parameters of the Cepheus gas components, we fitted Gaussian functions to the H i and CO spectra by means of a least-squares method. For this purpose, we used the program, Drawspect, developed by H.S. Liszt (see his web page in http://www.cv.nrao.edu/~hliszt/). We assumed that each brightness temperature spectrum is the result of a sum of Gaussian components characterized by their respective central velocities VLSR, Gaussian velocity dispersions σ and maximum brightness temperatures Tp. This is strictly valid only if all components of the spectrum are optically thin and thermally broadened. Although this condition cannot be exactly fulfilled in general, the Gaussian decomposition of the observed profiles is still convenient to obtain approximate values for the physical parameters of the components. Other limitations of the method are the non-uniqueness of the Gaussian fit and the subjectivity in the election of the number of components and their initial parameters. However, these uncertainties can be minimized, if a correct interpretation of the structure and physical state of interstellar matter in the region under study is made.
For all H i spectra, we assumed the existence of an underlying wide component of σ∼ 10 km s−1 (see Fig. 1), representing the warm neutral medium, WNM (Heiles & Troland 2003). A large part of this width of the wide component is explained by thermal broadening. The WNM is widely distributed in the Galactic disk, forming a thick stratum of gas. Thus, the large-scale motions such as those due to the Galactic rotation and to the spiral density waves contribute also to the broadening of the wide component giving it a non-Gaussian shape. In spite of these non-thermal of broadening effects, it can be demonstrated that the wide component preserves a quasi-Gaussian shape for latitudes b≥ 10° (see fig. 4.23 of Pöppel 1997), as is the case for the spectra we analyse here. On the other hand, the cold neutral medium (CNM) is constituted by discrete structures observed in the H i spectra as relatively narrow velocity components, σ∼ 3 km s−1 (see Fig. 1).
For each subcomponent of the components A and C and for each analysed position (l, b), we obtained the central velocity VLSR(l, b), the velocity width σ(l, b) and the peak brightness temperature Tp(l, b) of the subcomponent. The mean velocity  and the mean width
  of each compound component in the studied region of the sky were calculated averaging VLSR(l, b) of its subcomponents over all positions (l, b) (see Table 1). The velocity widths of features A and C are of 2.3 and 2.6 km s−1, indicating that both features consist essentially of cold gas. The dispersion of the mean velocity
  of the component
  is given in Table 1. The mean separation of the subcomponents,
  , as compared with their mean width
  reflects the degree of difficulty of the Gaussian decomposition. The value of
  would reflex the systemic movements of the gas within the component. If these movements are the result of a spherical shell expanding radially with velocity vexp, then
  . The radial velocity of this shell at the position (l, b) can be expressed by

where  and r are the distance and radius of the shell, respectively, and α(l, b) is the angle between the direction to the centre of the shell (lc, bc) and the direction to the observed point (l, b). Then sin 2α(l, b) = 1 −[sin b sin bc+ cos b cos bc cos (l−lc)]2. The ‘+’ and ‘−’ signs in equation (1) refer to the half of the shell expanding away from and towards the observer, respectively.
Mean values of the Gaussian kinematic parameters of the H i components.
| Name |  |  |  |
|---|---|---|---|
| Feature A | 0.2 | 2.3 | 3.1 |
| Feature C | −11.4 | 2.6 | 2.9 |
| Wide component | −9.6 | 10.8 | 2.9 |
| Name | | | |
|---|---|---|---|
| Feature A | 0.2 | 2.3 | 3.1 |
| Feature C | −11.4 | 2.6 | 2.9 |
| Wide component | −9.6 | 10.8 | 2.9 |
Mean values of the Gaussian kinematic parameters of the H i components.
| Name | | | |
|---|---|---|---|
| Feature A | 0.2 | 2.3 | 3.1 |
| Feature C | −11.4 | 2.6 | 2.9 |
| Wide component | −9.6 | 10.8 | 2.9 |
| Name | | | |
|---|---|---|---|
| Feature A | 0.2 | 2.3 | 3.1 |
| Feature C | −11.4 | 2.6 | 2.9 |
| Wide component | −9.6 | 10.8 | 2.9 |
To compare the velocity field of the H i and CO gas with the idealized velocity pattern for the expanding shells associated with features A and C in Figs 5 and 6, we represent the central velocities of the subcomponents of features A and C as a function of l and b and the curves are given by equation (1). The shells expand within a relatively thin layer of non-uniform gas density, whose contour conditions we ignore. Hence, the model of an expanding spherical shell can only provide a rough approximation to the actual physics. Only a small amount of the velocity dispersions observed in Figs 5 and 6 can be attributed to the uncertainties of the Gaussian decomposition. A major part of these velocity dispersions reflects likely the non-isotropic expansion of the shells. In other words, the different parts of a shell move with different expansion velocities as a consequence of the shell's interaction with a turbulent ISM of non-uniform density. In spite of the fact that the expansion velocities of the shells, their velocity dispersions and the turbulent velocities of the ambient medium are quite similar, we can still recognize some pieces of the shells. Figs 5 and 6 suggest that the presence of two shells, one with vexp∼ 4 km s−1 and r= 50 pc lying in feature A at a distance of 300 pc and the other with vexp∼ 4 km s−1 and r= 100 pc lying in feature C at a distance of 800 pc, is consistent with the velocity structures of the H i and CO gas. We obtained the column densities of H i (NH) for features A and C (see Figs 7 and 8), assuming that the gas is optically thin. The H i column density in a given position of the feature is the sum of the column densities of its subcomponents.
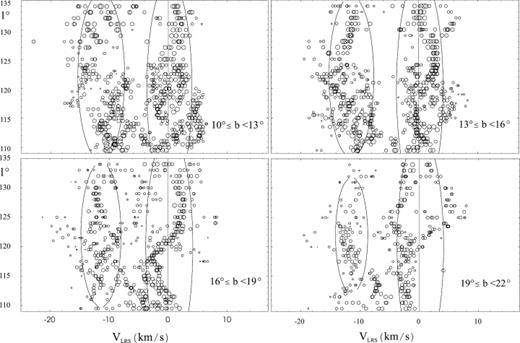
Longitude–velocity diagrams for the derived Gaussian H i components. The centre position (VLSR, l) of each component is represented by open circles whose sizes are proportional to the log of the intensity Tp(l, b) of the component. The plotted latitude ranges are indicated in the lower right-hand corners of the figures. The continuous curves represent two shells given by equation (1) with vexp= 4 km s−1, r= 50 pc and d= 300 pc for the shell of feature A; and vexp= 4 km s−1, r= 100 pc and d= 800 pc for the shell of feature C.
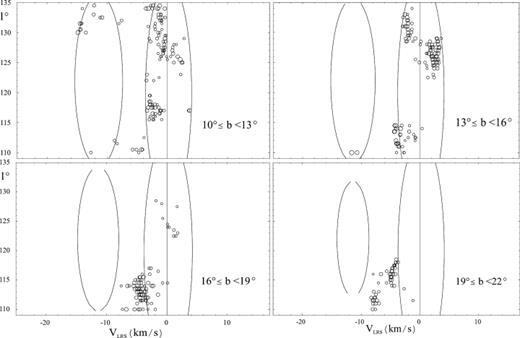
The same as Fig. 5, but for the derived Gaussian CO components. Here, the sizes of the circles are proportional to log of 10 times the intensity Tp(l, b) of the component.
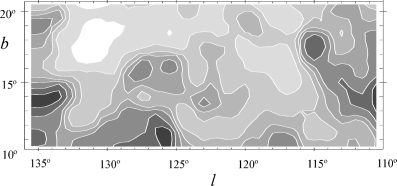
Distribution on the plane of the sky of the H i column density of feature A. The contours of NH are 10, 15, 20, 25, 30, 50 and 60 in units of 1019 atoms cm−2. The darkest shading corresponds to NH > 60 × 1019.
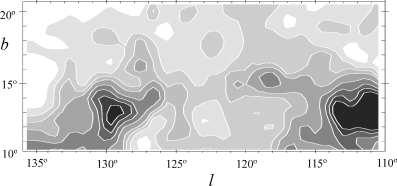
Distribution on the plane of the sky of the H i column density of feature C. The contours of NH are 10, 15, 20, 25, 45, 55, 65, 75, 85 and 95 in units of 1019 atoms cm−2. The grey tones increase with NH and the darkest shading corresponds to NH > 95 × 1019.
Fig. 9 shows that the overall distributions of the atomic and molecular material in feature A are correlated. It is interesting to compare our Fig. 9 with figs 1 and 10 of Kiss et al. (2000), which show the correlation between the 21-cm radiation and the 100 μm far-infrared emission in a region in common. The CO appears to concentrate in the regions of greater column density of H i. Hence, the distribution and the kinematics of both atomic and molecular gas (see also Figs 5 and 6) are consistent with the interpretation of an expanding shell in feature A.
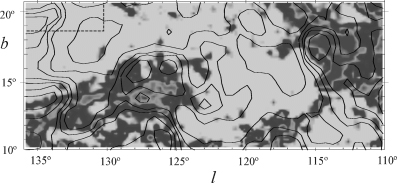
Comparison of the distributions of the CO and H i of feature A. The shadings represent the CO emission (Dame, Hartmann & Thaddeus 2001). The overlaid contours represent the NH distribution of feature A given in Fig. 7.
3 CHARACTERISTICS OF THE TWO SHELLS
The main properties of the two shells are summarized in Table 2. The masses MH I for both shells were estimated by integrating the derived H i column densities over the mapped region (Figs 7 and 8) with the adopted distances to the shells (column 4 of Table 2). The total molecular gas mass of the clouds associated with the shell in feature A, which we will call the Cepheus Flare shell, amounts 4.7 × 10³ M⊙ (see fig. 7 and table 2 of Yonekura et al. 1997). Kun (1998) determined distances for a sample of dark clouds Cepheus Flare region. The mean distance to these dark clouds is 300 ± 70 pc (see table 4 of Kun 1998). The large dispersion in the distances of the Cepheus molecular clouds found by Kun (1998) is in agreement with the size adopted for the shell in feature A. The kinetic energy of each shell defined by  is given in column 8 of Table 2. Taking into account that the kinetic energy of a shell is a few percent of the total energy needed to produce the shell, the energy requirements of the shells are of order 1050 and 1051 erg; that is, equivalent to the energy released by the explosion of a supernova. Hence, the origin of the H i shells as supernova remnants should be considered. Following Chevalier (1974), the age of an old SNR may be estimated as t(106 yr) = 0.3r(pc)/vexp(km s−1). Thus, the ages result in 4 106 yr for the Cepheus Flare shell, and 8 106 yr for that in feature C (i.e. The Cepheus OB4 shell, see Section 3.2).
Main parameters of the shells. References: (1) Kun (1998) and (2) Dame et al. (1987).
| Name of the shell | Associated H i feature | (lc, bc) | d(pc) | r (pc) | vexp(km s−1) | MH i (M⊙) | Ek (erg) |
|---|---|---|---|---|---|---|---|
| Cepheus Flare shell | Feature A | ∼(120°, 17°) | 300 (1) | ∼50 | 4 | 1. 3 × 10⁴ | 1. 58 × 1048 |
| Cepheus OB4 shell | Feature C | ∼(122°, 10°) | 800 (2) | ∼100 | 4 | 9. 9 × 10⁴ | 1. 37 × 1049 |
3.1 The Cepheus Flare shell
The Cepheus Flare shell, that is, the H i and CO shell detected in feature A, encloses a bubble of hot plasma which is responsible for the X-ray emission (Grenier et al. 1989) and a radio loop seen at 408 MHz (Haslam et al. 1981). According to Grenier et al. (1989), this bubble was originated by a SNR with an energy of 1051 erg and with an age of 4 × 10⁴ yr. Note that the ages of the shell and the bubble do not agree. This discrepancy can be explained if the shell was blown by the stellar wind of a massive star that finally exploded as a supernova of Type II inside the pre-existing wind-driven cavity (Franco et al. 1991; Tenorio-Tagle et al. 1991). The characteristics of this supernova remnant derived by Grenier et al. (1989) from a fit to the X-ray data are given in their Table 2. During the SNR phase, the shell is reheated and accelerated. We will ignore the shell evolution during this phase, which is very complex [we remit to Franco et al. (1991) and Tenorio-Tagle et al. (1991)]. To calculate the characteristics of the stellar wind that originated the expanding H i shell, we used the classic expressions of Weaver et al. (1977): r(pc) = 27(L36/n0)1/5t3/56 and vexp(km s−1) = 16 (L36/n0)1/5t−2/56, where n0 is the original ambient density in atoms cm−3, L36 is the total wind energy flux in units of 1036 erg s−1 and t6 is age of the shell in units of 106 yr. Putting the values of the observable parameters, r= 50 pc, vexp= 4 km s−1 and n0=MH I/(4/3) πr3∼ 1 atom cm−3 into these equation, we obtain t= 7 × 10⁶ yr and LW= 6 × 1034 erg s−1 The kinetic energy of the shell can then be derived assuming a snowplough model, that is, an expanding shell with increasing radius and mass, whose momentum is conserved: Ek= 7.5 × 1048L36t6∼ 3 × 1048 ergs; value similar to the observed one (see column 8 of Table 2). Since the age of the SNR is relatively short, the age of the shell is considered equal to the lifetime of the progenitor star. A star of spectral type between O5V and O9V fulfils with these theoretical requirements for the power of the wind and the stellar lifetime. These results support the idea that an O star spent its life within the H i shell. Certainly if there were an OB association in the Cepheus Flare region it would be easier to justify the presence of the O star in a past time. Perhaps, the formation of the OB association was inhibited by the premature formation of a massive star within the parent cloud of the forming OB association, which led to the disruption of the placental clouds. On the other hand, it is known that individual low-mass clouds also produce high-mass stars (Garmany 1994). Hunter Thronson & Wilton (1990) noted regions of massive formation in clouds with masses ranging from 1 to 60 × 103 M⊙. Kun (1998) and Bally & Reipurth (2001) suggested that the massive star formation has taken place within the many clouds in the Cepheus Flare. This could explain the existence of supernova remnants at various stages of development through the region. Bally & Reipurth (2001) found several parsec-scale filaments of emission which trace the rim of a new supernova remnant, G110.3 + 11.3, located near the edge of the Cepheus Flare shell. The space motion of the runaway star HD203854 (Kun, Vink & Szabados 2000) would indicate that an SN explosion occurred within the Grenier bubble about 106 yr ago. Various star formation studies (see Kun (1998), and references therein) clearly show that low-mass star formation is in progress inside some clouds of this region. Kun (1998) noted that these star-forming centres are located near the edges of the clouds, suggesting that an external shock induced the star formation. The dynamic behaviour of the molecular cores in L1251, L1247 and L1243 belonging to the Cepheus Flare can also be interpreted in terms of the passage of a slow shock through this chain of molecular clouds (Sato et al. 1994; Tóth & Walmsley 1996). This shock wave could well be the same which originated the H i and CO shell in the Cepheus Flare.
At the top of the Cepheus Flare shell, between b= 15° and 40°, there is a prominent H i ring called the North Celestial Pole Loop (Heiles 1989; Meyerdierks, Heithausen & Reif 1991) or the Polar Ridge (Fejes & Wesselius 1973). This H i complex is related with a large molecular cirrus cloud known as the Polaris Flare (Heithausen & Thaddeus 1990; Heithausen et al. 1993; Meyerdierks & Heithausen 1996). This gas ridge can be interpreted as a product of the material ejected by a chimney effect from the Cepheus Flare shell. The gas filaments which look like ‘worms’ or ‘chimneys’ are common in the ISM (Heiles 1991). They are probably parts of shells that are open at the top (Heiles 1984; Olano 1985). From the velocity of ejection of 28 km s−1 (Meyerdierks 1989) and the length of the Polar Ridge of 140 pc, the kinematic age of the ring is around 5 × 10⁶ yr, similar to the age of the shell. The positional coincidence between the ring and a long narrow string of high-velocity H i clouds, called Chain A or Complex A (Hulsbosch 1968) points to consider the possibility of a physical connection between them (Meyerdierks 1989, 1991, 1992). Indeed, the collisions of HVCs with the Galactic disk can produce effects on the ISM similar to those of the supernova explosions (see Olano 2004, and references therein). However, the scenario of the shell and the Polar Ridge originated by a stellar source seems more probable within the context in which the Cepheus Flare lies: the Gould belt. In the periphery of the Lindblad ring associated with the Gould belt, there are a number of stellar OB associations each surrounded by an expanding H i shell like the Cepheus Flare shell (Olano & Pöppel 1981; Cappa de Nicolau & Pöppel 1986; Cappa de Nicolau & Olano 1990; Olano, Walmsley & Wilson 1994; Pöppel 1997).
3.2 The Cepheus OB4 shell
The H i shell related with the large-scale feature C encircles Cepheus OB4, an association of approximately 40 OB stars spread over a 5° region with centre on l= 118°, b=+5°. We will show that both objects are plausibly related. Cepheus OB4 forms, together with Cep OB2 and Cep OB3, part of a chain of OB associations located between 800 and 1000 pc from the Sun and likely related with molecular complexes of feature C, VLSR∼−11 km s−1 (Dame et al. 1987). A number of authors (Grayzeck 1980; Rossano, Angerhofer & Grayzeck 1980; Luo 1995; Gredel 2004) have studied the interstellar material associated with Cep OB4. The LSR velocity of the gas linked to Cep OB4 is approximately −8 km s−1[see table I of Grayzeck (1980), and references therein], which is comparable to the velocities of feature C and of the associated H i shell. Then, this is the typical case of an OB association surrounded by a big expanding H i shell of cool interstellar gas. The age and energy of the shell are compatible with the age of Cepheus OB4, 1–6 × 10⁶ yr (MacConnell 1995), and with the energy which an OB association can supply through stellar winds and supernovae.
We note the adopted centre of the H i shell is displaced in ∼3° from the border of Cep OB4 (see fig. 24 in de Zeeuw et al. 1999). However, we should remember that the boundaries of an association, as well as the geometrical centre of the shell, are very ill defined. For instance, a sign of recent stellar activity in the periphery of Cep OB4 could be the young supernova remnant CTA1 located at l= 119.5°, b=+9.8° (Huang & Thaddeus 1986). On the other hand, the geometrical centre and the expansion centre of the shell located within the boundaries of Cep OB4, can hardly agree, if the expansion of the shell was not isotropic. Indeed, this seems to be the case, because of the high position of Cep OB4 above the Galactic plane, z∼ 70 pc.
4 CONCLUSIONS
From a detailed analysis of the H i and CO spectra of the region 110°≤l≤ 130°, 5°≤b≤ 25°, we have found the kinematic signature of a large structure of interstellar gas which involves the Cepheus Flare and which can be interpreted as an expanding shell enclosing the old supernova bubble discovered by Grenier et al. (1989). This shell lies at a distance of 300 pc from the Sun, and the radius, the expansion velocity and the H i mass of the shell are approximately 50 pc, 4 km s−1 and 1.3 × 10⁴ M⊙, respectively.
Beside the Cepheus Flare shell, we discovered another gas shell in the same region of the sky. This shell surrounds the OB association Cepheus OB4 at 800 pc from the Sun within a concentration of H i associated with the local arm. The Cepheus OB4 shell has a radius of 100 pc, an expansion velocity of 4 km s−1 and an H i mass of 9.9 × 10⁴ M⊙
The Cepheus Flare and Cepheus OB4 shells are a few 106 yr old. The Cepheus Flare shell was rejuvenated with the supernova explosion whose remnant of about ∼104 yr old filled the cavity of the shell. The expansion velocities of both shells are close to the turbulent velocities of the interstellar gas, indicating that they evolve through the final stages in which the shells merge with the ambient ISM. We have discussed the possible causes that gave origin to the shells. All evidences suggest that the shells are the result of the interaction of young and massive stars, through stellar winds and supernova explosions, with the surrounding interstellar gas. In our interpretation, the Cepheus Flare shell was insufflated from the interior of the pre-existent Cepheus Flare: a gas sheet forming part of the Lindblad ring of the Gould belt (feature A). Similarly, the Cepheus OB4 shell was formed in the interior of the local arm (feature C). In other words, they are secondary shells formed within the walls of bigger shells.
We wish to thank Norma Caballero and Dr. M. Cristina Martín, who participated in a preliminary study of an ample region of the second Galactic quadrant, including a part of the Cepheus Flare region. Dr. Cristina E. Cappa taught us how to use the AIPS program. An anonymous referee helped us to improve the manuscript. This work has received financial support from IALP, CONICET, Argentina.
REFERENCES
Author notes
Member of the Carrera del Investigador Científico of the CONICET, Argentina.
Member of the Carrera del Investigador Científico of the CIC-BA, Argentina.
