


Abstract
We have undertaken visual spectroscopy of the highly evolved planetary nebulae (PNe) A8, A13, A62, A72, A78 and A83 over a wavelength range 4330 < λ < 6830Å. This permits us to specify relative line intensities in various sectors of the nebular shells, and to investigate the variation of emission as a function of radius. We determine that the spectrum of the central star of A78 has varied appreciably over a period of 25 yr. There is now evidence for strong P Cygni absorption in the λ4589 and λ5412 transitions of Heii, implying terminal velocities of the order of V∞≅ 3.83 × 10³ km s−1. We also note that the emission-line profiles of the sources can be used to investigate their intrinsic emission structures. We find that most PNe show appreciable levels of emission throughout their volumes; only one source (A13) possesses a thin-shell structure. Such results are in conformity with evolutionary theory, and probably reflect the consequences of adiabatic cooling in highly evolved outflows.
1 Introduction
The evolution of planetary nebulae (PNe) is associated with a broad range of changes to their physical, radiative and kinematic properties. As shells expand, for instance, then their densities decrease, their ionized masses MI increase, and they become optically thin to Lyman continuum ionizing radiation (e.g. Pottasch 1996; Phillips 1998; Marigo et al. 2001). Similarly, central stars are expected to evolve to higher temperatures, after which hydrogen (or helium) burning ceases, and their temperatures and luminosities decline (Schonberner 1993; Marigo et al. 2001).
The latter phases of this evolution are rather poorly defined, although it is clear that the decline towards the white dwarf sequence is not always entirely tranquil. Certain sources appear to undergo a late helium flash, for instance, which may lead to the ejection of hydrogen-depleted shells, and a repositioning of central stars within the Hertzsprung–Russell (HR) plane (e.g. Iben et al. 1983). Similarly, low-density shells become more prone to disruption by the interstellar medium (ISM), and this may lead to asymmetric enhancement of the shell emission, displacement of the central stars from the geometric centres of the outflows, and the eventual disruption and dispersion of the envelopes, leading to shell fragmentation (e.g. Tweedy & Napiwotzki 1994; Tweedy & Kwitter 1994, 1996; Tweedy, Martos & Noriega-Crespo 1995).
Several of these characteristics will be noted in the sources to be investigated here, all of which are all highly evolved, and have large physical dimensions.
Finally, we note that the intrinsic structures of the shells are also likely to evolve, although here, again, the precise nature of the variation is open to uncertainty. Marigo et al. (2001) note that whilst the interior bubbles of hot, shocked wind are believed to lead to shell compression (and reduced ratios ΔR/R), this is counterbalanced by thermal expansion of the primary ionized envelope. The ratio ΔR/R may therefore decrease down to ∼0.2, and later increase to ΔR/R∼ 0.6 (as shell thermal pressures come to dominate) – although the precise values for this ratio depend upon model characteristics. Similar trends have also been noted by Marten & Schonberner (1991), who emphasize the role of adiabatic cooling in the hot interior bubble.
One would therefore expect the shells of evolved PNe to appear reasonably thick – thicker, certainly, than is the case at intermediate phases of evolution. We shall investigate, in the following, whether this is in fact the case.
We have acquired optical spectroscopy for a broad range of highly evolved sources. In one of these, the outflow A78, the central star appears to have undergone a late helium flash (see e.g. Borkowski et al. 1993). We shall note that the spectrum has changed over a period of ∼25 yr, and now shows evidence for strong P Cygni profiles in the λ4589 and λ5412 transitions of Heii. We determine wind terminal velocities of the order of ≅ 3.83 × 10³ km s−1, similar to estimates based upon ultraviolet spectroscopy. The outflow A62 shows a strong [Nii] spatial asymmetry, which has previously been attributed to interaction with the ISM (Tweedy & Kwitter 1994). We note, however, that the Hα and [Oiii] emission regimes show a much higher level of symmetry.
We have determined the radial variation in emission for the symmetric outflow A8, and find evidence for appreciable filling of the nebular shell. A similar (if somewhat more approximate) analysis is also possible for certain other sources, and we find evidence for both thick (A62, A83) and thin (A13) outflow structures. These results are, by and large, consistent with evolutionary theory.
2 Observations
The present observations were taken in 2000 September, using the f/7.5 2.1-m Ritchey–Chretien Telescope of the Observatorio Astronomico Nacional (OAN), Mexico, located at San Pedro Martir (Baja California). Long-slit spectra of the sources A8, A13, A62, A72, A78 and A83 were obtained using a Boller and Chivens spectrograph, in tandem with a Thomson 2048 × 2048 pixel TH7398M charge-coupled device (CCD). The CCD pixels had a size of 15 × 15μm2, whilst the 600 line mm−1 grating was set at a blaze wavelength of 4550 Å. This resulted in a usable wavelength range of Δλ≅ 2500Å (i.e. between 4330 and 6830 Å), a plate scale of 1.54 Åpixel−1, and a spectral resolution of Δλ≅ 3.9Å. The slit width and length were 2.0 arcsec and 160 arcsec, respectively, and seeing was of the order of 1.0 arcsec. Similarly, the position angle of the slit was 270°, and exposure times were 30 min.
Wavelengths were calibrated using a He/Ar lamp, and fluxes were calibrated using the standard star HD 217086. Fluxes for this star are available in Massey et al. (1988). Finally, the results were analysed using the Figaro data reduction package (Shortridge 1993), and corrected for atmospheric extinction using a curve published at the OAN website.1
All of the OAN telescopes suffered from severe light leakage over this period. As a result, the present exposures were mildly contaminated by moonlight, arising from scattered light and/or internal reflections. This resulted in background emission gradients, which were removed using in-house algorithms. Levels of noise remain enhanced towards the red end of the spectra, however, and this sometimes makes it difficult to asses the [Sii]λλ6716+6731 doublet ratio.
In the case of A78, the local standard of rest (LSR) correction (i.e. the velocity of the observatory towards the local standard of rest, taking account of the relative solar and terrestrial motions) is calculated as 6.34 km s−1; it may be noted that the difference between heliocentric and LSR velocities is of the order of VHEL−VLSR=+14.14 km s−1. The wavelengths in Table 2 are corrected for this factor, and refer to the LSR. By contrast, the systemic velocity of the nebula with respect to the LSR appears to be of the order of ∼31 km s−1 (Pottasch 1984). We have also used Gaussian line and continuum fitting algorithms to determine the linestrengths in Table 1. The contribution of the sky was assessed by summing areas of spectrum outside of the primary emission regimes, and subtracting these from our results.
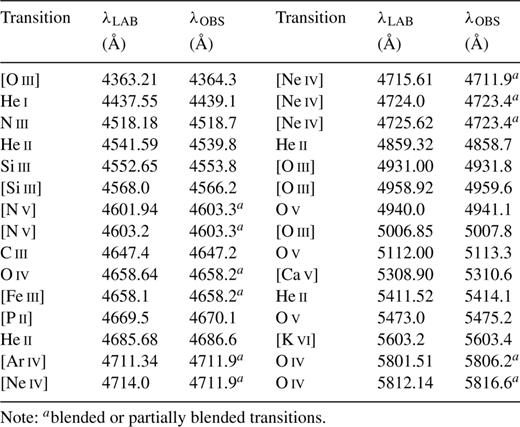
Ionic transitions identified in the central star of A.
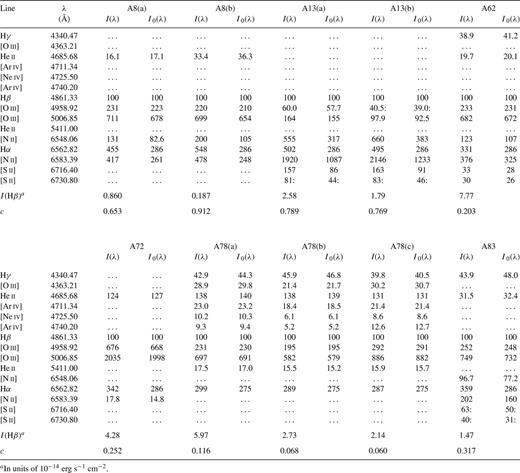
Relative line intensities in Abell nebulae.
Finally, we have assessed the variation of line intensities as a function of position relative to the central star (rp). Our results are presented in Figs 3–8. In these cases, emission has been integrated across the widths Δλ of the brighter nebular lines, and we have subtracted the effects of central star and nebular continua by measuring adjacent regions of spectrum. We have also binned several of the results to lower resolution in order to increase the signal-to-noise ratio. Such procedures are only partially effective, however, and the subtraction of bright stellar continua sometimes results in a distortion of the results. Regimes where field and central star contamination is significant are marked by gaps in the profiles. These are (on occasion) quite broad, since nebular intensities are often comparable to those of the extended seeing wing profiles.
![The variation of emission strengths and line ratios in A8, represented as a function of position rp along an east–west axis through the central star (located at rp= 0). The curves have been normalized to similar peak values, whilst gaps in the profiles correspond to regimes of field star contamination. The ratio [Nii]/Hα appears to be relatively invariant, although there is evidence for an increase in this parameter towards the westerly limits of the outflow.](https://oup.silverchair-cdn.com/oup/backfile/Content_public/Journal/mnras/357/2/10.1111/j.1365-2966.2005.08664.x/2/m_357-2-548-fig003.gif?Expires=1750452654&Signature=jysZfaVqzrU91Rvg1Lu4rWFgzKB5G~j0kRlaD5eHQTTj~6JQ1bm6IkjBivnlYB4j1CDMWdoXLVvBJUIDtJIzaqzKWDPQFu7AGJVs73LSil8mLcDm3idNNrC90sssK8Mo9rTWsXRQ941VolT6~Wo5gh1hUKH8BFu5h~TPtr6QKgl7QVsw21Yq6CjY~MsrZ12gctElTPw1E4j4tCbEHupkH9ZIsC7PwDOCaAqtY8OmERcIGIaFqkcjviU8Wi6fjgQ9EQFp9wNy2eBFNy~T1hw258RPP4bB2wiwE6AEtlWjYs2ZoNOQc~zc70UGGOhvQAjntYWQw5FQSwqdFJ77OuUQ8Q__&Key-Pair-Id=APKAIE5G5CRDK6RD3PGA)
The variation of emission strengths and line ratios in A8, represented as a function of position rp along an east–west axis through the central star (located at rp= 0). The curves have been normalized to similar peak values, whilst gaps in the profiles correspond to regimes of field star contamination. The ratio [Nii]/Hα appears to be relatively invariant, although there is evidence for an increase in this parameter towards the westerly limits of the outflow.

![As in Fig. 3, but for the case of A62. Emission appears to increase towards the centre of the outflow, although [Nii] also peaks towards the westerly limits of the envelope. This latter feature appears to form part of an extended arc of emission (Tweedy & Kwitter 1994), and may arise through the interaction of the PNe with the ISM.](https://oup.silverchair-cdn.com/oup/backfile/Content_public/Journal/mnras/357/2/10.1111/j.1365-2966.2005.08664.x/2/m_357-2-548-fig005.gif?Expires=1750452654&Signature=2hsTFHG3MNq8AfgMR5stq1UktCenySTP7JXO7t05YKI494-1ojM0OmesWj8HTI6wu6wZW3lb4~OQlqmfqnRprAYLFzds-qxGY~6Ahv8ftsGgWRsTkOYDzATLyydYlaf6UfIxb~lOYSq2228r-X038nXPURzibw4G2EszKj3tTBnzk3A1vM8B6Wav-V9owMDSaAE3diMH48-Kb0iPF8t72ZWkLi0aK32CAz8ssngO~sixTR8bromh2dUa1uv5W28It6KStA1HqMI3i6Lvz87I8lwXlfoNEQI4j~nSjQBPFSkktlvtNdyKRY0CnI8RZMcldQgCQCrQ4G9AX6Mpysmhwg__&Key-Pair-Id=APKAIE5G5CRDK6RD3PGA)
As in Fig. 3, but for the case of A62. Emission appears to increase towards the centre of the outflow, although [Nii] also peaks towards the westerly limits of the envelope. This latter feature appears to form part of an extended arc of emission (Tweedy & Kwitter 1994), and may arise through the interaction of the PNe with the ISM.
As in Fig. 3, but for the outflow A72. The structure of this shell appears complex, and reveals evidence for at least four primary emission peaks.
![As in Fig. 3, but for the case of A78. This nebula appears to possess two principal shells, ejected at differing epochs of the central star evolution. The outer Hα and Heii shells have similar emission trends, and the ratio Heii/Hα appears closely invariant, although there is evidence for a sharp increase in the ratio at small axial displacements. The [Oiii] transition, on the other hand, arises mainly from the hydrogen-depleted inner shell, and ratio [Oiii]/Hα is again enhanced towards the nebular core.](https://oup.silverchair-cdn.com/oup/backfile/Content_public/Journal/mnras/357/2/10.1111/j.1365-2966.2005.08664.x/2/m_357-2-548-fig007.gif?Expires=1750452654&Signature=1~OLlFc4YZtKMLyKNCKyVBJjtye~HevsKloEfJ7VmnAWrZEwB1D9nK37gq8~bYwBRdFAug5yM12GvjrAG25oJ4z87McQqhgODfqSPYScrtMzJ9IFtf62q5eQO956XZSNzRnFtyHLOF0fmOFoYtJUNF1I43L2mJKt2XAn9Pp4EQISCC2yLGPp3r3FhjRLJIIRe-R2MgifKML-6oRhmhXpz48zYeDqSnCEa8O7nTgOBfufegxjtU6FHhPw7wNpLa4IsVVEKVlPu7dAie7aCsSkR1H0GGRoKhhNMgMAU9hjas0f9FcRLRsViONA85dSM1vADk52vL4O1MHvKBLO2i6zSQ__&Key-Pair-Id=APKAIE5G5CRDK6RD3PGA)
As in Fig. 3, but for the case of A78. This nebula appears to possess two principal shells, ejected at differing epochs of the central star evolution. The outer Hα and Heii shells have similar emission trends, and the ratio Heii/Hα appears closely invariant, although there is evidence for a sharp increase in the ratio at small axial displacements. The [Oiii] transition, on the other hand, arises mainly from the hydrogen-depleted inner shell, and ratio [Oiii]/Hα is again enhanced towards the nebular core.
As in Fig. 3, but for the outflow A83. The profiles are somewhat similar to those of A62, and reveal evidence for appreciable levels of emission throughout the nebular volume.
3 Discussion
3.1 Measures of nebular line intensities
Line intensities for our six Abell nebulae are summarized in Table 1. We give the observed strengths I(λ) normalized to the intensity of Hβ[I(Hβ) = 100], and values I0(λ) corrected for extinction. Certain of these intensities correspond to specific sectors of the nebular shells.
Those corresponding to A8(a) and A13(a), for instance, apply for the nebular shells as a whole, whilst the values labelled A8(b) and A13(b) correspond to the sharp rims of the outflows, located at between 14.6 and 22 arcsec from the central star (in the case of A8), and over the ranges −25 > rp > −55 arcsec and 26 < rp < 52 arcsec (in the case of A13; see the profiles in Figs 3 and 4).
Finally, A78 is separated into three sectors, and intensities correspond to the complete nebular shell [A78(a)], and peaks located between −14 and −36 arcsec [A78(b)], and between 20 and 40 arcsec from the central star [A78(c)]. All of these latter profiles exclude the contribution of the central star, which is separately considered in Section 3.2.
We have, for most of these cases, evaluated extinction using a ratio I(Hα)/I(Hβ) = 2.86, corresponding to the value expected for low-density (ne= 102 cm−3) case B outflows having Te= 104 K (Hummer & Storey 1987). We have also employed the visual extinction parameters of Cardelli, Clayton & Mathis (1989). The one exception to this is A78, which appears to have an electron temperature Te≅ 18000 K (Manchado, Pottasch & Mampaso 1988). This high value of Te implies ratios I(Hα)/I(Hβ) ≅ 2.75 (Hummer & Storey 1987), and may arise because of photoelectric heating by interior dust grains (Borkowski et al. 1993). A more ‘normal’ temperature of ∼104 K would imply extinctions c of between 0.005 [for A78(c)] and 0.06 [for A78(a)].
Our estimates of c are summarized at the foot of Table 1. Extinctions for these sources have been evaluated by Kaler (1983), Kaler & Feibelman (1984), Pottasch (1984), Manchado et al. (1988), Kaler, Shaw & Kwitter (1990) and Tylenda et al. (1992). Their values of c are sometimes uncertain, and frequently in conflict, although they appear (in most cases) to be in accord with the estimates in Table 1.
One case deserves special mention. The extinction in A78 has been determined using the gradient in the central star continuum, from the strength of the λ2200 bump, from an analysis of UBV photometry, and from the Balmer line decrement (Cohen et al. 1977; Kaler 1983; Kaler & Feibelman 1984; Manchado et al. 1988). All of these are in agreement in suggesting values c≅ 0.13–0.22. Kaler & Feibelman (1984) have argued that this is unexpected. The strength of the near-infrared (NIR) dust continuum might lead one to expect much higher estimates of c, particularly in the centre, where much of the emission appears to be concentrated (Cohen et al. 1977; Kimeswenger, Kerber & Weinberger 1998). It has therefore been argued that the low central star extinction may arise because of geometrical considerations – that much of the dust may be concentrated within a disc or torus.
Our present values of c are somewhat smaller, but confirm the presence of low levels of extinction in all parts of the nebular shell.
Finally, we note that the [Sii]λ6731 transition occurs in a part of the spectrum that is affected by enhanced levels of noise (see Section 2). Nevertheless, it seems clear that the ratio [Sii]λ6716/[Sii]λ6731 is appreciable for both A13 and A83, and implies low densities in both of these shells. Similar results have been noted for A8 (Ali 1999). The ratio for A62 is smaller, and would imply significantly higher densities. Using the Lick five-level atomic program of Shaw & Dufour (1995) in an interactive version due to R. J. Dufour, and adopting an extinction c= 0.20 (from Table 1) and Te= 1.02 × 10⁴ K (Cahn, Kaler & Stanghellini 1992), we determine ne≅ 4.08 × 102 cm−3.
3.2 The central star of A78
Our spectrum of the central star in A78 is illustrated in Fig. 1, whilst a list of line identifications and wavelengths is summarized in Table 2. The results correspond to a range Δrp± 5.8 arcsec along the east–west axis.

Spectrum of the central star of A78, together with various line identifications. Note the presence of strong P Cygni profiles associated with the λ5412 and λ4859 transitions of Heii.
A comparison between the present spectrum and that of Cohen et al. (1977) shows that some significant variations have occurred over a period of ∼25 yr. In particular, the λ4589 and λ5412 transitions of Heii, which in Cohen et al. (1977) appear as little more than broad dips, are now revealed to be fully fledged P Cygni profiles, comparable to those observed for Civ, Nv and Ov in the wavelength range λ= 1200 –1550Å (e.g. Kaler & Feibelman 1984; Kaler, Feibelman & Henrichs 1988; Harrington, Borkowski & Tsvetanov 1995).
A comparison between the earlier and more recent profiles is provided in Fig. 2. Several points may be noted from this. First, the change in the λ4859 profile appears to be real, and cannot be attributed to differences in spectral resolution [Δλ= 7Å in the case of Cohen et al. (1977)]. Unless the results of Cohen et al. are in error, this suggests that there have been short-term changes in the stellar spectral characteristics. The emission between 4868 and 4880 Åpresumably represents the redshifted component of the profile, rather than corresponding to any contribution from Hβ (which is expected to be weak).
A comparison between two spectra for the central star of A78. The upper curve corresponds to our present results, whilst the lower spectrum is adapted from Cohen et al. (1977), and was taken ∼25 yr previously. Both curves have been normalized to unity at a wavelength λ= 4750Å, and displaced vertically so as to avoid confusion. Note the presence of a strong P Cygni profile in our present results, a feature that appears to have been absent in the earlier spectrum.
The terminal velocity of the outflow is assessed by eye-fitting the P Cygni profile to the underlying continuum. We determine a value V∞≅ 3.83 × 10³ km s−1, which compares favourably with several earlier estimates. Kaler & Feibelman (1984), for instance, quote values of between 4200 and 4300 km s−1, based upon measures of the λ1550 transition of Civ, and the λ1371 transition of Ov. Similarly, Kaler et al. (1988) determine V∞= 3560 km s−1, and Harrington et al. (1995) find a value ∼3600 km s−1. Given the overall uncertainties in our measurements (of order ±250 km s−1), the agreement with previous results appears to be acceptable.
Apart from the primary P Cygni outflow, various authors – including Harrington et al. (1995) and Kaler et al. (1988)– have also noted the presence of secondary absorption systems. These have been attributed to mass loading clumps within the line of sight, or as a result of shocking between the wind and interior envelope. We note one possible absorption close to λ4804, which also appears to be replicated in the spectrum of Cohen et al. (1977). This would correspond to an outflow velocity of order ∼3.4 × 10³ km s−1– if, indeed, it is associated with the wind at all. There is no convincing evidence (at present resolutions and noise levels) for the low-velocity systems analysed by Harrington et al. (1995) and Kaler et al. (1988).
Finally, the [Civ] doublet at λλ5802+5812 is well resolved in the present spectrum, and appears to have wings extending over a range Δv∼ 4 × 10³ km s−1. Note, however, that the level of noise in this regime is quite appreciable – larger, certainly, than is the case at shorter wavelengths – and it is conceivable that our value for Δv may represent a lower limit.
3.3 Spatial profiles of the Abell shells
The spatial profiles of our Abell sources are illustrated in Figs 3–8. These reveal a broad variety of characteristics, from the complex and asymmetric (A72), through to the centrally concentrated (A62), and include symmetric shells (A8) and shells that are strongly annular (A13).
A13 has been imaged by Rosado & Moreno (1991), who suggest that the primary shell is associated with exterior diffuse emission. There is little if any evidence for this in our present profiles (Fig. 4). They also note that the [Nii]/Hα ratio is enhanced within an elliptical rim, the width of which appears to be variable. Our present profiles suggest a ratio ∼2 at the centre, and of the order of ∼5–6 at r=±40 arcsec.
Intensities in A62 appear to increase towards the geometrical centre of the outflow, suggesting the presence of a thick shell structure with appreciable interior components of emission (Fig. 5, see also Section 4). There is also a strong difference in profiles between the [Nii], Hα and [Oiii] transitions. The [Nii] profile, in particular, is sharply peaked close to rp∼ 40 arcsec, and it seems possible that this may be an indication of shock interaction with the ISM (Tweedy & Kwitter 1994).
A78 has been intensively investigated over the past 30 yr or so (see e.g. Cohen & Barlow 1974; Cohen et al. 1977; Jacoby 1979; Jacoby & Ford 1983; Kaler et al. 1988; Manchado et al. 1988; Borkowski et al. 1993; Meaburn et al. 1998), and consists of two primary outflows. One (corresponding to the outer shell) appears to have been ejected during the initial evolution of the central star, and the second (interior hydrogen-depleted envelope) may be the product of a late helium flash. The inner shell has a complex spatial and kinematic structure, and shows evidence for several high-velocity features (Meaburn et al. 1998). These components, originally identified as high-velocity bullets, may be associated with the deceleration of mass-loaded flows around inert knots (Meaburn & Redman 2003). Borkowski et al. (1993) have also noted the presence of cometary structures close to the central star, perhaps indicative of shock interaction with the stellar wind.
Certain of these characteristics are evident in the profiles illustrated in Fig. 7. The Hα profile is broad, and has peaks separated by Δr∼ 60 arcsec. This corresponds to the exterior shell mentioned above. The Heii profile is very closely similar (the ratio Heii/Hα is essentially flat for distances >6 arcsec from the central star), testifying to relatively little ionization stratification within this regime. However, Heii/Hα increases markedly at lower distances from the central star, corresponding to the region occupied by the hydrogen-depleted interior shell. The [Oiii]/Hα profile is also strongly enhanced in this regime, as would be expected given the known characteristics of the source (see e.g. Jacoby 1979).
3.4 Source emission structures
Although none of the sources studied here is ideally symmetric, and few of the spatial profiles are complete, our observations may nevertheless be used to assess source emission structures.
The method that we have employed in outlined in the Appendix. It is assumed that the radial variation in emission per unit volume, E(r), can be approximated as a polynomial function, and this is integrated along the line of sight though the nebular shell. The results of this integration are compared to observed line profiles, and this permits us to constrain individual coefficients within the polynomial expression.
It is preferable, in undertaking such an analysis, that the nebulae have a reasonably large angular size. This reduces distortions arising from point spread deconvolution. It is also desirable that the outflows have circular symmetry, which will (in our present case) be taken to be an indication of spherical outflow symmetry.
This latter condition is only partially met in the case of the nebulae observed here. Nevertheless, we believe that levels of symmetry are sufficient to permit us to obtain realistic estimates of E(r).
In the case of A8, for instance, it is apparent that the profiles are reasonably symmetric (more so, indeed, than in any other of our sources), although information is missing over a range −4 < rp < −18 arcsec. We shall assume that the right-hand side of the profile (between rp= 0 and 40 arcsec) is typical of that of the entire nebular shell. A13, A83 and A62 have somewhat lopsided profiles, although the levels of asymmetry are modest. We have, for these cases, determined average profiles based upon the easterly and westerly trends combined (i.e. the profiles at negative and positive axial displacements).
The results of our analyses are indicated in Figs 9–12. The most reliable of the results, those for the outflow A8, show evidence for peaks in E(r) at distances Γ∼ 0.1 and Γ∼ 0.6 from the central star (where Γ=r/R corresponds to the fractional radius). There is, in short, evidence for appreciable shell filling, as would be expected from various models of nebular expansion (see Section 1). It is also clear that the regime occupied by the shocked stellar wind must be very small indeed, and have a radius no greater than rs∼ 0.1R. Very similar comments apply to A83, although there is evidence for particularly strong [Nii] emission towards the outer limits of the shell – a result, presumably, of ionization stratification. A62 appears to be very strongly filled, with the emission peaking at a distance ∼0.36R, whilst most of the emission in A13 derives from the outer limits of the shell, and peaks close to r/R∼ 0.8. It is apparent, for most of these cases, that emission trends are similar in all of the ionic transitions.
The radial variation of emission per unit volume, E(r/R), for various transitions in the outflow A8. The curves have been normalized, and are displaced vertically to avoid confusion. Note that emission appears to peak at distances Γ=r/R≅ 0.1 and r/R≅ 0.6 from the centre.
As in Fig. 9, but for the case of A13. Most of the emission appears to arise at the periphery of the outflow.
As in Fig. 9, but for the case of A62. It would appear that emission is present throughout the nebular shell, and that the shell thickness ΔR/R is appreciable.
![As in Fig. 9, but for the outflow A83. It appears that emission occurs throughout the nebular shell, as is the case for A62, although there is also evidence for a strong increase in [Nii] towards the periphery of the envelope.](https://oup.silverchair-cdn.com/oup/backfile/Content_public/Journal/mnras/357/2/10.1111/j.1365-2966.2005.08664.x/2/m_357-2-548-fig012.gif?Expires=1750452654&Signature=xe3ElM1UFuv7PvrnY95~w6Q1UDvvgi8nN-s4N1niNcW2j7mgi9covWxL-TKjje2eCIO8~-SRvEY-kKvinhU6GvT6ivqBiXPk~Cc4eh9cqT155JQaigHZ7kyqz7j-hwwWShXJ845RlIouaPbf-I~oGqczlokoQQM9cq-rQN9lLk5Tm8k4uhntq8ErwZkrl-SgqHmfNklp7-aFNKHICPpfbkvMe3KUrbHqF5X7p~L39zxr3mFAlCFgNTI-Gn~BBXwtwdatVOAcTRCGb3aXPM8GTX9s1EvnvlzDMwqbmVYRvRIOi1A74WTzxxmbTcplLzLMnv2yY5HeJTxCp68CO8p7Hg__&Key-Pair-Id=APKAIE5G5CRDK6RD3PGA)
As in Fig. 9, but for the outflow A83. It appears that emission occurs throughout the nebular shell, as is the case for A62, although there is also evidence for a strong increase in [Nii] towards the periphery of the envelope.
Such analyses may therefore prove of considerable interest, and permit us to evaluate the volume emission characteristics of spherical (or nearly spherical) outflows. Whilst the present results should only be taken as indicative, they are unlikely to be greatly in error.
4 Conclusions
We have acquired spectroscopy of six highly evolved Abell nebulae over the wavelength range 4330 Å < λ < 6830 Å. This has permitted us to determine line ratios, extinctions and spatial variations in emission for several of the brighter ionic transitions. We note that the differing outflows possess a broad range of characteristics, and display evidence for shock interaction with the ISM, and multiple shell ejection.
Among the specific conclusions arising from this analysis, we note that the central star of A78 appears to have undergone significant spectral changes over a period of ∼25 yr. Our present spectrum shows evidence for P Cygni profiles in the λ4589 and λ5412 transitions of Heii, and these imply terminal outflow velocities of the order of V∞≅ 3.83 × 10³ km s−1. This is comparable to the velocities determined from ultraviolet spectroscopy.
We have also used the spatial emission profiles of these outflows to determine the radial variation in nebular emission. This reveals that emission is, in most cases, present throughout the nebular volumes, in close accord with what would be expected from evolutionary theory.
Acknowledgments
Two of us (SNK and JPP) would like to thank staff at the OAN for their usual excellent level of support. JPP would also like to express his appreciation to Antonio Mampaso and the Instituto de Astrofísica de Canarias (Tenerife, Spain) for their cordial welcome, and for providing accommodation, office space and computational equipment.
References
Appendices
Appendix A:
It is, under most circumstances, difficult to determine the intrinsic emission structures of PNe from their projected (two-dimensional) appearances. Where the emission is asymmetric or non-spherical, for instance, then a variety of structures may be capable of representing the observed results. Similarly it is usually obligatory, in angularly small outflows, to deconvolve the observed trends for the effects of seeing. This may lead to its own problems (arising from errors in the point spread function, temporal changes in seeing, variations in guiding, etc.), and result in a distortion of the apparent shell structures.
A number of highly evolved PNe appear to possess circular morphologies, however, and it is likely that this implies spherical outflow symmetry. In addition, the angular sizes of such shells are often appreciable, which obviates the need for point source deconvolution of the results. We shall describe a procedure that is particularly applicable to this category of outflow, and permits us to determine the variation of emission E(r) as a function of nebular radius r.
We shall approximate the emission per unit volume at distance r from the central star by an N-term polynomial expression of form


In most circumstances, including those described here, it is difficult to evaluate E(r) reliably in terms of normal physical units. Either the intensities I(a) are inexactly calibrated (or not calibrated at all), and/or the distances of the sources are poorly known. Indeed, it is arguable that accurate distances are available for only a handful of PNe (see e.g. Phillips 2002). It is possible, under these circumstances, to use arbitrarily calibrated values of I(a) [say, values I(a) determined from normalized emission profiles, such as those presented here], and determine these for differing axial displacements a/R. This will lead to coefficients ξi that have the correct relative values, and can be used to assess the normalized emission function E(r/R). Such a procedure has been undertaken in the present analysis, and yields the figures described in Section 3.3.
