


Abstract
We analyse the UV spectral energy distribution of a sample of normal galaxies listed in the International Ultraviolet Explorer (IUE) Newly Extracted Spectra (INES) Guide No. 2 – Normal Galaxies using a principal component analysis. The sample consists of the IUE short-wavelength (SW) spectra of the central regions of 118 galaxies, where the IUE aperture included more than 1 per cent of the galaxy size. The principal components are associated with the main components observed in the ultraviolet (UV) spectra of galaxies. The first component, accounting for the largest source of diversity, may be associated with the UV continuum emission. The second component represents the UV contribution of an underlying evolved stellar population. The third component is sensitive to the amount of activity in the central regions of galaxies and measures the strength of star-formation events.
In all the samples analysed here, the principal component representative of star-forming activity accounts for a significant percentage of the variance. The fractional contribution to the spectral energy distribution (SED) by the evolved stars and by the young population are similar.
Projecting the SEDs on to their eigenspectra, we find that none of the coefficients of the principal components can outline an internal correlation or can correlate with the optical morphological types. In a subsample of 43 galaxies, consisting of almost only compact and BCD galaxies, the third principal component defines a sequence related to the degree of starburst activity of the galaxy.
1 Introduction
The history of ultraviolet (UV) astronomy shows that (i) only a few missions operated and yielded significant data, and (ii) most of these missions dealt with imaging or photometry, with very limited spectral science. Among the latter, the International Ultraviolet Explorer (IUE) project stands out with more than 18 years of successful operation and with a yield of more than 105 spectra collected and uniformly analysed. These spectra have been available on-line in the IUE final archives and through the various astronomy data portals. The compilations from the IUE data base offer a somewhat biased view of the UV spectral characteristics of astronomical objects. In particular, the IUE Newly Extracted Spectra (INES) Guide No. 2 – Normal Galaxies (Formiggini & Brosch 2000) offers a view of the UV spectral characteristics of the non-active galaxies.
The advent of the GALEX all-sky UV survey, with a strong component of spectral science (Bianchi et al. 1999), argues for the development of new tools to understand the spectral energy distribution of galaxies in the UV. While traditionally UV spectra have rarely been used for classification, partly because of the lack of a large number of spectra of different objects, it is possible that the ∼105 galaxy spectra expected from GALEX would provide the necessary data base to develop an independent and uniform classification network using only UV information.
The question we posed ourselves was whether it is possible to predict the UV spectrum of a galaxy by using exclusively information from the optical domain. The question is relevant in the context of UV surveys, when one needs to estimate the spectral detections, and also when one deals with huge data bases derived from a survey of a large fraction of the sky.
In the optical domain, the Hubble diagram provides a satisfactory classification for local galaxies, with redshift ≤2, based on their appearance. This morphological classification, however, is a qualitative and somewhat subjective analysis of the observable features of a galaxy. Classification of several hundreds of galaxies, performed by different experts (Lahav et al. 1995), results in a dispersion of more than one morphological type. For irregular and peculiar galaxies the situation is worse, because the Hubble classification does not define if an irregularity or peculiarity is related to shape, such as asymmetry, or to surface brightness, such as the lack of a central concentration.
Morphological classification depends also on the photometric filter. The appearance of galaxies in the UV is different from that in the optical, and details emphasized in the UV often do not agree with the Hubble classification. For instance, UV images of spiral galaxies show detailed features in the spiral arms and in the bulge, such as knots of circumnuclear star-formation regions, that cannot be clearly detected in the optical band. Low-redshift UV galaxies are important both for understanding the local Universe and for the extrapolation to high-redshift samples.
However, the higher percentage of irregular and merger types found in high-redshift samples (Brinchmann et al. 1998) indicates that the Hubble sequence is not sufficient to describe the complex UV morphology. Kuchinski et al. (2000) analysed a sample of34 nearby galaxies imaged with UIT, and found that the far-UV morphology does not agree with the bins of the Hubble sequence. The introduction of two additional parameters, to quantify the asymmetry and the central concentration of galaxies, is suggested by Kuchinski et al. (2001).
Classification can also be performed using the spectral energy distribution (SED). Galaxies of the same morphological type tend to have similar stellar populations and this results in similar spectral features in the optical domain. Hence, a spectral classification based on the SED is related to the physical properties of a galaxy, such as its stellar and gas content. An objective method for spectral classification is principal component analysis (PCA), extensively applied to samples of templates and to galaxy models. This technique was able to retrieve regularities present in the optical spectra and to define a spectral sequence for normal galaxies (Connoly et al. 1995; Sodré & Cuevas 1997; Galaz & de Lapparent 1998; Ronen, Aragon-Salamanca & Lahav 1999).
In this paper we analyse a set of UV spectra of galaxies from the IUE final archive. This archive represents the most extended UV database on galaxies until new systematic UV surveys from space, such as that by GALEX, will be available. We use the INES Guide No.2 – Normal Galaxies (Formiggini & Brosch 2000).1
A large amount of effort has been expended in studying the IUE spectra of galaxies by Bonatto, Bica & Alloin (1995) and Bonatto et al. (1996, 1998, 1999), by grouping the galaxies presenting spectral and optical morphological similarities and co-adding the spectra in order to produce high signal-to-noise template spectra for subsets in each group.
In this work we analyse a set of direct spectra of galaxies, without attempting to build a priori templates. The only selection criterion adopted is the coverage parameter, defined in Section 2. This parameter evaluates the area of the galaxy included in the IUE spectrograph aperture. The PCA method is described in Section 3. In Section 4 we discuss the PCA results, and the effect of normalization on the sample and on a subset with good signal-to-noise ratio. A data set with spectra covering a higher fraction of the galaxy is also analysed, and the Hubble optical morphological sequence is compared to the UV spectral sequence in Section 5.
2 THE IUE SAMPLE
A suitable set of UV SEDs of galaxies covering a wide range of Hubble types can be extracted from the IUE final archive. The data sets provided by INES (IUE Newly Extracted Spectra) consist of low-resolution spectra extracted with an improved method from the line-by-line images of the IUE Final Archive, and of high-resolution spectra resampled to the low-resolution wavelength step. A collection of UV spectra of 274 normal galaxies has been compiled as the INES Guide No. 2 (Formiggini & Brosch 2000). In this guide, a representative UV spectrum for each galaxy has been selected, combining the longest short-wavelength (SW) and long-wavelength (LW) exposures of the galaxy, both taken trough the large aperture. The aperture position of the IUE apertures for the SW and LW spectra, which were obtained independently and required repositioning of the satellite, were checked with aperture overlays on the galaxy images. This procedure ensured that the entrance apertures of both SW and LW spectra were centred on the galaxy optical position or, alternatively, refer to same physical region of the galaxy, such as the H ii regions of NGC 4449 and NGC 5236.
We found some cases where the IUE aperture coordinates did not correspond to the coordinates of the galaxy, and the IUE did not, in fact, observe the object. Such is, for instance, the IUE spectrum of NGC 3077, where the misplaced aperture contains a foreground star instead of the galaxy.
A C value of zero implies that the entire galaxy was measured by the IUE spectrum. For faint galaxies, where the axes are not measurable, the C parameter is ≤0. The histogram of the number of galaxies as a function of the C parameter (see fig. 5 of Formiggini & Brosch 2000) shows that, for 90 per cent of the sample of 274 normal galaxies in the INES Guide No. 2, the IUE aperture covered less than 10 per cent of the galaxy.
For the present investigation, only the galaxies with a C value up to 2, corresponding to a coverage of more than 1 per cent of the galaxy, were assembled from the sample of Formiggini & Brosch (2000). This means that the spectra are dominated by the content of the very centre of the light distribution of the galaxy. A few cases where the aperture position was miscentred were rejected. The total number of galaxies included in the sample analysed here is 118. Table 1 lists the relevant data for the set. Column 2 indicates to which subsample the specific galaxy belongs, where 1 represents membership in the subsample of relatively high signal-to-noise ratio (S/N) and 2 represents membership in the subsample of high coverage parameter (see Section 4). This sample, resulting from many different research projects, contains galaxies of all morphological types, although it is obviously biased toward the brightest UV galaxies. It is a representative sample of UV galaxy spectra although it is not uniform, and the percentage of galaxies in each morphological class is not representative of the galaxy population at large. Consequently, this sample is not suitable for luminosity function and density investigation. A subsample of galaxies with C values up to 1, corresponding to a coverage of more than 10 per cent of the galaxy area, was selected for comparison. This reduced sample of 43 galaxies, consisting mostly of blue compact dwarf (BCD) and compact objects, is analysed in Section 4.2.
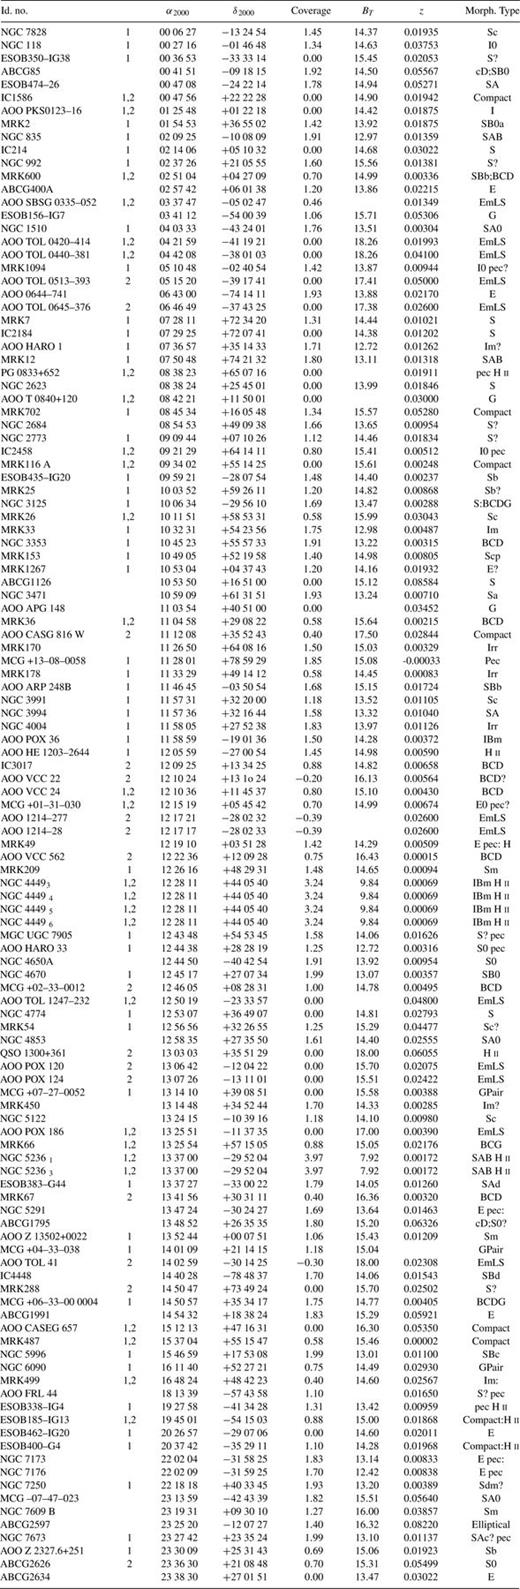
List of galaxies.
Fig. 1 shows the morphological distribution of the data set. The galaxies have been binned into four morphological bins: ellipticals, spirals, irregulars and a group containing all the compact objects, namely galaxies classified as BCD, EmLS, H ii and compact. Note that the morphological types and redshifts adopted here are from NED, while in the INES Guide No. 2 all information is from the Lyon–Meudon Extragalactic Database (LEDA). The sample includes all classical Hubble types, from elliptical to irregulars, and a large proportion of compact/BCD/EmLS galaxies whose emission in the UV band is dominated by young, UV-bright stars.
The distribution of spectral types.
The redshift distribution of the sample is shown in Fig. 2. IUE observed galaxies only in the very nearby Universe, hence the sample analysed in this paper can be considered as representing the local UV galaxy population. This sample can be used to analyse the rest-frame UV SED of galaxies directly without requiring extrapolation from the optical data.
Histogram of the redshift distribution.
It is known that the galaxy spectra have a low signal-to-noise ratio in the IUE LW region. Actually, a visual inspection of the spectra in the LW range shows that the noise is the dominant feature. Furthermore, only part of the galaxy sample has been observed in the LW range. Hence, we have restricted the analysis to the far-UV region covered by the SW IUE images (between 1150 and 1900 Å). This is the wavelength range where the most significant features probing the galaxy evolution occur.
3 The PCA Method
The technique used to analyse the UV spectra of our sample is principal component analysis (Whitney 1983). The PCA algorithm is an orthogonal transformation that, given a set of measured quantities, finds a set of new independent variables, called the principal components (PC), each one being a linear combination of the original quantities. PCA has been demonstrated to be a useful tool for spectral classification of both stars (Ibata & Irwin 1997; Singh, Gulati & Gupta 1998) and galaxies (Connoly et al. 1995; Ronen et al. 1999). It has been applied to quantities measured from the spectra, such as broad-band colours or equivalent widths of lines (Turler & Courvoisier 1998; Steindling, Brosch & Rakos 2001), and also directly to the spectral energy distribution (SED) of galaxies (Sodré & Cuevas 1997; Galaz & de Lapparent 1998).
In spectral PCA, each spectrum is a vector in a multidimensional space, and the fluxes in the individual wavelength bins represent the axes of this space. PCA identifies the directions of the maximum variance of the spectral components. These directions, called principal components, are identified sequentially and represent the new axes that parametrize the volume spanned by the data set. The principal components are ordered according to the fractional sample variance for which they account, the first component accounting for the largest fraction. If there are common characteristics between the galaxy spectra of the sample, a few principal components may account for a large fraction of the total sample variance. Therefore, the PCA, by reducing the multidimensionality of the data, may provide a simple description of the original data set and, through this, a better insight into its underlying characteristics.
Each galaxy in our sample of IUE spectra is represented by a vector whose components are the M integrated fluxes in the individual wavelength channels. We consider a set of N vectors each of M elements [Xλ,i, i= (1, …, N), λ= (1, …, M)], where N is the number of galaxy spectra. The sample is therefore represented by an N×M matrix. The eigenvectors of the covariance matrix are the new axes, called the principal components, and the eigenvalues give their variance.
Since for PCA the spectra must be identically sampled in wavelength, and should have an equal number of bins, the IUE data have been pre-processed. Each spectrum has been dereddened for Galactic extinction using Seaton's (1979) law and shifted to the rest frame, according to the redshift data in Table 1. The SEDs have been corrected only for interstellar extinction, adopting a conservative approach. It is well known that the Seaton standard extinction law is not suitable for external galaxies, and it sometimes overestimates the 2175-Åbump (Calzetti, Kinney & Storchi-Bergmann 1994; Calzetti 1999, 2001). Moreover, the attenuation due to dust either within the galaxy or along its line of sight is an important effect in the UV range. This attenuation effect depends strongly both on the relative geometric distribution of dust and stars, and on the dust chemical composition or metallicity. A differential internal reddening law should be applied to each galaxy. However, we still have only a limited knowledge of the dust properties in the Milky Way and in the Magellanic Clouds, and of the differential extinction curve properties of quiescent and active-region galaxies (Gordon et al. 2003). Since the energy absorbed by dust is reprocessed, mainly in the infrared, an estimation of the extinction requires multiwavelength data or, at least, a measure of the infrared emission for each galaxy. In the future such data will become available thanks to the UV and infrared (IR) surveys of GALEX and of SIRTF.
Our sample of galaxies is UV-selected, and we estimate that this ensures that the galaxy light is not heavily absorbed, although the presence of several dusty systems cannot be excluded.
Moreover, the ratio of the infrared to the far-UV emissions is different for different star populations. A dust-reddened population mimics an older unreddened stellar population: this could affect the interpretation of the relative contribution of each age population to the total galaxy spectrum. Bonatto et al. (1998, 1999) noted that some galaxies have a contribution of young stars, although their spectrum looks very red. Spectral features, such as the line equivalent widths, can help distinguish a reddened population from an old one.
The use of a statistical approach, such as the PCA, limits the possibility of separating an older population from a reddened one and this should be considered when analysing the possible correlation (Section 5) between principal components and the morphological galaxy types. We believe that although the mixing of morphological types can be partially attributed to differential dust absorption, our analysis indicates that the PCA methods applied to larger galaxy samples could be a useful classification method.
The redshift range spanned by the sample is small (see Fig. 2), so that the wavelength range covered by all the galaxies of the sample is similar but slightly shorter than that covered by the SW IUE spectra. Note that in almost all galaxies, owing to the small redshift range, the N vλ1242 line is blended with the geocoronal Lyα.
The rest-frame spectra have been rebinned to a linear wavelength scale in the rest frame. The wavelength increment adopted is twice the sampling interval of the low-resolution SW spectrograph of IUE (≃3.4 Å), in order to preserve the spectral features of each spectrum. This increment determines the number of wavelength points to be used for the PCA. Note that the IUE spectral resolution is much superior to that of GALEX(Δλ/λ≃ 150), Bianchi and the GALEX team (1999) offering, in principle, a better discriminating power.
The sample chosen for the present analysis is therefore represented by 118 galaxy spectra, each with 204 wavelength flux bins. The N×M matrix representative of the sample is a 118 × 204 singular matrix, and the eigenvalues of the covariance matrix were found using the singular valued decomposition technique (SVD: Mittaz, Penston & Snijders 1990). The average of the rest-frame, rebinned spectra has been subtracted from each spectrum. This procedure ensures that the data set of the subtracted spectra should contain the maximal amount of discriminatory information. Otherwise, the average of the spectra dominates the matrix and the first principal component.
The problem of scaling and normalizing the input data before applying the PCA method has been extensively addressed (Francis et al. 1992; Connoly et al. 1995). For instance, the flux in each wavelength bin can be scaled to unit variance. The variance scaling is important when there are variables with a large range of absolute values, such as strong emission lines. The wavelength bins corresponding to these lines could dominate the PCA analysis and mask the continuum variations. Francis et al. (1992) found that the PCA results are insensitive to scaling and that the same number of components are present, although with different fractions of the total variance.
Connoly et al. (1995) analysed the effect of various normalization methods on the results of the PCA using a sample of template galaxy spectra. The most popular methods are the normalization by the integrated flux, or by the unit scalar product. The normalization by the integrated flux is not suitable for our sample, since it would give the same weight to high signal-to-noise as to low signal-to-noise spectra.
The alternative normalization method, by the scalar product, means that the sum of the squares of the (positive and negative) fluxes across the spectrum is forced to unity, 
Fig. 3 shows the mean spectrum of the 118-galaxy sample before and after applying the scalar product normalization. While the continuum trend is almost unchanged, the spectral features are smeared out by this normalization procedure.
The mean spectrum of the sample without normalization (tracing a), after normalizing for the scalar product (tracing b), and after selecting for good signal-to-noise ratio (tracing c). Tick marks indicate the following features: Si iλ1260, O iλ1302 plus Si iiλ1304, C iiλ1335, Si ivλ1400, C ivλ1550, He iiλ1640.
Since our data are flux-calibrated spectra, and the total flux is an intrinsic characteristic of the galaxy, we applied the PCA analysis to the sample with no normalization and no scaling of the data. We compared the results with that of a normalized sample and of a subsample of galaxy spectra with good signal-to-noise ratio, normalized by the scalar product.
4 The Principal Components Of The Sample
In this section, the input data for our analysis are the fluxes in different wavelength bins, without variance scaling or flux normalization. The principal components are intrinsic to the spectra and can be related to both the magnitude and the features of the observed spectra (Folkes, Lahav & Maddox 1996).
The average spectrum (Fig. 4, top panel) shows no intense emission lines but only low- and high-ionization absorption lines, which may be both of stellar and interstellar origin. The most prominent absorption lines are the Si ivλ1400 and the C ivλ1550 doublets, which show a complex structure reminiscent of P-Cygni profiles. Additional low-ionization absorption lines of the blend of O iλ1302 with Si iiλ1304, and of C iiλ1335, of both stellar and interstellar origins, are evident bluewards of 1400 Å(De Mello, Leitherer & Heckman 2000). The emission feature at 1412 Ådoes not seem to be a spurious feature introduced by noise.It could be a blend of Si ivλ1400 with Si iiiλ1417, a stellar photospheric line present in high-metallicity galaxies (Heckman et al. 1998).
The average spectrum (top panel) and the principal components for the entire set. The three lower panels show the three principal components PC1, PC2, PC3.
The first three eigenvectors, shown in Fig. 4 together with the mean spectrum, account for 52 per cent, 17 per cent and 14 per cent of the variance, respectively. These three eigenvalues carry 83 per cent of the information content of the total variance. Adding the fourth component, we account for up to 91 per cent of the variance. Subsequent eigenspectra each contribute a few per cent of the total variance.
The first PC (Fig. 4b) is flatter than the mean spectrum and modulations are present, such as the emission feature at λ1412 as well as some absorption features such as the Si ii/O iλ1300 and the C iiλ1335 lines (Heckman et al. 1998). This PC component, accounting for the largest variance of the data, represents the diversity from the average spectrum of the sample. It shows that a continuum ingredient flatter than the mean spectrum is the dominant component that characterizes each spectrum.
The second component (Fig. 4c) is flat at short UV wavelengths but shows a rising continuum redwards of the emission feature at λ1550 Åwith a residual of P-Cygni profile. This component represents the slope variation of the SED. It can be associated with the UV emission of the unresolved stellar population, such as individual stars and low-luminosity stellar clusters (Calzetti 1999), and it is correlated with the C ivλ1550 emission.
The main feature of the third component (Fig. 4d) is the rising continuum blueward of λ1400 towards the far-UV region, steeper than the mean spectrum. The modulation by the absorption lines of the Si ivλ1400 and of the C ivλ1550 doublets is in the opposite sense to that shown by PC2.
The rising UV continuum toward the far UV is recognized as a signature of the presence of young massive OB stars. These stars in which the emission peaks in the far UV at λ≤ 1000 Å represent, therefore, the bulk of the most recent or current starburst events in the galaxy. The strong winds of these stars cause the P-Cygni profiles seen in S iv and C iv (Mass-Hesse & Kunth 1998). Therefore, the third component represents the star-formation activity and is correlated with the S iv and C iv absorptions features.
The fractional variance accounted for by the second and third components is similar, showing that in our sample the contributions of the two continuum components, the young and the older stellar ones, are similar.
The fourth component (not shown here) is flat and shows only a weak signature of the He iiλ1640 absorption/emission. This feature appears clearly only in the sixth and the seventh principal components that contribute only a few per cent (two and one) to the total variance.
4.1 The normalized sample
We applied the normalization by the scalar product to our sample of spectra and repeated the PCA analysis. The average spectrum of the normalized sample is dominated by the noise (see Fig. 3, tracing b) and many features are smeared out. In fact, this normalization process overweighs the poor signal-to-noise spectra in the sample and the resulting average spectrum depends on the percentage of good signal-to-noise spectra in the sample.
The principal components of the normalized sample are shown in Fig. 5. It can be seen that the noise is so high that it hides all the spectral features. The first component accounts for only 36 per cent of the variance, the second one for 24 per cent, and the third for13 per cent. Moreover, the spectral features of these components are anticorrelated with those of the average spectrum and are similar to each other. It seems that the PCA technique is unable to discriminate among the different contributions to the SED, as found for the non-normalized sample.
The average spectrum and the principal components for the normalized set.
Folkes et al. (1996) found that in a noisy set of spectra the PCA method is still able to select the correlations in the fluxes at each wavelength, but few PCA components will be significant. Our result shows that the very noisy data and the statistical distribution of different spectral types in our sample make the normalization technique unsuitable.
The problem of signal-to-noise limitations of the IUE data can be overcome by grouping objects with similar spectra into morphological templates with high signal-to-noise ratio. This binning procedure has been adopted, for instance, by Bonatto et al. (1995, 1996, 1998, 1999).
Instead of grouping the spectra a priori, we performed a selection by signal-to-noise ratio, and applied the PCA method to a subsample of relatively high-quality spectra (S/N ≳ 3) normalized by the scalar product. The average spectrum for this subsample of 76 galaxies is quite similar to that of the entire non-normalized sample (Fig. 3, tracing c). However, the two samples have a different morphological composition (Fig. 6). Selecting only spectra with good UV signal-to-noise ratio has the effect of increasing the number of irregular/interacting systems, and the relative fraction of different galaxy types changes significantly. The elliptical galaxies are very poorly represented in this subsample, since their number drops from 28 to only six galaxies. While the fraction of BCD and compact galaxies remains almost the same, that of the ellipticals changes from 24 per cent to 10 per cent.
The distribution of spectral types for the good S/N subsample.
The principal components for this sample are shown in Fig. 7, with the first component accounting for 41 per cent of the total variance, the second one for 23 per cent and the third one for 15 per cent. The first and, to a lesser degree, the second components show a redwards rising continuum that could represent the contribution from old stars to the total flux, while in PC3 the continuum is rising bluewards. In Section 5 we will correlate the PCA results with the morphological Hubble classification.
The average spectrum and the principal components for the normalized subset of good S/N spectra.
4.2 The reduced subsample
The PCA analysis was performed also for a sample of IUE galaxies having ‘coverage parameter’ (see Section 2) up to 1. For this sample, the IUE aperture contained more than 10 per cent of the galaxy. This sample consists of only 43 galaxies, mostly compact, BCD and EmLS. Only four of the galaxies are normal ellipticals and spirals, and three are classified as irregulars. This sample is not representative of the galaxy morphology as a whole, but only of the compact and BCD classes.
Fig. 8 shows the principal components for this subsample, where PC1 accounts for 51 per cent of the variance, PC2 for 22 per cent and PC3 for 16 per cent of the variance, respectively. The first three components allow the reconstruction of the spectrum with an accuracy of 89 per cent.
The average spectrum and the principal components for the sample with coverage factor up to 1.
The first principal component, flatter than the average spectrum, represents the residual continuum and measures how much each continuum spectrum differs from the mean spectrum. The second principal component, showing a rising continuum towards long wavelengths, may be the emission of a residual population of A and F stars formed in previous bursts of star formation. Actually, the unresolved stellar population of a galaxy in which bright star-forming clusters, as well as small low-luminosity stellar clusters are embedded, contributes with a large percentage (50–80 per cent) of the UV emission (Calzetti 1999). Note the anticorrelation with the high-ionization absorption lines of Si iv and C iv, formed in the expanding atmosphere of massive OB stars, which are a signature of active star-forming regions. The third component, characterized by a hard UV continuum and the Si iv and C iv lines in absorption, represents the starburst activity occurring in the galaxy.
5 Spectral and Morphological Classification
PCA anlysis has already been applied to the study of integrated spectra of galaxies in the optical range. Connoly et al. (1995) analysed a template UV–optical spectral data set that covers the range from 1200 Åto 1 μm, finding that a linear combination of two eigenspectra describes adequately the galaxy spectral types. Folkes et al. (1996) and Sodré & Cuevas (1994, 1997), applied the method to the Kennicutt spectrophotometric atlas of galaxies (Kennicutt 1992) and to a subsample of normal galaxies. They found that the coefficients of the projection of the spectra on to the principal plane, i.e. the plane defined by the first and second principal components, define a spectral sequence. This sequence correlates with the Hubble morphological sequence, although there is an overlap between the different morphological groups.
The interpretation of the PCA analysis of the IUE spectra is more intriguing. We analysed the coefficients of the projection on to the new orthogonal axes, i.e. the PC components, for each spectrum. These coefficients represent the contribution of each component to the overall spectral distribution of the galaxy. If there is an underlying global regularity responsible for the different kinds of spectra, these coefficients will show correlations and could be used to define some kind of spectral sequence in the UV.
For the analysis of the projected spectra, the galaxies have been binned in four morphological bins: elliptical, spiral, irregular and a group containing all the compact objects, namely galaxies classified as BCD, EmLS, H ii and compact. This class includes a variety of objects that show prominent UV emission, which can be explained by the presence of a central region of star formation.
It is usual to consider the diagram of the projections on the principal plane, since this is the plane that contains the maximal contribution to the variance (69 per cent, in our case). However, the projections on this plane fail to reveal any correlation and show only a large scatter. The plane defined by the first and the third eigenvectors represents nearly the same variance contribution (66 per cent) and here there is an indication of a sequence. Note that, as described in Section 4, the third principal component represents the contribution of young stars to the SED, while the second one is the contribution of the underlying background of star-forming activity that occurred in the past.
Fig. 9 shows the projections on to the plane defined by the first and the third principal components for the spectra of the non-normalized sample, after excluding a few unusual points. Although there is an indication of a sequence that follows a direction along the first component, there is also some vertical spread along the third component. In the plane defined by the second and the third components (Fig. 10) the elliptical galaxies and the compact galaxies lie on the same region apparently tracing a sequence, while the spiral and irregular galaxies show a large scatter. This could be interpreted as a similarity between the star-formation activity of the nucleus of the elliptical galaxies and the compact galaxies.
Projections on to the first and third eigenvectors of the spectra of the non-normalized sample. Filled squares indicate elliptical galaxies, open squares indicate spirals, diamonds indicate irregulars, and stars indicate BCD, H ii and compact galaxies.
Projections on to the second and third eigenvectors of the spectra of the non-normalized sample. Filled squares indicate elliptical galaxies, open squares indicate spirals, diamonds indicate irregulars, and stars indicate BCD, H ii and compact galaxies.
The SED of early-type galaxies is often characterized by rising flux shortward of λ1800 Å, known as the UV turn-up. A mixture of low-mass stars on the horizontal branch evolutionary tracks is responsible for the UV flux (e.g. Brown et al. 1997). This turn-up is mostly observed in galactic nuclei and could be significant in a sample of nearby galaxies observed throughout the IUE aperture, like this one. We cross-checked our sample with the Bica et al. (1996) sample of elliptical galaxies finding only one galaxy in common, NGC 4853, which does not present a UV turn-up. A visual examination of the spectra of all the elliptical and SO galaxies of our sample reveals only a few galaxies with a moderate UV turn-up: NGC 1510, ABCG400A and ABCG1795. Deharveng, Boselli & Donas (2002) analysed the broad-band UV−V and B−V colours for a sample of 82 galaxies, finding that only a minority of galaxies shows a strong turn-up. Note also that signs of unusual activity have been found in the optical spectra of some early-type galaxies (Caldwell et al. 1993), and residual starburst activity was also claimed by Deharveng et al. (2002) for some very blue elliptical galaxies. Although our sample is biased towards the UV-brightest galaxies, it is hard to believe that almost all the elliptical galaxies of the sample show the same level of nuclear activity as the compact galaxies.
Fig. 11 shows the projection on to the plane defined by the first and the third eigenvectors of the spectra of the sample selected for good signal-to-noise ratio and normalized by the scalar product (Section 4.1). Here, the projections lie on an arc sequence, similar to the spectral sequence found by Connoly et al. (1995) for the 10 templates of starburst and quiescent galaxies from Calzetti et al. (1994). Note that the curved sequence is due to normalization of the scalar product, as already pointed out by Sodré & Cuevas (1997). The sequence is traced by the compact and irregular galaxies, but the binning with the morphological type is not unique. Spiral and elliptical galaxies are not segregated from other types and their location in the diagram shows that they are more consistent with a significant starburst component contribution to the SED.

Projections on to the plane defined by the first and the third eigenvectors of the spectra of the normalized and S/N-selected sample. Filled squares indicate elliptical galaxies, open squares represent spirals, diamonds indicate irregulars, and stars indicate BCD, H ii and compact galaxies.
The mixing of spectral types along the sequence is also evident in the projection of the components for the subsample of galaxies where more than 10 per cent of the galaxy area is included in the IUE entrance aperture (see Section 4.2). In this sample, compact types are the dominant population and many of these galaxies are known to host one major central starburst region. Figs 12(a) and (b) show the projections of the spectra on to the plane of the first and the third components and on the plane of the second and the third components, respectively. In both figures it is evident that the third component is able to trace a similar sequence populated by most of the compact galaxies, while the few spiral and elliptical galaxies in this sample lie at the bottom of the oblique trend, in a region of low values of the third component.
Projections of the spectra of the subsample with coverage parameter C≤ 1 on to (a) the plane defined by the first and the third eigenvectors and (b) the plane defined by the second and the third eigenvectors. Filled squares indicate elliptical galaxies, open squares indicate spirals, diamonds indicate irregulars, and stars indicate BCD, H ii and compact galaxies.
This trend is enhanced in Fig. 13, where the third component is plotted versus the average of the first and second orthogonal components. In this figure the galaxies can be separated into a group which follows a quasi-linear and tight trend and a group with scattered large positive values on the horizontal axis. The ultracompact object Pox186 lies at the top of the sequence and the extremely metal-poor SBS 0335–052 and Tol 0420–414 lie at its bottom. The object at the top-left side of this figure is an H ii region in NGC 4449, while the irregular galaxy on the rising trend is IC2458 (Mrk 108), classified as BCD by Kinney et al. (1993). The scattering at high positive values of the horizontal variable may result from the presence of dust. It is well known that the galactic extinction is not appropriate for correcting the attenuation by dust inside the galaxy. For instance, the point at the extreme right-hand side of Fig. 13 is Tol 0645–376 whose principal components are always unusual in all the diagrams. Terlevich et al. (1991) report a high Hα/Hβ ratio of 4.28, larger than for Case B recombination, indicating that dust is present in the region of line formation.
Projections into the plane defined by the linear combination of the first and the second eigenvectors, and the third eigenvectors of the spectra of the subsample with coverage parameter up to 1. Filled squares indicate elliptical galaxies, open squares indicate spirals, diamonds indicate irregulars and stars indicate BCD, H ii and compact galaxies.
It is not clear which is the physical parameter that defines the sequence. Pox 186 was believed to be the representative of an extreme population of isolated BCD galaxies at their first episode of star formation. Recently, an extended halo feature was detected by Doublier et al. (2000). The colours of the outer region of the galaxy are consistent with an underlying evolved stellar population of late-K and M stars (Corbin & Vacca 2002), probably the residual of a previous mild episode of star formation. The UV image suggests the presence of two colliding clumps (Corbin & Vacca 2002), while there is no sign of this morphology in the optical image. Several bright star clusters have been detected at the centre of SBS 0335–052 (Papapderos et al. 1998) and also an extensive H i envelope. The observed properties make its classification as a young galaxy uncertain (Östlin & Kunth 2001). Similarly, in Tol 0420–414 a diffuse stellar component underlies the starburst, which is powered by Wolf–Rayet and O stars (Fricke et al. 2001).
It is becoming evident that not all the BCD galaxies are truly young objects (Kunth & Östlin 2000). For instance, the presence of an evolved population, formed at a continuous low rate or in a previous episode of star formation, is required to explain their broad-band colours (Gil de Paz, Madore & Pevunova 2003). However, in starbursts the star-formation knots dominate the entire galaxy emission, and only very large telescopes can detect halo structures.
In Section 4.2 we argued that the third component is associated with the hard UV continuum, and is representative of the degree of recent star formation in the galaxy. The sequence traced in Fig. 13 is similar in shape to the diagram for galaxy line ratios (Baldwin, Phillips & Terlevich 1981, hereafter BPT). In this diagram, the two reddening-insensitive ratios of [O iii]/Hβ versus [N ii]6584/Hα discriminate among emission-line galaxies according to the ionization mechanism, i.e. ionization due to ultraviolet radiation of hot stars or to a power-law continuum (Veilleux & Osterbrook 1987).
In the BPT diagram for more than 55 000 galaxies from the Sloan Digital Sky Surveys (Kauffmann et al. 2003 fig. 1) the star-forming galaxies lie on a tight sequence. This sequence is correlated with the ionization parameter and the metallicity, for which the ratio[N ii]6584/Hα is a direct estimator (Denicolo', Terlevich & Terlevich 2002).
We checked if the similarity in shape reflects a correlation of the principal components with the line ratios of the BPT diagnostic diagram. Spectroscopic data are available for only very few galaxies, mainly from Terlevich et al. (1991). A correlation with the metallicity can be excluded, while no conclusive relation with the [O iii]/Hβ ratio can be deduced from so few points.
If the sequence in Fig. 13 is tracing the starbursting activity, it should correlate with the luminosity of the Balmer Hα line, which is a direct estimator of the presence of young massive stars (Kennicutt 1998). We found in the literature the Hα equivalent width (EW) for a few galaxies of this subsample and we plotted in Fig. 14 the retrieved values versus the third component values. Although visually there is a hint of a possible correlation, its statistical significance is very low. More such observations and dust attenuation correction are necessary before establishing the expected correlation. However, the ability of the PCA method to separate different contributions to the SEDs could be used as a tool for tracing sequences in larger samples of starburst galaxies.
The third component versus Hα for some of the compact galaxies. The line shows a linear regression.
The data set used was analysed without any preliminary selection, except for the objective coverage factor, defined in Section 2. We specifically avoided any attempt to divide the sample into subgroups according to their spectrum, because in the UV some signatures for the presence of young stars are expected for all Hubble types. It is well known that episodes of star formation occur in a variety of environments, such as nuclei of spiral galaxies, or blue compact galaxies, or H ii galaxies or regions.
We searched for an objective parameter that could define a sequence in the UV by projecting the spectra into the plane of the principal components, such as that found in the optical domain (Connoly et al. 1995; Folkes et al. 1996; Galaz & de Lapparent 1998). The UV domain was included only in the analysis of 10 templates by Connoly et al. (1995). However, the UV portion of the SED has a small weight in the spectral range of frequencies analysed (from 1200 Åto 1 μm), and the spectral sequence outlined by the PCA for this sample is essentially defined by the optical emission of the galaxies.
In our data set, the small size of the entrance aperture of the IUE could be one of the causes of the failure of tracing an ordered and continuous sequence of the projections of spectra into the new axes. This aperture sampled only the emission from the optical centre of the light, while often the brightest part of the UV image of a galaxy is rather distant from the centre. In nearby spiral galaxies, for instance, the IUE sampled essentially the bulge emission and only partially the disc emission. Since the circumnuclear bulge hosts a variety of components, including star-forming rings or resolved star clusters and spiral structures (Boker et al. 2002), it is not surprising that many objects classified as spiral galaxies and compact or BCD galaxies populate the same region in the plane of the principal components (see Figs 9 and 10)
Concluding Remarks
In this paper we analysed the UV spectral energy distribution of normal galaxies listed in the IUE INES Guide No. 2 – Normal Galaxies (Formiggini & Brosch 2000) using a principal component analysis. Since this method can reveal the internal correlations of a set of data and retrieve their common features, we aimed to identify an objective parameter able to define a galaxy sequence in the UV.
The sample consists of the SW IUE spectra of the central regions of 118 galaxies, covering a wide range of Hubble types, where the aperture included more than 1 per cent of the galaxy area. The PCA method was applied to the sample without normalization or scaling, to a subsample of good S/N spectra, normalized by the scalar product, and to a subsample where the IUE aperture contained more that 10 per cent of the optical galaxy area. The principal components retrieved by the PCA have been associated with the main components observed in the UV spectra of galaxies. The first component, accounting for the largest source of diversity, may be associated with the UV continuum emission. The second component, rising redward of 1500 Å, represents the UV contribution of an underlying evolved stellar population (A stars and later). The third component is sensitive to the amount of activity in the central regions of galaxies and measures the strength of recent or current star-formation events.
For the sample and subsamples analysed, the principal component representative of star-forming activity accounts for a significant percentage of the variance. In the entire sample, the first three principal components explain 83 per cent of the variance among the spectra.
The fractional contribution to the SED by the evolved stars and by the young population are similar.
The projection of the spectra on the plane defined by the first and the third components for the entire sample fails to outline a regular pattern. For all the morphological types, a contribution from a young population seems to be present in the nuclear region of the galaxies, although with a different activity state. However none of the principal components is able to outline an internal correlation or to correlate with the optical morphological types.
In a sample of 76 good S/N spectra, normalized by the scalar product, the projected spectra show an arc-like sequence, similar to that found by Connoly et al. (1995) for the 10 template spectra from the Kinney et al. (1993) sample although with a large overlap of morphological classes.
A reduced sample of 43 galaxies, where the IUE aperture included more than 10 per cent of the galaxy, contains almost only compact and BCD galaxies. The projections of the spectra of this sample on to the plane defined by the first and the third principal components outline a sequence that could be related to the degree of starburst activity of the galaxy, where the most active galaxy is Pox 186 and the few early and late-type galaxies occupy the low-activity region. A similar sequence is shown by the projections on to the second and third components. A quasi-monotonic sequence is outlined by the third component with respect to a linear combination of the first and second components. The correlation of the third component with the Hα EW is not statistically significant, due to the small number of points. We suggest that more observations could establish that the third principal component indeed represents the star-forming activity of the galaxy.
We initiated this study as an attempt to predict the UV SED using the morphological classification of a galaxy and its optical emission properties, using the IUE spectra as the data base. The work described here indicates that some degree of success in this endeavour could be expected, provided that the UV data are based on good signal-to-noise UV spectra that represent the total UV emission of a galaxy.
Assuming that a characterization of the UV properties would be done from the GALEX results, the galaxy coverage would be taken care of automatically by using the objective prism feature. However, one would have to deal with low-resolution spectra even for point-like objects (≃10 Åat C ivλ1550, more than twice that used here) and it is not clear how this would influence the results. Given the lack of spectral discriminators longwards of ≃2000 Å, it is unlikely that the LW part of the GALEX spectra would add much information content to a future PCA analysis.
Acknowledgments
We acknowledge helpful discussions with O. Lahav and S. Steindling. UV astronomy at Tel Aviv University is supported by the Austrian Friends of the Tel Aviv University.
References
Retrievable electronically at http://wise-iue.tau.ac.il/~lili/Fnet/Fnet.html
