-
PDF
- Split View
-
Views
-
Cite
Cite
M. E. Gray, C. Wolf, K. Meisenheimer, A. Taylor, S. Dye, A. Borch, M. Kleinheinrich, Linking star formation and environment in the A901/902 supercluster, Monthly Notices of the Royal Astronomical Society, Volume 347, Issue 4, February 2004, Pages L73–L77, https://doi.org/10.1111/j.1365-2966.2004.07489.x
Close - Share Icon Share
Abstract
We investigate correlations between the location of galaxies in dense environments and their degree of star formation activity. Using photometric redshifts and spectral classifications from the unique 17-band COMBO-17 survey we are able to precisely isolate galaxies from the Abell 901/902 supercluster within a thin redshift slice around z = 0.16. We compare the detailed photometric properties of the supercluster galaxies with the underlying dark matter density field as revealed by weak gravitational lensing. We find strong evidence for segregation by type, with the highest density regions populated almost exclusively by galaxies classified according to their rest-frame U−V colours as quiescent. We also observe a threshold surface mass density from lensing, κ∼ 0.05 (corresponding to a physical density Σ= 2.5 × 10¹⁴h M⊙ Mpc−2), above which star formation activity is rapidly suppressed. This abrupt transformation affects primarily the faint end of the star-forming galaxy population and occurs at a local surface number density corresponding to roughly 400 h2 Mpc−2 to a limit of M*V+ 6. When only galaxies brighter than M*+ 1 are considered the trends with environment remain, but are more gradual and extend beyond 2 h−1 Mpc radius.
1 Introduction
At a given epoch, the observed properties of galaxies in dense clusters of galaxies are known to vary from those residing in the more rarefied field. The classic example of such an environmental dependence is the well-known morphology–density relation, T−Σ (Dressler 1980; Dressler et al. 1997; Treu et al. 2003), in which a dramatic increase in the proportion of elliptical galaxies is seen toward the cores of rich clusters. Clusters of galaxies appear to act to accelerate galaxy evolution, possibly through increased galaxy–galaxy interactions and/or interactions between galaxies and the global cluster environment. It is possible to probe the environmental dependence of galaxy evolution by tracing changes in both structural parameters and star formation activity.
Previous studies have found evidence for gradients in star formation properties (Abraham et al. 1996; Balogh et al. 1997; Hashimoto et al. 1998) in samples of rich clusters. More recently a relation between star formation activity and local galaxy density (referred to here as the SF−Σ relation, analogous to the T−Σ relation) has been observed in several guises: a break in V−I colour in the outskirts of a z = 0.4 cluster (Kodama et al. 2001) and a decline in star formation rate toward clusters in the 2dFGRS (Lewis et al. 2002) and with increasing galaxy density in the SDSS (Gómez et al. 2003). Intriguingly, all three of these studies find evidence for threshold local galaxy densities above which star formation activity is rapidly quenched. The range of densities probed suggests that environmentally driven changes in the star-formation rate occur not only in the cores of rich clusters but also in regions more associated with poorer groups and infall regions. This picture is consistent with hierarchical models of structure formation (e.g. Kauffmann, White & Guiderdoni 1993) in which clusters grow by continuous accretion of galaxies or groups of galaxies from the field. Less clear, however, is the mechanism responsible for driving these transformations (Balogh, Navarro & Morris 2000; Diaferio et al. 2001; Okamoto & Nagashima 2003) and whether the same mechanism orchestrates changes in observed morphological, spectral, and photometric properties on similar time-scales.
The combination of wide-field gravitational lensing and multiband imaging offers a new approach to the study of galaxy evolution. Weak lensing directly probes the underlying density field (which may or may not be well correlated to local galaxy density), and thus offers a different but complementary measure of environment. The key quantity to consider is the total projected surface mass density, κ, expressed in units of the critical density for lensing. The construction of a SF−κ relation and its comparison with the analogous SF−Σ relation may shed new light on the mechanisms responsible for the transformation of galaxies as they are accreted on to a dense environment. In this paper we exploit the unique data set provided by the COMBO-17 survey and combine photometric redshifts, spectral energy distributions (SEDs) and weak gravitational lensing to investigate correlations between star formation activity and environment in a supercluster at z = 0.16. Throughout, we assume Ωm = 0.3, ΩΛ = 0.7, and H0 = 100 h km s−1 Mpc−1.
2 Observations And Galaxy Classifications
The A901/902 supercluster was observed in 17 bands (five broad-band, 12 medium-band) with the 0.5°× 0.5° ESO/MPG Wide-Field Imager as part of the COMBO-17 spectrophotometric survey (Wolf et al. 2003). The supercluster consists of three main cluster-sized mass concentrations all at z = 0.16 and contained within the field of view of the instrument. Preliminary results from a subset of the full data set, consisting of the broad-band B- and R-band data alone, were presented in Gray et al. (2002). These findings included a 2D map of the dimensionless projected surface mass density, κ, which was the result of a weak gravitational lensing reconstruction based on the deep R-band image. The complex structure and obvious non-relaxation of the system make it an ideal laboratory for probing a range of environments.
The procedure for classification and redshift estimation has been described in detail several times elsewhere (Wolf et al. 2003; Bell et al. 2003; Wolf, Meisenheimer & Röser 2001). Here, we only stress that on average we expect galaxy redshifts to be accurate to σz≈ 0.03 for a random sample (with early-types good to around ∼0.01), while faint starburst galaxies can be worse than ∼ 0.05. The 17-band system of ‘fuzzy spectroscopy’ allows for detailed rendering of template fits. With knowledge of the SED shape we can directly reconstruct rest-frame luminosities in Johnson U- and V-bands across a wide redshift range without generic k-correction.
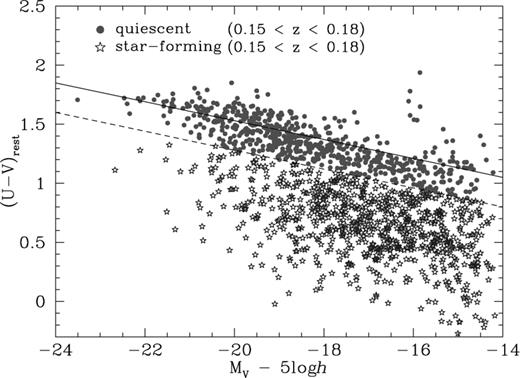
Armed with both SED classifications and photometric redshifts, it is possible to accurately isolate those galaxies belonging to the foreground lensing structure. Having first selected galaxies with R < 24 and 0.15 < z < 0.18, we then further subdivide the supercluster population into two classes according to photometric properties. Fig. 1 shows the measured rest-frame U−V versus absolute V-band colour–magnitude diagram for the redshift-selected galaxies. As in the study of the evolution of 5000 early-type galaxies in the COMBO-17 survey from 0.2 < z < 1.1 (Bell et al. 2003), we observe a distinctly bimodal distribution. We fix the slope of the prominent colour–magnitude relation (CMR) as −0.08 (Bower, Lucey & Ellis 1992) and fit the intercept for all galaxies with MV < −18 + 5 log h. We next define an offset Δ (U−V)c = 0.25 to mark the division between our two classes of galaxies. Redward of this limit we have the prominent ridge of red-sequence early-type galaxies, and blueward is the second population of star-forming galaxies. Note that this division between ‘quiescent’ and ‘star-forming’ galaxies is made purely on photometric information with no considerations regarding morphology.

Rest-frame U−V versus absolute V-band colour–magnitude diagram for supercluster galaxies with 0.15 < zphot < 0.18. The solid line indicates a fit to the cluster red-sequence with fixed slope of −0.08, and the dashed line indicates the adopted Δ(U−V)c cut-off between quiescent and star-forming galaxies. This figure is available in colour in the on-line version of the journal on Synergy.
This method of selecting cluster members by photometric redshift is in contrast to the alternative approach of selecting the red sequence along the B−R CMR (cf. Gray et al. 2002). While in that case blind red-sequence selection alone managed to isolate many of the quiescent galaxies, it was insensitive to the large number of blue star-forming galaxies within the structure, and furthermore suffered from the inclusion of galaxies along the line of sight. The combination of redshifts and photometric classifications offers a much more precise characterization of the luminous properties of the cluster, while simultaneously eliminating confusion from foreground/background contamination. Furthermore, we note that increasing the range for redshift selection to 0.15 < z < 0.2 makes negligible difference to the following analysis and conclusions. This consistency implies that the photometric redshifts of the quiescent galaxies are indeed accurate to σz∼ 0.01.
3 Galaxy Properties And Environment
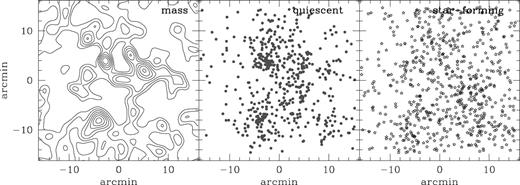
Fig. 2 shows the distribution of the redshift-selected galaxies relative to the mass map of Gray et al. (2002). A segregation effect by type is clearly evident, with the quiescent galaxies (Fig. 2, middle panel) much more strongly concentrated than the actively star-forming galaxies (Fig. 2, right-hand panel). The mass map (Fig. 2, left-hand panel) was constructed using a sample of quiescent galaxies chosen to have B−R colours redder than the colour–magnitude sequence, so overlap between the lensing and lensed populations here will be negligible. The map was smoothed with a Gaussian of σ= 60 arcsec (∼120 h−1 kpc). The rms noise in the map was estimated to be σκ = 0.027 by constructing 32 realizations of noise maps made by randomizing the shapes of the galaxies in the background catalogue. Thus, the three cluster peaks are each detected at the >3σ level, but mass peaks corresponding to additional concentrations of galaxies (i.e. a group in the south-west corner of the field) are not significantly detected above the noise.

Distribution of redshift-selected supercluster galaxies relative to lensing mass map of Gray et al. 2002 (left). The contours represent a spacing of Δκ= 0.02, smoothed with a Gaussian of σ= 60 arcsec. Note the decreasing concentration of the galaxies with increasing degree of star formation activity. This figure is available in colour in the on-line version of the journal on Synergy.
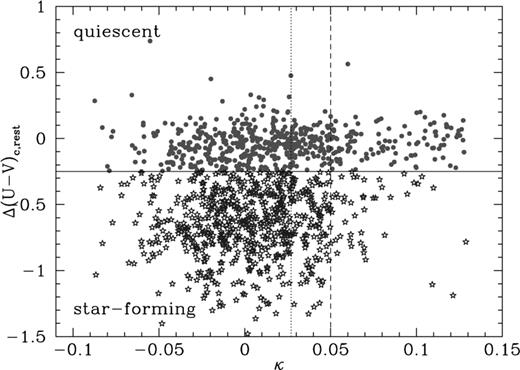
We find further evidence for the segregation of galaxy populations and a type-dependent correlation with the mass distribution by sampling the lensing mass map at the location of each of the supercluster galaxies. Using the deviation blueward of the cluster CMR sequence as a measure of star formation activity, Fig. 3 reveals that the highest density regions are populated almost exclusively by those galaxies classified as ‘quiescent’. Furthermore, there appears to exist a critical surface mass density, κ∼ 0.05, above which few star-forming galaxies are seen (although clearly a small number of galaxies would be expected to appear in projection against the mass peaks). We acknowledge that the noise in the mass reconstruction could scatter galaxies from lower to apparently higher densities, so this value may in reality be an upper limit. However, as will be seen later in the paper, obervations of a similar threshold in the galaxy number density (a less noisy quantity) and a correlation between number density and mass density supports the idea that the mass threshold is not drastically lower.

Star formation activity versus local surface mass density κ for each of the supercluster galaxies in the range 0.15 < zphot < 0.18. A strong segregation by type is seen, with the highest density regions populated almost exclusively by those galaxies classified as quiescent. The dotted line indicates the 1σ noise level in the mass map. The dashed line at κ∼ 0.05 illustrates the mass threshold above which the number of star-forming galaxies is rapidly reduced. This figure is available in colour in the on-line version of the journal on Synergy.
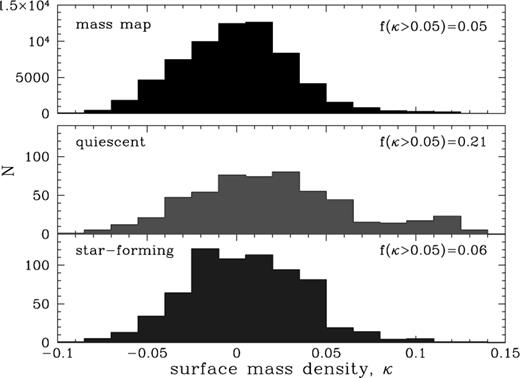
The strikingly different density distributions for each population are shown in Fig. 4. The distribution of pixels in the mass map itself is also shown: the noise inherent in such mass reconstructions is reflected in the number of ‘negative mass’ pixels, but we note the asymmetry of the distribution and the tail at high densities. The fraction of star-forming galaxies found in regions with density above this threshold, ƒ(κ > 0.05), is 0.06, compared to 0.21 for quiescent galaxies. The abrupt transition to a population dominated by passive galaxies at high densities indicates that an environmental effect may be responsible. It is possible that we are observing the truncation of active star formation as galaxies are accreted on to the dense supercluster environment.

Distribution of environments populated by quiescent and star-forming galaxies, with surface mass density sampled at the location of each supercluster galaxy. The fraction of each population residing in high-density regions is shown. The top histogram illustrates the distribution of densities from the lensing mass-map. This figure is available in colour in the on-line version of the journal on Synergy.
When considering the relative abundances of each type of galaxy at a given density, we find that behaviour analogous to the traditional morphology–density relationship (Dressler 1980) is evident in the SF−κ diagram in Fig. 5 (left-hand panel). The fraction of galaxies that are actively forming stars plummets at high surface mass densities, with a compensating rise in the fraction of quiescent galaxies. For comparison, the relative abundances of each type in the field were determined from identical redshift slices in two blank COMBO-17 fields. Even at low surface mass densities the fraction of galaxies classified as quiescent in the supercluster is in excess of the field value. However, measurements in this regime may suffer from contamination by low-mass groups whose mass peaks are not detected above the noise, but which none the less contain a higher-than-field fraction of quiescent galaxies.

Left: SF–κ relation. A dramatic change in relative abundance of each galaxy type at a given density is seen as the proportion of star-forming galaxies declines and quiescent galaxies become more dominant in dense regions. The symbols at left show the corresponding fractions reached in the field, obtained from an identical redshift slice within two blank COMBO-17 fields. As negative values for κ indicate noise in the mass reconstruction, these data have been collected into a single bin. Horizontal error bars represent bin widths and are shown for the quiescent galaxies only, for clarity. Middle: local mass density versus local galaxy number density, sampled at the location of supercluster galaxies. A global trend is evident but with considerable scatter from cluster to cluster (also note the logarithmic horizontal axis). Right: effect of magnitude limit on galaxy colour trends. The rest-frame (U−V)c colour is shown as a function of local galaxy density for various limiting magnitudes to mimic relevant studies in the literature. The corresponding ‘critical densities’ for the suppression of star-formation are indicated by arrows. The solid lines show the 25th, 50th, and 75th percentiles of each distribution, and in each case the trends are strongest for the bluest quartile. The dotted lines represent the same percentiles observed in the COMBO-17 offset fields for each limiting magnitude, and the open squares show the value of Σ10 at which those quantities are measured. This figure is available in colour in the on-line version of the journal on Synergy.
Considering the threshold density of κ= 0.05, we convert to physical units by assuming that the source galaxies for lensing reside on a plane at z = 1.0 (cf. Gray et al. 2002; Brown et al. 2003). Then the critical density for a lens at z = 0.16 is Σcrit = 5.0 × 10¹⁵h M⊙ Mpc−2, which yields a projected density of Σκ = κΣcrit = 2.5 × 10¹⁴h M⊙ Mpc−2. The advantage of gravitational lensing is that this measure of total projected mass has the potential to allow direct comparison with dark matter particles in simulations, without assumptions regarding if and how light traces mass. In addition, most of the mass in the inner regions of clusters is thought to be smoothly distributed, with only 10–20 per cent of the total mass in the core regions associated with individual galaxy haloes (Natarajan, Kneib & Smail 2002). However, in order to compare these results with previous studies of galaxy evolution in dense environments, we then ask: does this total mass density correspond to a counterpart threshold galaxy number density?
Gray et al. (2002) found that the distribution of (colour-selected) early-type galaxies alone relative to the mass distribution did not scale in the same way for each of the three clusters. Indeed, in one case the two distributions showed significant misalignment. However, with the addition of the full redshift-selected sample of supercluster galaxies available for this work we find a qualitative improvement (though still with large scatter) in the relation between surface mass density and local galaxy number density. We define Σ10 as the local density by calculating the area of the circle containing a given galaxy and its ten nearest neighbours within our redshift slice. We exclude all galaxies for which such a circle would extend outside the field boundaries. Fig. 5 (middle panel) shows that the surface mass density κ∼ 0.05 corresponds to a local galaxy density of 1.8 < log Σ10 < 2.8, though this sampling is restricted to the location of the supercluster galaxies and so cannot probe areas containing dark matter but few galaxies. Therefore, though local number density is not necessarily a direct proxy for mass density, Fig. 5 (middle panel) shows that it serves here as a first approximation.
To compare this galaxy density threshold with previous studies, we note that our limit of R < 24 for photometric redshift determination corresponds to an absolute V-band magnitude of MV = −14.3 + 5 log h. Taking M*V = −20.2 + 5 log h (Brown et al. 2001), this corresponds to M*V+ 6, or 0.004L*. While the limiting apparent magnitude is similar to that of Kodama et al. (2001), the lower redshift of the A901 supercluster relative to their cluster at z = 0.4 allows us to probe 2 mag deeper down the luminosity function. Thus by applying the relevant luminosity limits we can make direct comparisons with the threshold densities quoted by Kodama et al. 2001 (corrected from ∼ 400 h2 to ∼ 120 h2 Mpc−2, brighter than M*V+ 4, in the corresponding erratum) and Lewis et al. 2002 and Gómez et al. 2003 (∼ 2 h2 Mpc−2, brighter than M*+ 1). Gómez et al. noted that even accounting for the change in luminosity limit these two measures appear to differ by an order of magnitude. Even following the correction of the Kodama et al. densities in the subsequent erratum, the breaks in galaxy properties still occur at different densities and different clustercentric radii. With the COMBO-17 data set, we are in a position to resolve this anomaly.
Fig. 5 (right-hand panel) shows the rest-frame colour trends with local galaxy density for all three magnitude limits under consideration (M*V+ 6, M*V+ 4, M*V+ 1). In each case the bluest quartile of the galaxy population shows the strongest change with density, in agreement with the previous studies. For the full data set (top panel), a sharp transition to redder colours is visible at log Σ10∼ 2.6 or ∼ 400 h2 Mpc−2, as anticipated from the κ− log Σ10 relation. If we apply the Kodama et al. M*+ 4 luminosity limit (middle panel), the break is less abrupt but a change in colour does appear to occur close to their critical density. However, when we restrict ourselves to the brighter limit (and thus lower galaxy densities) of Gómez et al. (2003) and Lewis et al. (2002), the trend with density is smoother.
Nevertheless, for all three magnitude limits the rest-frame colour is still redder than field values at all densities. These field densities and colour quartiles, taken from the same 0.15 < z < 0.18 redshift slice in the COMBO-17 offset fields, are indicated by the open squares and dashed lines in Fig. 5 (right-hand panel). An extrapolation of each curve back to the corresponding density in the field for that limiting magnitude shows good agreement with the measured colours at low densities. Furthermore, we note that the density of field galaxies in COMBO-17 at the bright limit (M*V+ 1) is close to the critical densities of Gómez et al. (2003) and Lewis et al. (2002), but that the colour transition for bright galaxies is noticeably smoother. Hence, this observed density threshold of ∼2 h2 Mpc−2 could more appropriately be interpreted as the point at which the abundance ratios begin to depart from those observed in the field. While at fainter limits this departure begins at densities Σ10∼ 10 h2 Mpc−2, this is in addition to the secondary and sharper cut-off seen here and in Kodama et al. (2001). This additional threshold occurs at a density which is an order of magnitude above the field density, and affects primarily the faint end of the luminosity function.
4 Conclusions
In summary, by adjusting the luminosity limits of our sample we observe two distinct effects: a gradual change in the properties of bright galaxies from several virial radii, and an abrupt change in the properties of the faint (starburst) population, occurring at r < 0.5 h−1 Mpc from the centre of each cluster. For the first time we are able to measure environmental effects using not only galaxy density but also direct measurements of the projected surface mass density κ from weak gravitational lensing. The observed galaxy density thresholds and clustercentric distances appear to be in broad agreement with both the low- and high-redshift studies cited above, when the differing luminosity limits are taken into account. We postulate a simple scenario in which we may be observing the effects of multiple mechanisms influencing the transformation of the bright and faint galaxies in the low- and high-density regimes.
In the transitional or infall regions where densities are relatively low, gradual processes over time-scales of several Gyr are dominant. The most likely mechanisms for the slow suppression of star formation include galaxy ‘harassment’ in the form of high-speed galaxy–galaxy interactions (Moore et al. 1996), or ‘suffocation’ following the removal of a diffuse hot gaseous reservoir and the subsequent consumption of any remaining gas (Larson, Tinsley & Caldwell 1980). At higher densities (or lower clustercentric radii) the abrupt observed transition may indicate the threshold at which the influence of the cluster potential takes hold. This influence may manifest itself through tidal truncation of galaxy haloes (Merritt 1983, 1984; Natarajan et al. 2002) or by ram-pressure stripping of galactic gas (Gunn & Gott 1972). Ram-pressure stripping requires dense gas so for a typical massive cluster becomes ineffective beyond ∼1 Mpc (Treu et al. 2003); likewise, the tidal effects of the cluster are felt over a very narrow range (100–200 kpc) and are most effective at disrupting less dense galaxies (Treu et al. 2003; Moore, Lake & Katz 1998).
For this particular supercluster field, the COMBO-17 data set has been further augmented by 2dF spectra and recent deep X-ray observations with XMM–Newton. Both additions will further test the mechanisms responsible for the galaxy transformations within this system. Analysis of the detailed spectroscopy of 300 supercluster galaxies will reveal their star formation histories, in particular signatures of cluster-induced starbursts or recently truncated star formation. Using measurement of emission and absorption features we will trace the distribution of starburst and post-starburst galaxies relative to both dark matter environment and local galaxy density. The X-ray data will probe the hot intracluster medium (ICM) and the test the effectiveness of ram-pressure stripping in these regimes. In addition, the remaining COMBO-17 fields cover a wider mass spectrum, including multiple cluster systems, an isolated cluster, and blank fields. Applying the joint lensing and multicolour analysis to all these fields will help to untangle environmental links between dark matter distribution, local galaxy number density, and galaxy evolution.
Acknowledgments
MEG acknowledges a PPARC Postdoctoral Fellowship and thanks Ian Smail and Eelco van Kampen for useful discussions. CW was supported by the PPARC rolling grant in Observational Cosmology at the University of Oxford. SD was supported by a PPARC rolling grant at Imperial College. We are grateful to the anonymous referee for useful suggestions that improved the paper.


