


Abstract
New photometry of RRab and RRc stars in ω Centauri is used to calibrate their absolute magnitudes MV as a function of (a) metallicity and (b) the Fourier parameters of light curves in the V band. The zero point of both calibrations relies on the distance modulus to the cluster derived earlier by the Cluster AgeS Experiment (CASE) project based on observations of the detached eclipsing binary OGLE GC17. For RRab variables, we obtained a relation of MV= (0.26 ± 0.08)[ Fe/H ] + (0.91 ± 0.13). A dereddened distance modulus to the Large Magellanic Cloud (LMC) based on that formula is μ0= 18.56 ± 0.14 mag. The second calibration of MV, which is based on Fourier coefficients of decomposed light curves, results in the LMC distance of μ0= 18.51 ± 0.07 mag.
1 Introduction
The Cluster AgeS Experiment (CASE) is a long-term project whose main goal is to determine the distances and ages of nearby globular clusters (Thompson et al. 2001). The primary distance indicators used by the CASE group are detached eclipsing binaries. The search for these relatively rare objects is performed using 1-m class telescopes. Usually for each target cluster, several hundred CCD frames are collected over one or more observing seasons. Suitable candidates are then observed with larger telescopes (e.g. Thompson et al. 2001). A secondary benefit of the project's survey phase is the detection of large samples of variables of various types including RR Lyr and SX Phe stars.
The first globular cluster for which the CASE project determined a distance was ω Centauri (ω Cen). An analysis of photometric and spectroscopic data for an eclipsing binary OGLE GC17 yielded an apparent distance modulus equal to (m−M)V= 14.09 ± 0.04 mag (Kaluzny et al. 2002).
Time series photometry of ω Cen obtained by the CASE project in the 1999 and 2000 seasons resulted in light curves of almost 400 variables from the cluster field (Kaluzny et al. 2003). The most numerous group were the RR Lyr stars. The new precise and well-sampled BV light curves of these stars can be supplemented with information about their metallicities (Rey et al. 2000). In this paper we use these data to calibrate different formulae which permit the calculation of absolute magnitudes of RR Lyr variables.
2 MV–[Fe/H] Relation
There is a lack of general consensus on the exact values of the α and β parameters. The most extreme values of the slope of relation (1) were given by (Sandage 1981a,b) with α= 0.35 and Fusi Pecci et al. (1996) with α= 0.13 ± 0.07. The estimates of the zero point of the relation vary from around 1.1 mag (Gould & Popowski 1998) to 0.8 mag (Gratton et al. 1997; Caloi, D'Antona & Mazzitelli 1997).
It is worth pointing out that some theoretical models predict that a simple linear relationship of form (1) may not exist at all. This is caused by the fact that even variables of the same metallicity have different luminosities depending on the direction of their evolution across the instability strip (Lee 1991). More complex relations between MV of RR Lyr stars and their metallicities were documented, for example, by Caputo (1997).
There is also observational evidence for a non-linear dependence of MV on [Fe/H]. For example, Caputo et al. (2000), analysing RR Lyr variables from Galactic globular clusters, obtained α= 0.17 ± 0.04 for [Fe/H] < −1.5 and α= 0.27 ± 0.06 for [Fe/H] > −1.5. The systematic errors caused by using the simple linear relation (1) may be minimized by excluding highly evolved RR Lyraes from the analysed samples. In particular, the formula should be used with caution when analysing variables belonging to globular clusters showing ‘blue’ horizontal branches.
Recent investigation of the MV–[Fe/H] relation in ω Cen was carried out by Rey et al. (2000). They used [Fe/H] metallicities derived from the hk index of the Caby photometric system. Their intensity averaged magnitudes of RR Lyr stars were taken from photographic photometry of Butler, Dickens & Epps (1978) and the CCD photometry of Kaluzny et al. (1997).
The new V-band light curves of RR Lyr variables in ω Cen obtained by the CASE (Kaluzny et al. 2003) have about three times as many observed points as the photometry of Kaluzny et al. (1997). This permits a more precise estimation of mean 〈V〉 magnitudes and allows the elimination of objects with unstable light curves from the calibration sample. Adopting an apparent distance modulus of the cluster as determined by Kaluzny et al. (2002) we can obtain a new MV–[Fe/H] relation for RR Lyr stars in ω Cen.
The sample used for the calibration includes 122 stars with stable light curves of good quality and metallicities determined by Rey et al. (2000). We decided to remove the RRab variable V52 from the further analysis. Its high luminosity suggests that it is a foreground star. Additionally, van Leeuwen et al. (2000) give only a 45 per cent membership probability for this variable, based on a proper motion study.
The MV–[Fe/H] dependence for the remaining 121 variables is shown in the upper panel of Fig. 1. The middle panel shows the same relation but for a subsample consisting of 67 RRab variables. The errors in [Fe/H] were taken directly from table 5 of Rey et al. (2000). For objects with unknown error of [Fe/H] we assumed it to be equal to 0.2 dex as suggested by Rey et al. (2000).
![The relation between MV and [Fe/H] for: (upper panel) the whole sample; (middle panel) subsample of RRab variables; (lowest panel) unevolved RRab variables. The solid lines are best linear fits.](https://oup.silverchair-cdn.com/oup/backfile/Content_public/Journal/mnras/345/1/10.1046/j.1365-8711.2003.06930.x/2/m_345-1-86-fig001.jpeg?Expires=1750309237&Signature=P8G67mr7D-eNr7vDp0sXpxgkgZTwZ5UGAIlZ~-CjtJuHIe825rdLQnWZ-8YvgCjZjVm4HZ7Llv6dL6asS53ttIU7t7jzqbhYwoClXjZ2DwUukRF51Hs3qs~hZqa-8fn41zvubz7~-FPkn8AV3l41In~BFuVxKQJwHZxTVwZG7pwS2fdIa9nF1RdtucEzYhPAe5yhNspE3waBUPRaM7pn58fSduyNAa62XXTPI98mV03HwomF8wLPbMbqbmmBNRc7c0BMu54-SRLj6RYsAcfeCPgQP45viMScNPtcfQppyn9SR~DLqOYAEUOFVf7NlxbLKeb0dcJj9NZ5sK8h7-VTBw__&Key-Pair-Id=APKAIE5G5CRDK6RD3PGA)
The relation between MV and [Fe/H] for: (upper panel) the whole sample; (middle panel) subsample of RRab variables; (lowest panel) unevolved RRab variables. The solid lines are best linear fits.
The intensity averaged magnitudes 〈V〉 obtained from light curves containing 500–800 points have internal errors smaller than 0.001 mag. We estimate that the external error of the zero point of the photometry is about 0.02 mag.
Transformation from 〈V〉 to MV is performed using the distance modulus whose error is 0.04 mag. Thus, combining this value with the 0.02 mag error resulting from computing the mean magnitudes 〈V〉, we assumed that individual absolute magnitudes of RR Lyr stars from our sample have uncertainties of 0.05 mag.


The values of α derived above may be biased by the presence of extremely evolved objects in our sample. The evolutionary models of Lee (1990) suggest that the RR Lyrae stars in clusters having a very blue horizontal branch and with a metallicity in the range of −2.0 < [ Fe/H ] < −1.6 are highly evolved stars. They have significantly brighter magnitudes and longer periods than those near the zero-age horizontal branch (ZAHB).
Rey et al. (2000) investigated this problem in ω Cen. Analysing the period–amplitude relations for different ranges of metallicities they discovered that a significant sample of evolved RR Lyr stars exists only for variables with −1.9 ≤ [ Fe/H ] < −1.5. Looking at their figure 9(b) we can clearly see that these evolved objects are also characterized by periods longer than 0.7 d.

Our results do not differ significantly from those presented by Rey et al. (2000), due to the good agreement of the zero points of the CASE photometry, as well as the CCD and photographic photometry used by Rey et al. (2000). The mean difference in V magnitude between both data sets consisting of 53 RRab stars is 〈VCASE−VRey〉= 0.007 ± 0.010 mag.
Having established the relation (4), we can use it for determining the distance modulus to the Large Magellanic Cloud (LMC) –μLMC. We used the data of Walker (1992), who summarized the CCD photometry of 182 RR Lyr variables belonging to seven LMC globular clusters. We decided to exclude from our analysis variables from the cluster NGC 1841 because it is most probably located about 0.3 mag closer than the main body of the LMC. The mean value of the reddening free magnitude 〈V0〉 of 160 RR Lyr stars from the remaining six clusters is 18.98 ± 0.03 mag. The mean metallicity of this sample is [Fe/H] =−1.9 ± 0.2.
Knowing the observed magnitude of RR Lyr stars from the LMC and computing their absolute magnitude using relation (4) we determined that the distance modulus to the LMC is equal to μLMC= 18.57 ± 0.20 mag. This result supports the ‘long’ distance scale.
Most recently, Clementini et al. (2003) presented new photometry and spectroscopy for more than a hundred RR Lyrae stars in two fields located close to the bar of the LMC. The dereddened apparent average luminosity of the variables from their sample was 〈V0〉= 19.064 ± 0.064 mag at the mean metal abundance of [Fe/H] =−1.48 ± 0.03. Their metallicity was tied to the Harris (1996) scale which differs by about 0.06 dex from the Zinn & West (1984) scale used by Rey et al. (2000). Thus, the mean metallicity of their sample is [Fe/H] =−1.54 ± 0.03 on the Zinn & West (1984) scale.
Application of equation (4) for their data gives the distance modulus to the LMC equal to μLMC= 18.55 ± 0.19 mag.
Combining the results of photometry obtained by both Walker (1992) and Clementini et al. (2003) we find that our MV–[Fe/H] relation gives μLMC= 18.56 ± 0.14 mag.
3 Absolute Magnitude of Rr Lyr Stars as a Function of the Fourier Parameters
3.1 RRab stars
3.1.1 Methods
On the one hand, non-linear pulsation models of RR Lyr stars suggested that the luminosity of these stars may be uniquely related to the pulsation period and the shape of their light curves (e.g. Simon & Clement 1993). This strongly suggests that there is a close correlation between the Fourier coefficients of the light curves and their corresponding periods and luminosities. Such correlations could potentially improve the distances derived for these stars.
 for predicting the RR Lyr absolute magnitude:
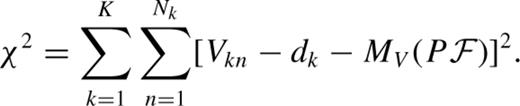


Note that the sine phase convention is used here unless otherwise stated. A worrying inconsistency is shown, for example, by the values of cP and cA1 in equations (7) and (8).
Several different causes might be responsible for these problems, as follows.
- (i)
The original problem connected to the sensitivity of high-order Fourier coefficients to poor data melted away with the abundance of high-quality observations; see, for example, Kaluzny et al. (1997), KW01 and the present work.
- (ii)
The more persistent problem is connected to the apparent inability of the procedure to account for the hidden diversity of properties related to metallicity, evolutionary status and possibly misidentified pulsation mode, all capable of producing several different trends in the data. This problem is acknowledged by rejecting outlying stars from the rest by the Dm distance criterion (see, for example, Kovács & Kanbur 1998). The risk is that the omitted stars hide much information on the nature of the physics involved.
- (iii)
One reason for widely different values of the coefficients obtained from the different data sets could be the strong correlation between the Fourier coefficients. Such fits could be sensitive to a group of coefficients while changing loads between individual members of the group matters little.
- (iv)
Finally, some evidence discussed further in this paper indicates that magnitudes of RRab stars might also depend on a factor, so far unaccounted for, independent of the period and shape of the light curve. We recommend future trials with colours sensitive to temperature and/or metallicity.
In order to clarify the situation and possibly to identify the cause of these problems we undertook the same kind of analysis from scratch and for an entirely new set of data. Our present sample consists of 76 RRab variables observed in ω Cen by Kaluzny et al. (1997, 2003). The photometry in these two papers is of very good quality and shows no systematic differences in the zero point (see Kaluzny et al. 2003, for details). Following the recommendations of Kovács & Kanbur (1998) for analysis we used only NωCen= 56 stars with Dm < 3. A clear advantage of our data is very consistent photometry obtained within the same project and using the same telescope. The vast majority of stars was observed at least 500 times, hence we obtained very precise and reliable values of the Fourier coefficients.
To minimize errors in the coefficients and their correlation we converted our projection into orthogonal trigonometric polynomials (Schwarzenberg-Czerny 1996; Schwarzenberg-Czerny & Kaluzny 1998). As all stars come from the same cluster we do not suffer from the distance indeterminacy and differential interstellar reddening because there are no systematic differences in E(B–V) in the field of ω Cen (Schlegel, Finkbeiner & Davis 1998). Additionally, because of the significant spread in metallicities within ω Cen, our sample is excellent for studying metallicity related intracluster differences unaffected by distance differences.
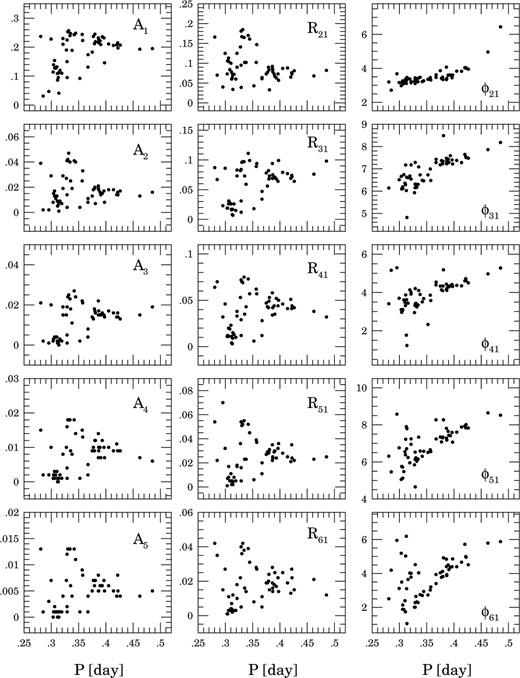
Fig. 2 shows the amplitudes Aj, amplitude ratios Rj1 and phase combinations φj1 as functions of the period P for all RRab variables from our sample. Comparing them with the same relations for the KW01 sample (see their figure 1) we conclude that our relations are significantly tighter and correlate very well with the period.
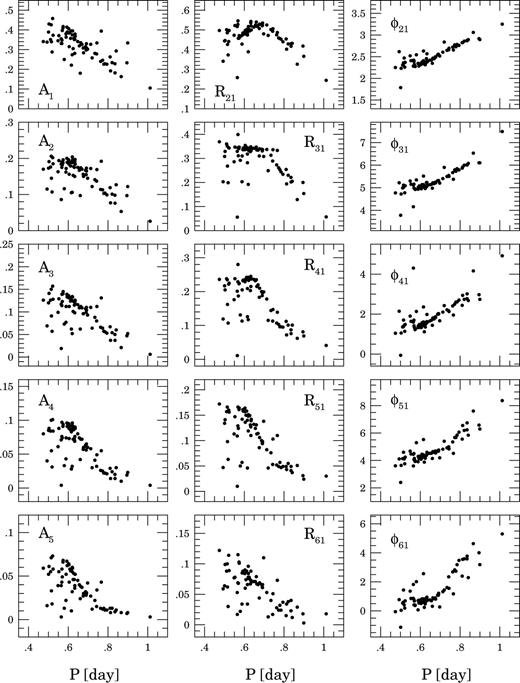
The amplitudes Aj, amplitude ratios Rj1 and phase combinations φj1 as a function of the period P for all RRab variables from our sample.
The interesting thing we noted is the clear change of the slope in the φ51–P and φ61–P relations occurring at P≈ 0.75 d. Arranging the RRab stars from ω Cen according to the increasing period, we can see that it is connected with a disappearance of the ‘bump’, clearly seen at phase around 0.7 in the light curves of variables with periods shorter than 0.75 d.
The basic properties of our sample of RRab stars from ω Cen are collected in Table 1.
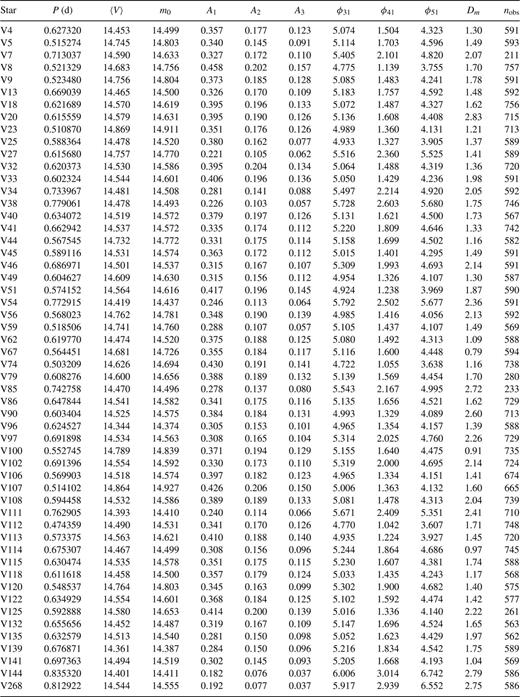
Basic parameters of RRab in ω Cen based on the photometry of Kaluzny et al. (1997, 2003).
3.1.2 Results for É Cen
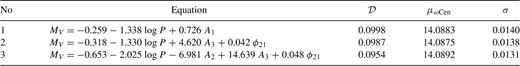
We performed several fits involving P and up to three different Fourier phase and amplitude coefficients drawn from the first five harmonics. To remove the constant term indeterminacy, we adopted as fixed the distance modulus μωCen= 14.09 ± 0.04 mag of Kaluzny et al. (2002). The results are listed in Table 2. We explicitly list the fitted formula and its standard deviation  . To test the numerical self-consistency of our fits we use each formula to recalculate μωCen and its standard deviation σ. These are also listed in Table 2. It is hardly surprising that
  . We shall refer to different fitted formulae by their consecutive numbers in the Table 2, from (F1) to (F11).

Formulae for MV of RRab stars with their  parameters and the resulting distance moduli to ω Cen with its standard deviations.
Inspection of Table 2 shows that no formulae involving only amplitudes (e.g. F1 and F5) are satisfactory. This is in marked contradiction to expectations from equations (8) and (9). It is particularly surprising as the latter formula performed best on the data from KW01. We observe a strong correlation effect of type (iii) in Section 3.1.1. In F1 and F5 only the amplitude coefficients vary while the rest remain remarkably stable, and the quality of the fit  is unaffected. In F5, contributions from A1 and A3 simply cancel out to the value in F1 for A1 alone. Most other fits involving both amplitude and phase appear satisfactory. It seems that the set of parameters originally selected by KJ96 performs quite well in our case, except that our coefficients in F3 are completely different from those in equation (7). Formally, our best fit is F6. However, the improvement of χ2 for F6 compared to that for F3 yields a Fisher–Snedecor test value of F(1, 52) = 7.85, only marginally significant at the level of 99 per cent. Looking at these values, we could say that F2, F3 and F6–F10 yield fits of similar quality and the inclusion of more parameters is hardly justifiable. It looks like the whole procedure is incapable of yielding better accuracy than these latter formulae.
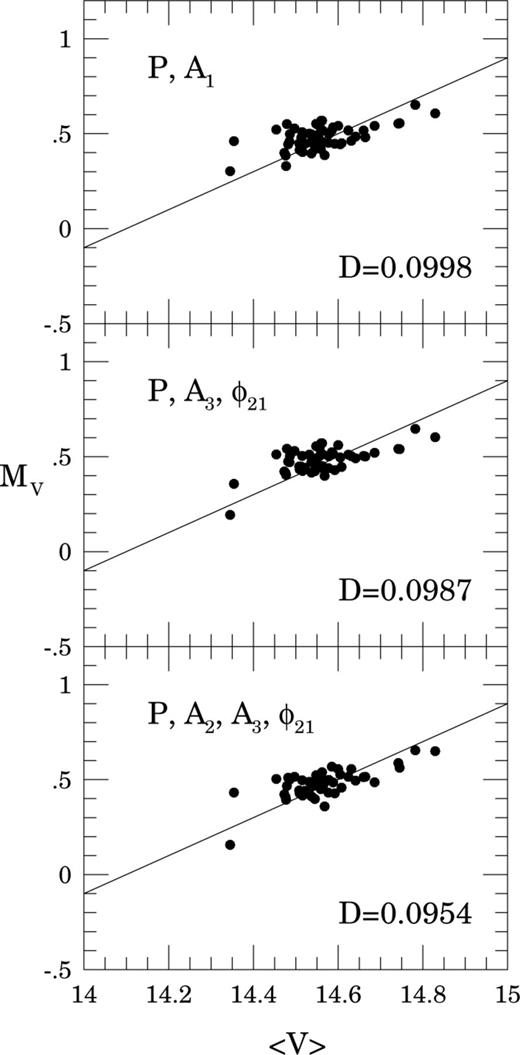
In order to reveal any remaining trend in the residuals from the fit in each panel of Fig. 3 we plot for all stars their absolute magnitude MV predicted by a given formula against average apparent magnitude 〈V〉. Dots correspond to the formulae from Table 2 and circles to equations (8)–(10) from KW01, the latter shifted by a constant. The lines mark ideal relations MV=〈V〉−μωCen. Inspection of Fig. 3 reveals that compared to equations (8)–(10) our formulae involving phase perform particularly well for brighter stars. The common feature in all panels is the markedly lower inclination of the trend in the points than the ideal relation. This is worrisome as apparently the fitted formulae are unable to reproduce the observed span of magnitudes. This effect is also present in similar attempts to predict magnitudes of cepheids using shapes of their light curves (Ligeza & Schwarzenberg-Czerny 2000). In our opinion, the presence of such an effect might indicate that some hidden factor (different from the period and shape of the light curve) significantly influences the average magnitudes of RRab stars (see point iv in Section 3.1.1).
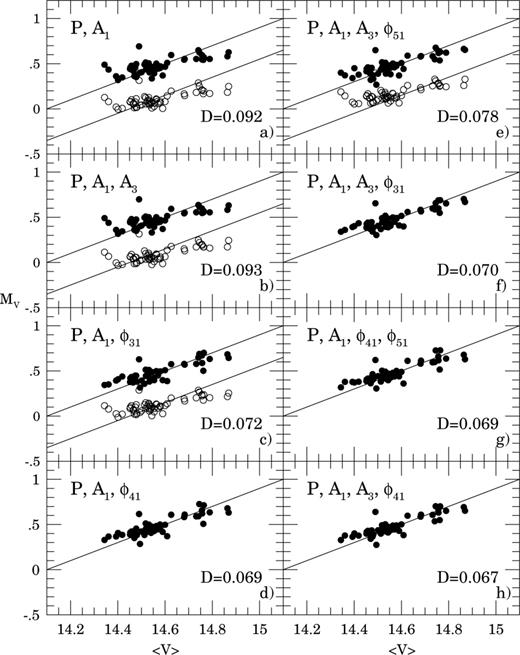
The MV–〈V〉 relations for the different formulae connecting the absolute magnitudes of RRab stars with their light-curve parameters. Solid lines in all panels have a slope of unity. Filled circles correspond to MV values computed from our formulae and open circles to the formulae of KW01. The MV values obtained from KW01 equations are shifted by 0.4 mag for clarity.
3.1.3 Application to LMC
To verify the usefulness of the formula F6 we decided to determine the distance modulus of the LMC. To do this we required high-quality photometry of RR Lyr variables from the LMC. The first source we verified was the photometry of RR Lyr variables in seven globular clusters placed in the LMC (Walker 1992). Unfortunately, these light curves contained only about 30 points, which is insufficient to obtain valuable information about high-order Fourier coefficients.
The photometry of 68 000 variable stars in the LMC was performed by the Optical Gravitational Lensing Experiment (OGLE) team and recently published by Zebruń et al. (2001). Unfortunately, due to the fact that OGLE searches for microlensing phenomena, the vast majority of their data is collected in the I band. Additionally, the exposure times are too short to produce very high-quality data on RR Lyr variables. The photometry described by Zebruń et al. (2001) was collected in 21 fields and for most of them the number of V-band frames was around 30–40. Only four fields, namely SC2, SC3, SC4 and SC5, were observed over 50 times in V and thus the light curves of RR Lyr stars located in these fields have photometry suitable for our tests.
The total number of RRab stars in the above-mentioned four fields of the LMC was 1428. Only 13 of them have light curves characterized by the parameter Dm < 3 and we used our F6 equation only for these. Such a large number of rejected stars cannot remain without discussion because it could suggest that our formulae are incapable of predicting the behaviour of LMC RRab stars. The OGLE observations of RR Lyr variables are only a by-product of a project designed for other purposes, thus the number of V filter observations, their exposure length and distribution are not optimal for measuring of such fine effects as the high harmonics and amplitudes of the light curves of RRab stars.
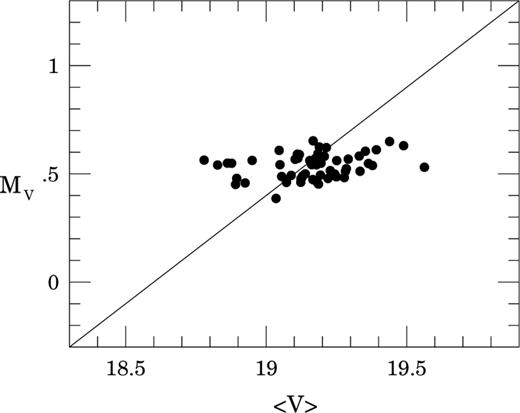
Leaving aside the problem of a large number of rejected stars, we proceeded to apply the remaining 13 stars to determine the LMC distance modulus. As we are concerned with the zero point only, the problems with the MV modelling and intrinsic scatter of stars pose less danger. The resulting MV–〈V〉 relation for these 13 variables is shown in Fig. 4. Again the solid line has a slope of unity. Averaging the differences between the observed and absolute magnitudes of the stars from this sample we obtain the value of the apparent distance modulus to the LMC as equal to 18.83 ± 0.04 mag, where the error is a standard deviation of the mean of 13 estimates.
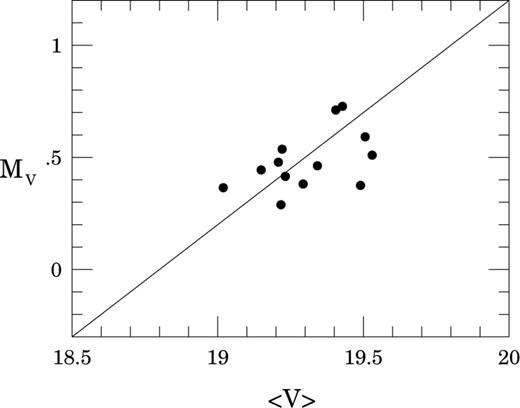
The MV–〈V〉 relation for the 13 OGLE RRab variables from the LMC. The solid line has a slope of unity.
In order to obtain the true distance modulus to the main body of the LMC, knowledge about interstellar reddening is needed. Due to the significant angular size of the LMC in the sky, the reddening varies depending on the position. However, the OGLE fields which we use are near the centre of the LMC and adopting the average value of E(B–V) taken from recent estimates of reddening should not introduce large systematic errors. As was shown, for example, by Alves et al. (2002), Fitzpatrick et al. (2002), Dutra et al. (2001) and Groenewegen & Salaris (2001) the interstellar reddening toward the LMC varies from 0.086 to 0.12 mag. Thus we simply assume that E(B–V) is equal to 0.10 ± 0.02 mag and our estimate of the true distance modulus to the LMC is μLMC= 18.51 mag. Taking into account the standard deviation of the mean value of our 13 estimates, the error in the absorption in the V band introduced by the error in E(B–V) and the error in calibrating the zero point from the relation F6 of our final estimate of the distance to the LMC is μLMC= 18.51 ± 0.07r± 0.04s mag.
3.2 RRc stars: near sinusoidal pulsators
3.2.1 Is the luminosityȁshape correlation real for RRc?

Our sample contains 54 RRc stars from ω Cen observed by Kaluzny et al. (1997, 2003) within the OGLE and CASE projects. For this sample we selected only stars free of any complications, such as period changes, multiple periods, or low-amplitude noisy light curves. For the RRc stars we followed the same procedure as for RRab. First, we determined their Fourier parameters and then proceeded to fit formulae akin to equation (5) by minimizing χ2. On the one hand, the quality of our photometry for RRc is as good as ever. On the other hand, the small amplitude and nearly sinusoidal light curve of RRc stars produced increased errors for high harmonics, so that above the sixth harmonic they exceeded 10 per cent of the value. The periods, magnitudes and Fourier parameters of the RRc stars from our sample are listed in Table 3. The amplitudes Aj, amplitudes ratios Rj1 and phase combinations φj1 in the function of the period P for all RRc variables from our sample are shown in Fig. 5.
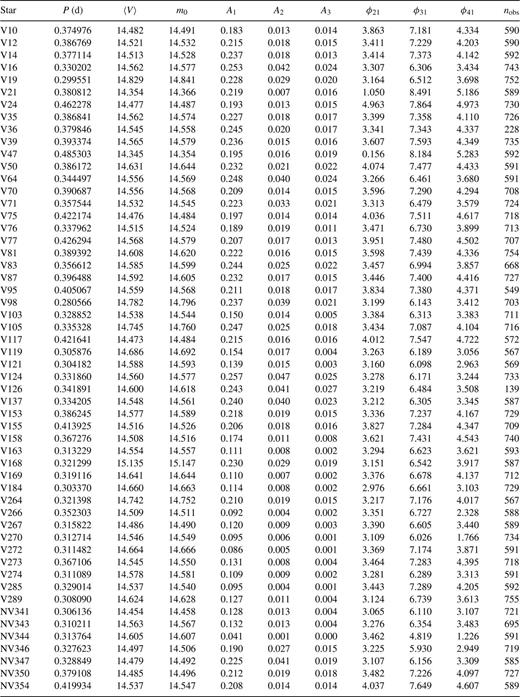
Basic parameters of RRc in ω Cen based on the photometry of Kaluzny et al. (1997, 2003).
The amplitudes Aj, amplitude ratios Rj1 and phase combinations φj1 as a function of the period P for all RRc variables from our sample.
 mag. In Table 4 we list a selection of the best formulae for each length category. It must be kept in mind that, according to the F test, none of these formulae performed significantly better than the rest, at 0.95 level. Note that the phase term present in formulae F2 and F3 does not vary by more than 0.1 mag. For all these reasons we recommend the use of the simplest F1 formula:
Formulae for MV of RRc stars with their  parameters and the resulting distance moduli to ? Cen with its standard deviations.
The corresponding MV–〈V〉 relations shown in Fig. 6 reveal that the predicted MV vary across fewer than half of the observed range. It is rather disturbing to note that all stars except for the three most outlying ones form a broad horizontal clump consistent with no correlation of MV with V. It is hard to imagine a more vivid demonstration that the observed luminosity and shape of the RRc light curve do not follow as tight a relation as the theoretical one (see point iv in Section 3.1.1).
The MV–〈V〉 relations for the different formulae connecting the absolute magnitudes of RRc stars with their light-curve parameters. Solid lines in all panels have a slope of unity.
3.2.2 RRc as standard candles in LMC
The question whether the shape of the RRc light curve is or is not correlated to the luminosity in principle does not exclude their use as standard candles. More problems in this respect stem from the large intrinsic scatter of their magnitudes, of the order of 0.1 mag. For the LMC Zebruń et al. (2001) list OGLE observations of 450 RRc stars from the fields SC2, SC3, SC4 and SC5. As these observations were only a by-product of a project designed for other purposes, the number of V filter observations, their exposure length and distribution are not optimal for measuring such fine effects as the third harmonic in the small amplitude, near sinusoidal light curves of RRc. For this practical reason we could not test the formula (equation 11) of Simon & Clement (1993) as none of the OGLE light curves yielded φ31 with the required accuracy of 0.2 rad.
Application of our formula (equation 12) for these data was straightforward, as finding the amplitude of the OGLE V light curves posed no difficulty at all. From the total sample of 450 RRc stars, we selected only 57 variables with sufficient amplitude A1 > 0.1 mag and errors not exceeding 0.010 mag. In Fig. 7 we plot MV computed from equation (12) against the observed average magnitude. In this respect we were reassured, in a perverse way, that the LMC RRc stars behave quite similarly to our stars from ω Cen; they both reveal little correlation of the predicted MV with its actual value. Such a situation calls for a repeated analysis of the type performed by KW01 for as large a sample of RRc stars from different globular clusters as possible, in order to check whether the formulae based on Fourier coefficients have any prediction value for MV. The impression of similar properties is further confirmed in the P–A1 diagram (Fig. 8) plotted for RRc stars from both ω Cen (full circles) and the LMC (open circles). Both samples occupy the same locations without showing any systematic differences. In our opinion, this particular similarity justifies the use of RRc stars as standard candles in these clusters.
The MV–〈V〉 relation for the 57 OGLE RRc variables from the LMC. The solid line has a slope of unity.
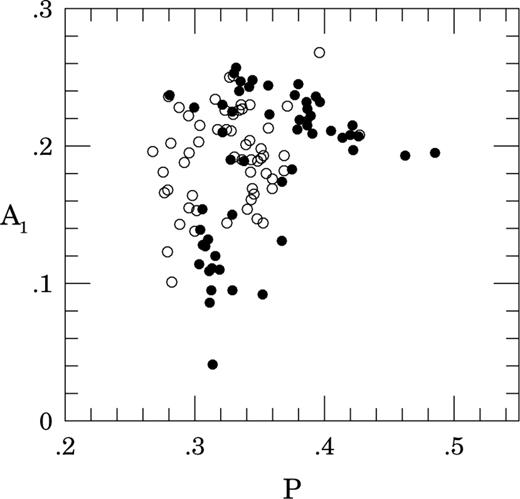
The A1–P relation for the 57 OGLE RRc variables from the LMC (open circles) and 55 CASE RRc variables from ω Cen.
4 Discussion
The V-band photometry of stars in ω Cen obtained by Kaluzny et al. (2003) contains three times as many observations and with higher precision than available so far. To understand what could be learned from such data, we attempted here to redo from scratch the analysis of the RR Lyr stars in this cluster. The results combined with the new metallicity determinations of Rey et al. (2000) and distance modulus to the cluster derived by Kaluzny et al. (2002), yield for RR Lyr stars a new MV–[Fe/H] relation independent of previous ones. For evolved stars, with P > 0.7 d the relation becomes non-linear. Rejecting them, we obtain a nearly linear relation with inclination consistent with previous results. Applying this relation to available observations of RR Lyr in the LMC we obtain its distance modulus μLMC= 18.56 ± 0.14 mag consistent with the ‘long’ distance scale.
Using the same V-band photometry we derive and calibrate the formulae connecting the absolute magnitude of RR Lyr stars of Bailey type ab with the Fourier parameters describing their light curves. This approach, closely following previous works, proved only partially successful in that the residuals from the fit remain large compared to the statistical errors of observations and in that the new formulae show little relation to those derived from older data. Employing our best-fitting formula calibrated with our distance modulus of ω Cen to the OGLE photometry of 13 RR Lyr stars from the LMC enabled us to obtain its distance modulus equal to μLMC= 18.51 ± 0.07r± 0.04s mag.
The agreement with the value obtained from the MV–[Fe/H] relation is very good, which on one hand is hardly surprising as both data sets overlap, yet on the other hand demonstrates the formal validity of our methods. Summarizing, we estimate the LMC distance modulus equal to μLMC= 18.52 ± 0.06r± 0.04s mag where the systematic error is determined by the error in the distance modulus of ω Cen (Kaluzny et al. 2002). The distance to the LMC is thus equal to 50.6 ± 1.6 kpc.
Our results for the RRc stars are less encouraging. Despite nearly sinusoidal light curves, our photometry proved to be accurate enough for analysing the harmonics; however, any fitted formulae employing Fourier coefficients yielded MV only loosely correlated with 〈V〉. On the theoretical side, this indicates the dependence of 〈V〉 on some additional factor yet to be identified. On the practical side, any estimated MV suffer from large random errors. A comparison with the RRc stars from the LMC observed by the OGLE team (Zebruń et al. 2001) proved difficult, because apart from the intrinsic errors of our formulae, the poorer sampling of data, obtained for other purposes, prevented an accurate evaluation of the harmonics.
An excellent review of the recent distance determinations to the LMC was given by Walker (1999). Here we point out only the discrepancy between so-called ‘short’ and ‘long’ distance scales. The former, based on the statistical parallax and the red clump methods, gives the distance modulus to the LMC as approximately 18.2–18.3 mag (Gould & Popowski 1998; Udalski 2000a,b). This is 0.2–0.3 mag smaller than the value of about 18.50 mag resulting from the cepheid period–luminosity relation and theoretical models of the horizontal branch or globular clusters main-sequence fitting.
However, recent improvements of the red clump method based on infrared photometry seem to indicate that this method also provides the distance modulus of the LMC at around 18.50 mag. For example, three papers based on the K-band photometry were recently published giving the distance modulus to the LMC as equal to 18.49 ± 0.04, 18.54 ± 0.10 and 18.501 ± 0.008r± 0.045s mag, respectively (Alves et al. 2002; Sarajedini et al. 2002; Pietrzyński & Gieren 2002).
Also, the newest determination of the cepheid period–luminosity relation, based on ∼600 stars, indicates that the distance to the LMC is around 18.50 mag (Sebo et al. 2002).
Our estimate is in excellent agreement with these recent results proving that our calibration of the absolute magnitudes of RR Lyr stars produces valuable results.
Acknowledgments
We would like to thank Igor Soszyński from the OGLE project for his valuable suggestions concerning the OGLE Catalogue of Variable Stars in the LMC, and Grzegorz Stachowski for reading the manuscript. This work was supported by the KBN grant number 2 P03D 024 22 to AO and 5 P03D 004 21 to JK.
References
