


Abstract
We present Washington System photometry for 11 star clusters immersed in the north-west part of the Large Magellanic Cloud (LMC) bar, centred on the intermediate-age clusters NGC 1865 and SL 244. The fields are heavily populated by the intermediate-age component of the LMC bar. We succeeded in disentangling cluster colour–magnitude diagrams from those of the fields and in deriving reddening and ages for five clusters — SL 218, BRHT4b, and NGC 1839, 1838 and 1863 – with the aid of recent Washington System theoretical isochrones. The resulting cluster ages range between 50 and 125 Myr. Despite their proximity, NGC 1836 and BRHT4b have very different ages. Thus the possibility of these two objects being a binary cluster is very unlikely, although a capture cannot be ruled out a priori. Our results suggest that for each intermediate-age cluster remaining in the LMC bar region, a number of robust young blue star clusters occurs in the same region.
1 Introduction
Star clusters in the Magellanic Clouds can help us to understand the star formation history of the galaxies as a whole (e.g. Mighell, Sarajedini & French 1998; Rich et al. 2000; Piatti et al. 2001; Piatti et al. 2002). However, the pronounced cluster age gap from ∼3 to 9 Gyr (e.g. Geisler et al. 1997) prevents us from using them to give us details concerning the chemical evolution and star formation history of the Large Magellanic Cloud (LMC) during this long period. The significant advantages of deriving accurate ages and metallicities for clusters as opposed to single stars (e.g. Olszewski et al. 1991; Bica et al. 1998) do allow them to play a leading role in investigations of the chemical evolution and cluster formation history during those epochs when clusters were formed. In particular, tracing the details of the recent burst(s) in cluster and star formation that occurred over the last few Gyr requires the measurement of ages and metallicities for a large number of clusters. Geisler et al. (1997) studied intermediate-age clusters (IACs) including those in the LMC bar region. The relatively large charge-coupled device (CCD) area allowed them to sample other star clusters in their fields. For fields well away from the bar, no serendipitous clusters were observed. However, in the bar regions, a number of additional clusters were observed, including both intermediate-age (∼1–3 Gyr, studied by Geisler et al. 2003), young (∼0.1–1 Gyr, studied by Piatti et al. 2003) and very young (<100 Myr) clusters. In particular, the analysis of these latter objects is the goal of the present study. The clusters were divided into these three separate age regimes because the techniques used to derive ages and metallicities for each group are different and because they explore different epochs in the chemical evolution history of the LMC.
The LMC bar is known to harbour a dense intermediate-age population (Hardy et al. 1984), and any attempt to study star cluster colour–magnitude diagrams (CMDs) immersed in such fields must necessarily take into account this important source of contamination. Bica, Clariá & Dottori (1992) derived age groups in terms of equivalent SWB types (Searle, Wilkinson & Bagnuolo 1980) from a sample of 129 star clusters in the LMC bar region. They also analysed their spatial distribution, discovering that, on the one hand, the eastern part of the bar had a powerful star-forming episode approximately 100 Myr ago, while on the other hand, the western part registers star cluster formation mostly after this event.
In the present study we employ the Washington System, initially developed for late-type stars and old stellar populations (Canterna 1976) and widely applied to intermediate-age and old clusters in the Galaxy and in the Magellanic Clouds (e.g. Geisler et al. 1997; Bica et al. 1998; Geisler & Sarajedini 1999). The long-wavelength baseline covered by the filters can also provide much insight for CMDs of young star clusters, especially since the recent development of Washington System isochrones (Lejeune & Schaerer 2001; Girardi et al. 2002) now allows us to quantify age determinations. Another result that the Washington System can provide from CMDs of young clusters is metallicity from their giants, allowing one to infer the metal enrichment of the related galaxy.
In recent years much effort has been dedicated to the study of intermediate-age star clusters throughout the Magellanic Clouds (e.g. Rich et al. 2000; Piatti et al. 2002). On the other hand, studies of blue Magellanic clusters have been limited mostly to luminous ones such as NGC 1866 (Testa et al. 1999). It is important to explore the numerous intermediate-luminosity blue star clusters in terms of CMDs in order to determine their characteristics, and in turn to have a broader view of the star formation history in the last 100 Myr in different parts of the Clouds. The present study is specific to blue clusters in the LMC bar-west region. The observation and reduction of these clusters followed the prescriptions detailed in Geisler et al. (1997) and Bica et al. (1998). Briefly, the data were obtained at the CTIO 0.9-m telescope in 1996 December during photometric conditions and were reduced with the daophot/allstar stand-alone packages (Stetson 1987).
In Section 2 we provide the CMDs. In Section 3 we derive cluster parameters. In Section 4 we discuss the results and in Section 5 we give a summary of this work.
2 Cluster Colour-Magnitude Diagrams
The serendipitous clusters observed in the fields of the intermediate-age clusters SL 244 and NGC 1865 are indicated in Table 1, where we give the various cluster designations from different catalogues, 2000 equatorial coordinates, Galactic coordinates and the reference field. At first glance, the CMDs of fields of a couple of arcmin on a side centred on the clusters show, as expected, a very significant contribution of different field star populations in addition to cluster fiducial sequences. This is because the objects are located towards the north-western edge of the LMC bar, where any relatively small area contains a significant number of field stars in comparison with the number of observed cluster stars, the angular sizes of which are of the order of 1 arcmin. To obtain cluster CMDs as clean as possible from the unavoidable field contamination, we built CMDs of stars distributed in different concentric rings around the cluster centres, and compared them with the aim of distinguishing cluster features from those of their surrounding fields. Given that the selected objects are in general embedded in crowded fields, the choice of reference cluster radii beyond which the contamination of field stars becomes important was not an easy task. Instead, we preferred to use four different circular extractions per cluster field, and to uncover the cluster fiducial sequences by comparing the extracted CMDs.
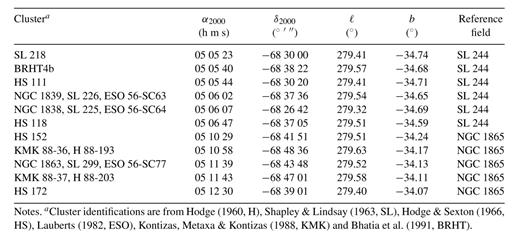
Object list.
Cluster centres were determined from the fit of Gaussian functions to the X and Y distributions of stars using the ngaussfit routine of the stsdas package. The projected stellar density profiles were obtained from counts of stars distributed along both X and Y coordinates within bands of 200 pixel wide across the clusters, in order to avoid relatively high background levels. In order to check whether cluster positions changed with the spatial resolution employed in the star counts, we used two different intervals of 5 and 10 pixel, respectively. No differences in the cluster central positions larger than 3 pixel were derived. However, more important sources of uncertainty in the placement of cluster centres were introduced by the ratio between the number of cluster and field stars, the sharpness of the cluster star density profile, and the intracluster fluctuations due to both cluster and field star density variations. Such is the case for the clusters HS 118, HS 152 and KMK 88-37, for which we could not reliably derive their centres since they were indistinguishable from the fluctuations in the respective field star density profiles. Deeper and higher-resolution images would be necessary to obtain a CMD for these objects that is sufficiently unaffected by field contamination and we do not discuss them further.
Figs 1(a) and (b) show the schematic finding charts for the selected fields with all the measured stars in the T1 band and the circles used to define the extracted CMDs. The sizes of the plotting symbols are proportional to the T1 brightness of the stars and the circles were drawn centred on the clusters using the derived cluster positions. We also used as a reference the full widths at half maximum (FWHMs) obtained from the fit of the Gaussian stellar density distributions to define different circular extractions. CMDs for the smallest circular extractions should reveal the main cluster features. Although some cluster features are not well revealed in the smallest circular extracted CMDs, they certainly minimize the contamination of field stars. A better definition of fiducial cluster sequences can be traced using CMDs with stars distributed in the adjacent circular extraction. Likewise, the transition from cluster CMDs to those dominated by field stars can be documented from a third CMD built with stars distributed in cluster haloes, where the presence of stellar field populations becomes predominant. Finally, the extracted CMDs of the outermost regions, represented by stars lying in general beyond 10 times the radii of the smallest circular extractions, constitute the best representations of the fields surrounding the clusters. The choice of the various radii for each cluster was an iterative, somewhat subjective process designed to obtain the best representation of the cluster and its transition to the field.


Schematic finding charts for the studied LMC cluster fields: (a) SL 218 (upper left), BRHT4b centred — NGC 1836 (upper right), HS 111 (bottom left) and NGC 1839 (bottom right); (b) NGC 1838 (upper left), KMK 88–36 (upper right), NGC 1863 (bottom left) and HS 172 (bottom right). Four circular extractions are shown, except for BRHT4b wherein only two extractions are presented due to its proximity to NGC 1836. North is up and east is to the left. The sizes of the plotting symbols are proportional to the T1 brightness of the star.
BRHT4b forms a visual pair with NGC 1836 (Bhatia et al. 1991). The measured angular separation between these two objects is 36 arcsec, substantially less than the maximum separation of 1.4 arcmin established in the selection criterion of binary clusters used by Dieball, Müller & Grebel (2002). Consequently, we only defined two circular extractions for BRHT4b given the proximity on the sky to NGC 1836, the CMD of which is remarkably different (Piatti et al. 2003).
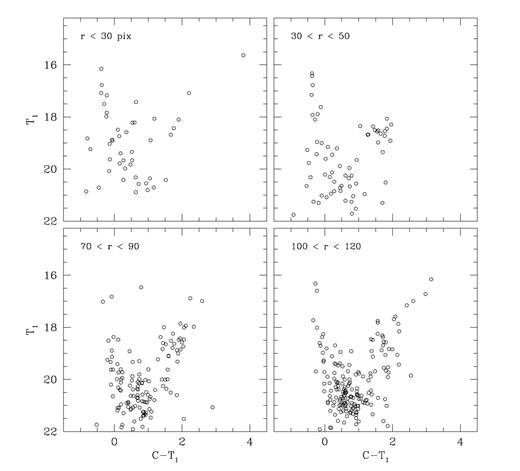
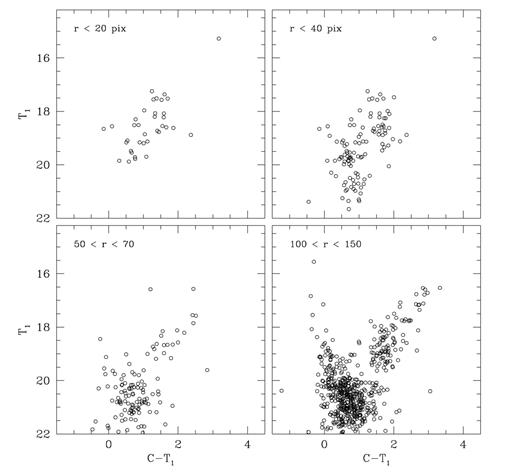
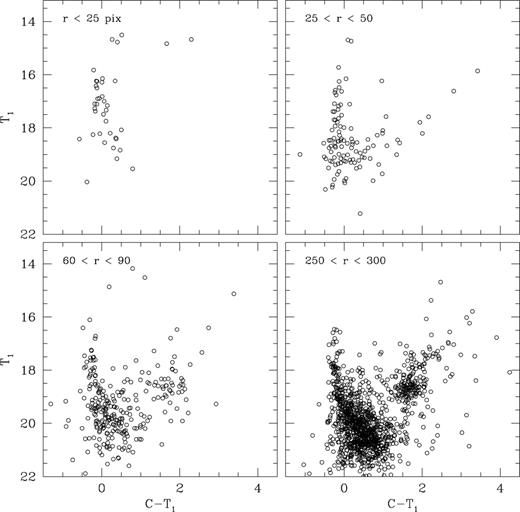
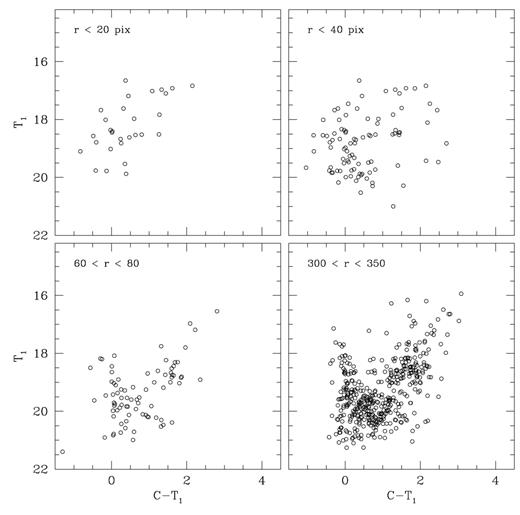
Using the extracted CMDs for each cluster, we analysed the different stellar components along the observed line of sight and the morphology of the sequences of the selected objects, and determined ages and metallicities for the confirmed star clusters. Figs 2–9 show the resulting extracted T1 versus C−T1 CMDs, wherein each panel indicates the extraction annulus in pixels. In the case of BRHT4b we included the 30 < r < 60 pixel CMD of NGC 1836 in the bottom right-hand panel of Fig. 3 for comparison purposes. Three main features summarize the overall appearance of these CMDs. First, the faintest magnitude limits of the innermost extracted CMDs are brighter than those for the adjacent extracted CMDs. This is because the wings of the light profiles of brighter stars in the nuclear cluster regions, where the increased crowding plays an important role, extend over fainter stars, covering or crossing their light profiles. Consequently, since daophot provides positions and magnitudes of stellar-shaped objects, many relatively faint stars in the central region of a cluster are not identified or are measured as too bright. The photometric quality, on the other hand, is more sensitive to blended stars, which produce a larger scatter in the fiducial cluster sequences.
Washington T1 versus C−T1 CMDs of stars in the field of SL 218. The extraction radius in pixels is given in each panel.
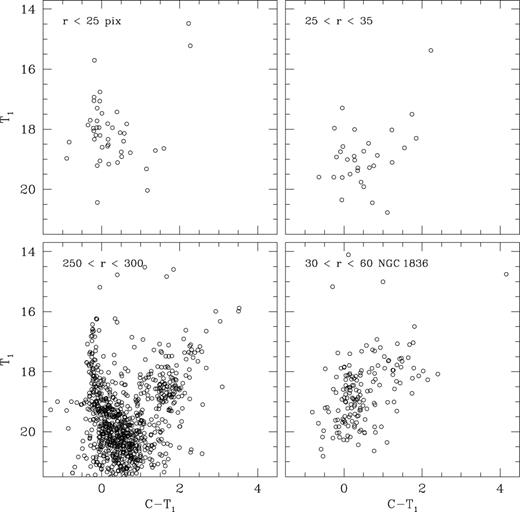
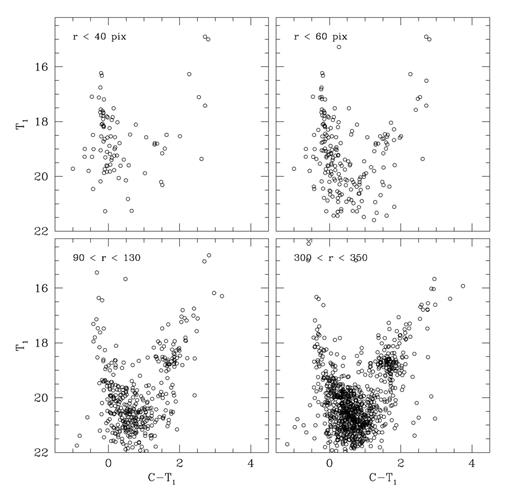
Washington T1 versus C−T1 CMDs of stars in the field of BRHT4b. The extraction radius in pixels is given in each panel. The CMD of NGC 1836 is also shown (bottom right-hand panel) for comparison purposes.
Washington T1 versus C−T1 CMDs of stars in the field of HS 111. The extraction radius in pixels is given in each panel.
Washington T1 versus C−T1 CMDs of stars in the field of NGC 1839. The extraction radius in pixels is given in each panel.
Washington T1 versus C−T1 CMDs of stars in the field of NGC 1838. The extraction radius in pixels is given in each panel.
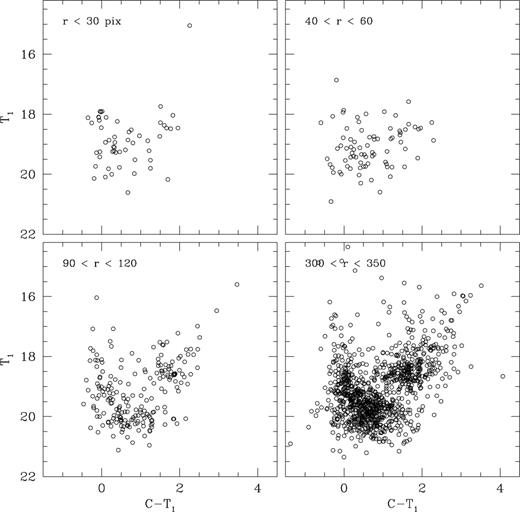
Washington T1 versus C−T1 CMDs of stars in the field of KMK 88–36. The extraction radius in pixels is given in each panel.
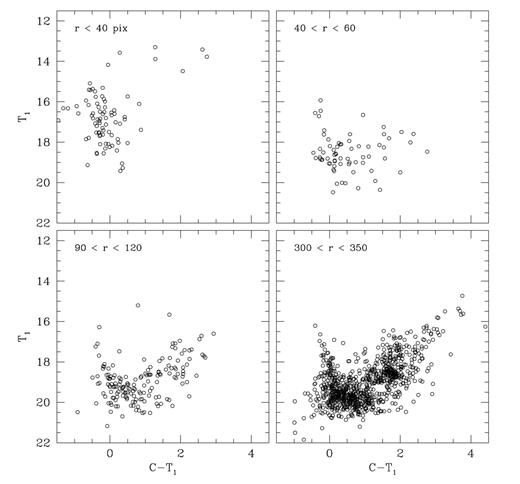
Washington T1 versus C−T1 CMDs of stars in the field of NGC 1863. The extraction radius in pixels is given in each panel.
Washington T1 versus C−T1 CMDs of stars in the field of HS 172. The extraction radius in pixels is given in each panel.
The second feature common to most of the cluster CMDs is the presence of relatively vertical main sequences (MSs), which demonstrate the youth of the selected objects. Cluster MSs in the innermost extracted CMDs extend from 2 up to 4 mag with an average of ≈3.5 mag and their slight curvatures appear to be typical of clusters with ages of a 100 Myr or younger. The smallest annular extracted CMDs of HS 111, KMK 88–36 and HS 172 do not show any MS, but a group of dispersed stars mainly distributed over the blue side of the diagrams. Fiducial cluster sequences do not clearly appear in their adjacent CMDs either and thus, although more or less evident concentrations of stars are visible in their fields (see Figs 1a and b), we preferred not to consider them in the subsequent analysis. For the remaining clusters we used the combination of the two innermost extracted CMDs for the purpose of deriving their fundamental parameters.
Finally, the third global property of the extracted CMDs refers to the stellar composition of the surrounding fields. The second extracted CMD of each field (upper right-hand panel in Figs 2–9), shows several red stars defining a red clump (RC) and/or a red giant branch (RGB). RCs are clearly visible, for example, in the second extracted CMDs of SL 218 and NGC 1838. In general, RCs and RGBs become more populated in so far as CMDs cover larger and more distant annular regions from the cluster centres. RCs are roughly placed at T1∼18.6. We estimated an age of ∼1–2 Gyr for the RC stars by adopting for the field the cluster reddenings and an LMC distance of (m−M)o= 18.50 (Alves et al. 2002; Pietrzynski & Gieren 2002; Sarajedini et al. 2002) and fitting Washington isochrones. The outer extracted CMDs also show the contribution of intermediate-age and old MS stars. Geisler et al. (2003) and Piatti et al. (2003) carried out a detailed analysis of the SL 244 and NGC 1865 surrounding fields and estimated their representative ages by measuring δT1, the difference in magnitude between the mean magnitude of the giant clump/horizontal branch and the MS turn-off (MSTO) (Geisler et al. 1997), as well as fitting isochrones, and obtained ages of 1.3 ± 0.2 and 0.9 ± 0.2 Gyr, respectively. The derived ages correspond to the MSs with the turn-offs (TOs) containing the largest number of stars, since field CMDs are composed of MSs of different stellar populations with a variety of ages.
3 Cluster Fundamental Parameters
Cluster reddening values were originally estimated by interpolating the extinction maps of Burstein & Heiles (1982, hereafter BH). BH maps were obtained from H i (21-cm) emission data for the southern sky and provide us with foreground E(B−V) colour excesses that depend on the Galactic coordinates. More recently, Schlegel, Finkbeiner & Davis's (1998, hereafter SFD) obtained full-sky maps from 100-μm dust emission. They found that in high-latitude regions, the dust map correlates well with maps of H i emission, but deviations are coherent in the sky and are especially conspicuous in regions of saturation of H i emission towards denser clouds and of formation of H2 in molecular clouds. Since the E(B−V)SFD values for our clusters are 5–10 times higher than the E(B−V)BH values for these inner bar clusters, we assumed the SFD values are saturated and used the latter values. Our clusters do not lie in any obvious dust patches, as shown on either our frames, the DSS or the Hodge Atlas. The Hodge Atlas does show a Henize emission object a few arcmin to the west of SL 244, which may account for the high SFD values.
For the cluster sample we derived a constant interpolated E(B−V)BH value of 0.06, which is in excellent agreement with the LMC surrounding average spectroscopic reddening [E(B−V) = 0.06 ± 0.03] obtained by Dutra et al. (2001). They analysed integrated spectra of nuclear regions of galaxies located behind the Magellanic Clouds to probe reddening in those lines of sight. They also found that the derived reddening value also coincides with those interpolated from the SFD maps for outermost LMC regions. However, for the LMC main body, the average spectroscopic reddening obtained by them is E(B−V) = 0.12 ± 0.10 or 0.15 ± 0.11, which provides the most accurate reddening determinations since only red population galaxies are considered. This fact suggests an internal reddening for the LMC main body of E(B−V)int= 0.09 ± 0.03. For this reason, we applied an offset of +0.09 mag to our reddening value, in order to take into account the internal LMC reddening in these inner bar regions. Thus, we adopted a constant reddening of E(B−V) = 0.15 mag for the cluster sample.
As a check on our reddening determination, we adjusted the zero-age main-sequence (ZAMS) computed by Lejeune & Schaerer (2001) to the cluster CMDs, using the adopted LMC true distance modulus [(m−M)o= 18.50, Alves et al. 2002; Pietrzynski & Gieren 2002; Sarajedini et al. 2002] and shifting it redwards until it matched the unevolved cluster MSs. We found that an E(B−V) colour excess of 0.15 ± 0.05 satisfactorily fits the unevolved cluster MSs, in good agreement with the adopted reddening.
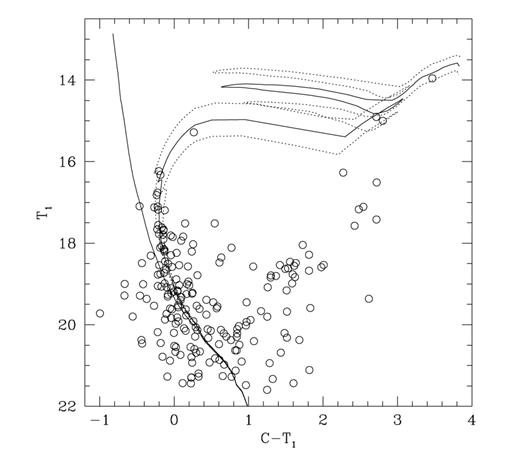
Recently, Lejeune & Schaerer (2001) calculated theoretical isochrones using an updated version of the empirically and semi-empirically calibrated basel library of synthetic spectra (Lejeune, Cuisinier & Buser 1997, 1998; Westera, Lejeune & Buser 1999) for different photometric systems, among them the Washington photometric system. The excellent separation in metallicity offered by the C−T1 colour, from the MS up to red giant phases, makes these isochrones a very competitive tool when comparing them with theoretical isochrones in the extensively used UBVRI system. Girardi et al. (2002) have more recently provided tables of theoretical isochrones for the Washington system, derived from applying a rewritten formalism to convert synthetic stellar spectra into tables of bolometric corrections. We did not note any substantial difference between these sets of isochrones for ages in the range of our cluster sample. Thus, for the sake of uniformity with previous studies (Piatti et al. 2002; Geisler et al. 2003), we used the isochrones of Lejeune & Schaerer computed taking into account overshooting effects. We then superimposed different isochrones on the cluster CMDs, which were previously shifted by the E(B−V) colour excess and the LMC true distance modulus. Then, we determined cluster ages from the interpolation between the isochrones that best matched the fiducial cluster sequences. Figs 10–14 present the results of the fits. Each shows the ZAMS and the isochrone, the MS curvature of which best resembles the envelope of cluster MSs and evolved features (solid lines); two additional isochrones (dotted lines) illustrate the cluster age estimation procedure and accuracy. Since age variations became negligible for isochrones with different metallicity values (Z= 0.004, 0.008 and 0.02), we adopted a constant cluster metallicity given by the most common value for the present-day LMC metal content, i.e. [Fe/H]=−0.4 (Olszewski et al. 1991).
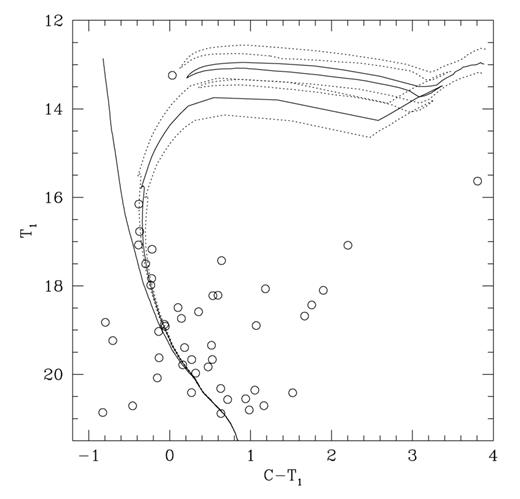
Washington T1 versus C−T1 CMDs for SL 218 stars. The ZAMS and the isochrone for log t= 7.7 from Lejeune & Schaerer (2001), computed taking into account overshooting, are overplotted with solid lines, while those for log t= 7.6 and 7.8 are drawn with dashed lines.
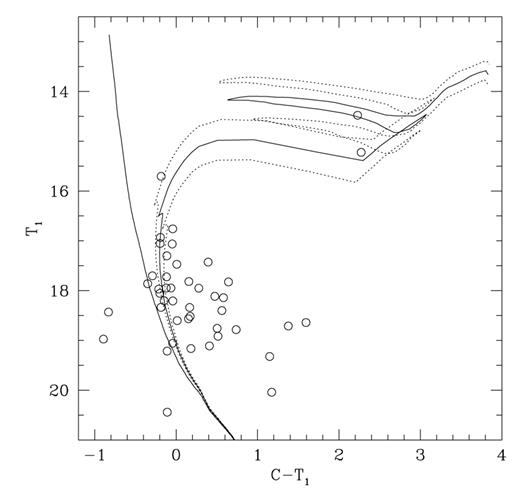
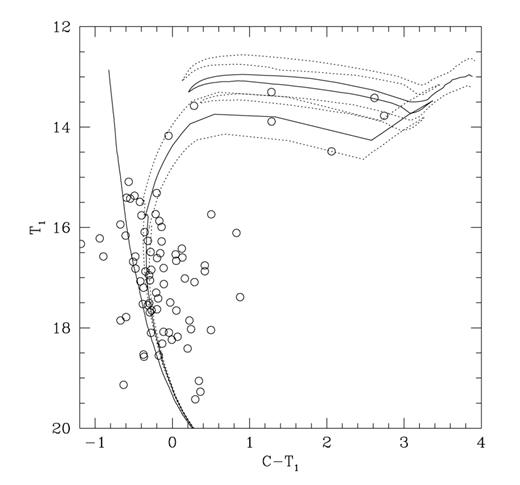
Washington T1 versus C−T1 CMDs for BRHT4b stars. The ZAMS and the isochrone for log t= 8.0 from Lejeune & Schaerer (2001), computed taking into account overshooting, are overplotted with solid lines, while those for log t= 7.9 and 8.1 are drawn as dashed lines.
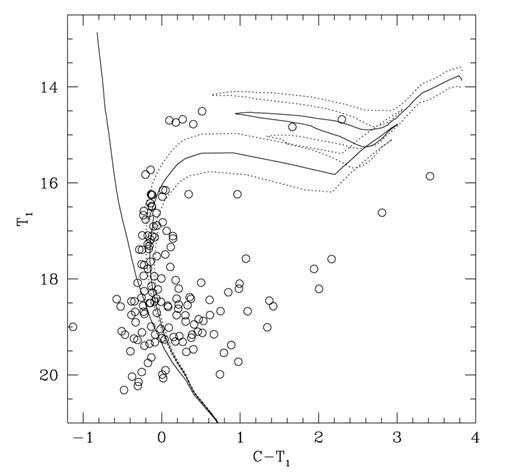
Washington T1 versus C−T1 CMDs for NGC 1839 stars. The ZAMS and the isochrone for log t= 8.1 from Lejeune & Schaerer (2001), computed taking into account overshooting, are overplotted with solid lines, while those for log t= 8.0 and 8.2 are drawn as dashed lines.
Washington T1 versus C−T1 CMDs for NGC 1838 stars. The ZAMS and the isochrone for log t= 8.0 from Lejeune & Schaerer (2001), computed taking into account overshooting, are overplotted as solid lines, while those for log t= 7.9 and 8.1 are drawn as dashed lines.
Washington T1 versus C−T1 CMDs for NGC 1863 stars. The ZAMS and the isochrone for log t= 7.6 from Lejeune & Schaerer (2001), computed taking into account overshooting, are overplotted as solid lines, while those for log t= 7.7 and 7.8 are drawn as dashed lines.
The isochrones for the adopted cluster ages reproduce very well not only the upper cluster MSs and the positions of the observed turn-offs, but also the loci of cluster stars in the subsequent evolutionary stages. For example, the brightest star (T1≈ 13.2, C−T1≈ 0.0) in the CMD of SL 218 appears to be a blue supergiant star. It lies at the T1 mag corresponding to the theoretical CNO burning stage and is located in the innermost extracted CMD (see Fig. 1), where massive cluster stars are expected to be found. For this cluster we derived an age of t= 50 ± 10 Myr, with the error being estimated from the age difference of the plotted dotted isochrones. SL 218 is projected at 82 arcsec or 19 pc to the north-west of HS 111 (Fig. 1a). These clusters do not appear to form a binary system, as judged from the fact that HS 111 does not show a relatively bright and vertical MS as in the CMD SL 218, and assuming that most true binary clusters should have formed together (Dieball & Grebel 2000). Dieball & Grebel (2000) estimated the cluster encounter rate and suggested that tidal capture is an unlikely formation scenario for the formation of binary clusters. Accordingly, we conclude that SL 218 and HS 111 do not form a physical pair.
The derived ages for BHRT 4b and NGC 1839, 1838 and 1863 turn out to be (100 ± 25), (125 ± 25), (100 ± 25) and (50 ± 10) Myr, respectively. Among them, NGC 1839 and 1863 both have the largest number of supergiant stars as well (Figs 12 and 14). Note that the isochrone fitted to the NGC 1839 CMD misses the bright clump of supergiant stars. In general, these age determinations from isochrone fitting could be affected by a number of factors, including field contamination, differential reddening, underpopulated clusters and/or photometric errors. Since the isochrones of the adopted cluster ages satisfactorily reproduce all the cluster features, we conclude that none of these factors plays an important role in the estimation of the ages of the selected clusters. In this respect, the colour width of the MSs is smaller than the lower limit estimated by Burki (1975) for clusters with differential reddening, Δ(B−V) = 0.11, which corresponds to Δ(C−T1) = 0.22 adopting a value of 1.97 for the E(C−T1)/E(B−V) ratio (Geisler & Sarajedini 1999).
4 Discussion
A variety of recent studies have dedicated efforts to enlarge and improve the sample of well-studied LMC star clusters with the aim of delineating the significant gap in their age distribution and searching for more clusters that might lie within it (e.g. Geisler et al. 1997). Most of the recently studied star clusters turned out to be intermediate-age clusters (ages ∼1–3 Gyr) distributed throughout the LMC disc (Geisler et al. 1997; Bica et al. 1998; Piatti et al. 2002; Geisler et al. 2003). The properties of the surrounding fields of these clusters, which strictly speaking represent the most populated LMC field star component, are within the age and metallicity ranges typical of IACs. Thus, we concluded that clusters and surrounding fields in the LMC disc have similar properties. The resulting picture of the cluster-surrounding field relationship is also applicable to the clusters SL 244 and NGC 1865, projected towards the north-western edge of the LMC bar. However, in contrast to outer disc clusters, which are frequently seen alone within our field size of 13.4 arcmin on a side, we found several clusters in the same field of view in the inner LMC disc. In particular, we observed six and five additional clusters in the fields of SL 244 and NGC 1865, respectively (see Table 1). This result agrees with the conclusion reached by Bica et al. (1999) in the sense that the angular distribution of star clusters clearly shows the LMC bar in the central region, which is not the case in the angular distribution of associations. They arrived at this conclusion from a census of 6659 objects including star clusters, emission-free associations, and objects related to emission nebulae. Of course, this comparison does not address the effects of cluster disruption. The additional clusters are all affected by the same amount of interstellar reddening.
Visual pairs amongst the studied clusters do not appear to form binary systems, although Dieball & Grebel (2000) claim that binary clusters account for more than 10 per cent of the cluster population in the Magellanic Clouds and that, statistically, fewer than 50 per cent of the visual pairs are expected to be chance superpositions. NGC 1836 and BRHT4b are separated in the sky by 36 arcsec, which is clearly closer than the maximum separation of 1.4 arcmin adopted as a selection criterion in the new catalogue of all binary and multiple cluster candidates found by Dieball et al. (2002). They showed, based on the Bica et al. (1999) catalogue, that between 56 per cent (bar region) and 12 per cent (outer LMC) of the detected pairs can be explained statistically. Since the ages of NGC 1836 and BRHT4b are remarkably different (Δt= 300 Myr, this paper and Piatti et al. 2003), it is unlikely that these two clusters formed in the same giant molecular cloud. Dieball & Grebel (2000) arrived at the same conclusion for the close pair SL 385 and SL 387, for which they estimated a projected distance between clusters of 45.6 arcsec and an age difference of Δt≥ 80 Myr. Thus, the proximity of NGC 1836 and BRHT4b, located in the north-western edge of the densely populated bar region, is most probably a projection effect (Dieball et al. 2002), although a capture cannot be ruled out a priori. Detailed surface photometry analyses are necessary to further infer whether one is dealing with projection effects or capture (de Oliveira et al. 2000). Therefore, we assumed that the studied additional clusters are spread along the whole LMC inner disc thickness. It is very unlikely that they are all located in front of or behind the LMC disc.
Summarizing, in the outer LMC disc, star clusters and their surrounding fields appear to share similar properties, while in the inner disc this scenario is only fulfilled for some clusters, generally IACs, since several other young star clusters are also found in those fields. In this respect, it appears more reasonable to speculate that young clusters observed in inner intermediate-age fields were formed in situ rather than in the outer disc and appear in such fields as a consequence of their orbital motions.
5 Summary
The present work represents the continuation of a series of studies of star clusters of the LMC, which we have been involved with since 1997. In this contribution, we present CMDs in the Washington System for five relatively young star clusters that lie in the north-western part of the LMC bar; namely SL 218, BRHT4b, and NGC 1839, 1838 and 1863. These young clusters were all observed serendipitously because they lay within the same CCD field as some intermediate-age clusters observed by Geisler et al. (1997). As far as we are aware, no previous efforts to investigate their ages and/or metallicities have been published. We defined circular extractions in the selected fields and built extracted CMDs with the goal of defining the fiducial cluster sequences as accurately as possible. The extracted CMDs of the outermost regions, composed of stars predominantly lying beyond 10 times the radii of the smallest circular extractions, constitute the best representations of the fields surrounding the clusters. Using the various extracted CMDs, we analysed the different stellar components along the observed line of sight and the morphology of the sequences of the above five clusters. Their ages were determined from interpolation between the theoretical isochrones that best matched the fiducial cluster sequences in their T1 versus C−T1 CMDs. At the same time, the metallicities for these clusters were derived from the interpolated Z-value of the isochrone where the MS curvature and colour best resembled the envelope of the cluster MS. The resulting ages lie between 50 and 125 Myr, a fact which corroborates that these clusters are considerably younger than the primary intermediate-age clusters and the great majority of the surrounding field stars. Two of the clusters (NGC 1836 and BRHT4b), although lying close together on the sky, have very different ages and therefore are unlikely to be a binary cluster, although a capture cannot be ruled out a priori.
Acknowledgments
We thank the CTIO staff for their hospitality and assistance during the observations. We also thank an anonymous referee for his/her valuable comments. This work was partially supported by the Brazilian institutions CNPq and FINEP, and the Argentinian institutions CONICET and SECYT (Universidad Nacional de Córdoba), Agencia Córdoba Ciencia and Agencia Nacional de Promoción Científica y Tecnológica. This work is based on observations made at Cerro Tololo Inter-American Observatoy, which is operated by AURA, Inc, under cooperative agreement with the NSF. DG gratefully acknowledges support from the Chilean Centro de Astrofísica FONDAP no 15010003.
