


Abstract
We present observations of the proposed double-degenerate polar RX J1914+24. Our optical and infrared spectra show no emission lines. This, coupled with the lack of significant levels of polarization, provides difficulties for a double-degenerate polar interpretation. Although we still regard the double-degenerate polar model as feasible, we have explored alternative scenarios for RX J1914+24. These include a double-degenerate Algol system, a neutron star–white dwarf pair and an electrically powered system. The latter model is particularly attractive since it accounts naturally for the lack of both emission lines and detectable polarization in RX J1914+24. The observed X-ray luminosity is consistent with the predicted power output. If true, then RX J1914+24 would be the first known stellar binary system radiating largely by electrical energy.
1 Introduction
RX J1914+24 was discovered during the course of the ROSAT all-sky survey and was found to show a modulation in X-rays with a period of 9.5 min (Motch et al. 1996). In further observations, Cropper et al. (1998) detected only the 9.5-min period that they suggested was the binary orbital period. This implied a very small binary dimension. This together with the X-ray light curve, which was consistent with zero for half the 9.5-min period, led them to propose that the system is a polar [those magnetic cataclysmic variables (mCVs) in which the accreting white dwarf has a magnetic field strong enough to synchronize its spin period with the binary orbital period]. This would imply that the 9.5-min period seen in X-rays was both the spin period of the accreting white dwarf and also the binary orbital period. For an orbital period this short the secondary star could not be a main-sequence star as in the case of ordinary mCVs. It could, however, be a He white dwarf. If confirmed, RX J1914+24 would be the first binary system in which both components are white dwarfs and magnetically synchronized – a double-degenerate polar. Furthermore, its orbital period would be the shortest of any known stellar binary system.
Observations by Ramsay et al. (2000) gave supporting evidence for the double-degenerate polar interpretation. These include: discovery of the optical counterpart (in the I band) in which only one period was seen (the 9.5-min period seen in X-rays); no periods other than the 9.5-min period in further X-ray data; an X-ray spectrum, which is very soft and typical of polars; large variations in its long-term X-ray light curve, which is typical of polars, and infrared colours that are not consistent with that of a main-sequence star. Ramsay et al. (2000) also found that the peak intensities in the X-ray and I-band light curves were approximately antiphased. They interpreted the X-ray flux as originating from the accretion region on the white dwarf, while the I-band flux originated from the irradiated face of the mass-donating white dwarf. This was consistent with the observation that the I-band flux was not polarized.
In this paper we present further observations of RX J1914+24. We discuss these results in relation to the double-degenerate polar model of Cropper et al. (1998) and Ramsay et al. (2000). We also consider several alternative models for RX J1914+24.
2 Optical/Infrared imaging
2.1 J-band imaging using Subaru
RX J1914+24 was observed on 1999 June 6 in the J band using the 8-m Subaru telescope on Hawaii and the Cooled Infrared Spectrograph and Camera (CISCO) in its imaging mode. Each exposure was 5 s in duration, and after every 12 exposures an offset was applied to the telescope so that a flat-field could be obtained. The observation lasted ∼1 h. Conditions were good and the seeing was ∼0.4 arcsec. An image using all the frames (each frame was shifted in position so that the stellar images were coincident) is shown in Fig. 1.
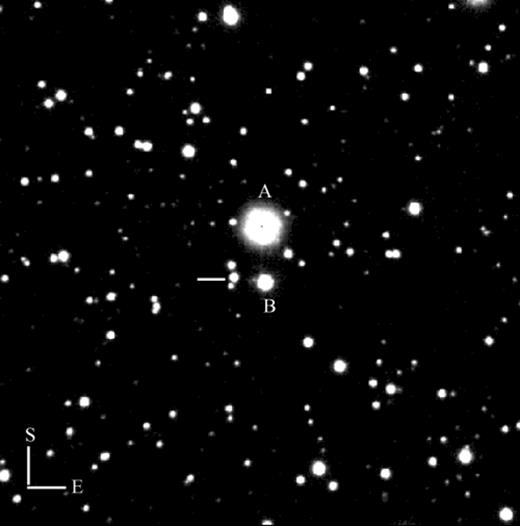
A 60-min J-band image of the field of RX J1914+24 taken using the 8-m Subaru telescope on Hawaii. Stars A and B are shown in the images of Motch et al. (1996) and Ramsay et al. (2000) and are separated by 7 arcsec. Star A has V∼15.5 (from data obtained at the NOT) and J∼12.1 (from UKIRT data, Ramsay et al. 2000) and was saturated in each 5-s exposure. The optical counterpart of RX J1914+24 is shown by the white marker.
To make an accurate determination of the position of the optical counterpart of RX J1914+24, we matched the positions of stars in the Subaru image with those in the digitized sky survey. The accurate positions of these stars were then taken from the USNO A1.0 catalogue. We determined the position of RX J1914+24 using the astrometry package astrom (Wallace 1998): α2000=19h 14m 26.1s,δ2000=+24° 56′ 43.6″. The uncertainty in this position is 0.4 arcsec. It is consistent with the X-ray position reported by Cropper et al. (1998).
Aperture photometry was performed on the images using photom (Eaton, Draper & Allan 1999). Differential photometry was obtained using various comparison stars in the field. Fig. 2 shows the differential light curve of the optical counterpart to RX J1914+24 binned and folded on the ephemeris of Ramsay et al. (2000). [The ephemeris of Ramsay et al. (2000) is sufficiently precise to phase the Subaru data with the original X-ray and I data to within 0.02 cycles.] The shape and phasing of the light curve is similar to that of the I-band light curve shown in Ramsay et al. (2000) (and also shown here for comparison), although the rise to maximum is less rapid. The amplitude is greater in J (0.16 mag peak-to-peak) compared with I (0.07 mag). By comparison, the J-band data obtained using UKIRT (Ramsay et al. 2000) was of too low signal-to-noise ratio for a significant modulation to be apparent.
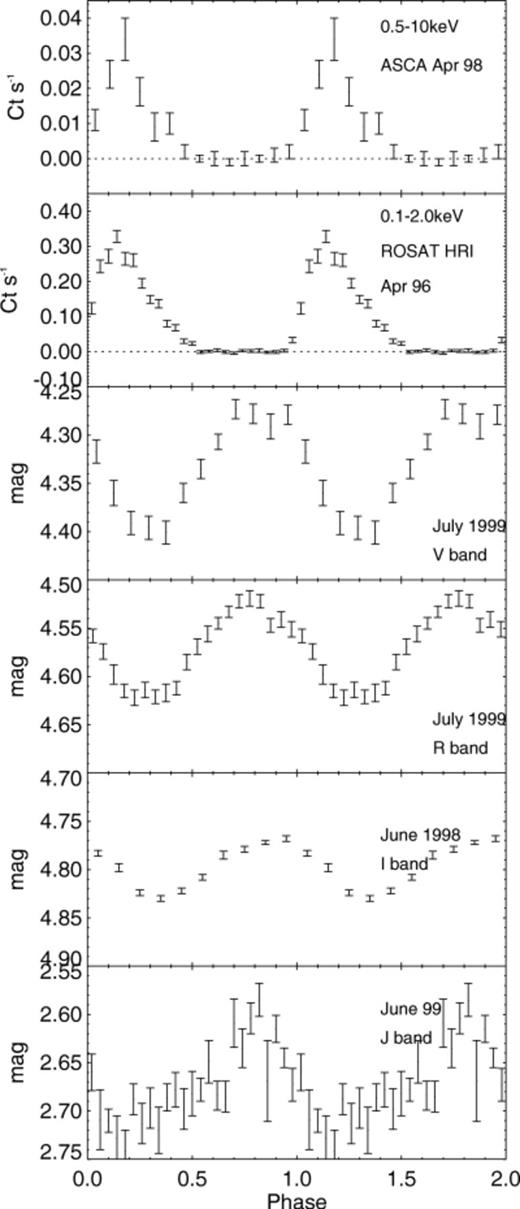
The light curve of RX J1914+24 as a function of energy folded on the 9.5-min period.
2.2 BV RI imaging using NOT
Observations were obtained on the nights 1999 July 6–8 using the 2.5-m Nordic Optical Telescope (NOT) on La Palma, and the Andalucia Faint Object Spectrograph (ALFOSC) was used in its imaging mode. The conditions were photometric on the first two nights. The seeing was typically 1 arcsec. To obtain circular polarimetry data a quarter-wave plate was inserted into the optical path: this split the light into both polarized beams on the Loral 2k×2k charge-coupled device (CCD) so that two images of each star were recorded. The instrument was orientated in such a way that images of field stars did not overlap with any of the stars of interest. The images were bias-subtracted and flat-fielded in the usual way. On the first night images were mainly taken in the R band (20-s exposures) and the second night the V band (40-s exposures). The CCD was windowed to reduce the readout time.
In addition to the extended sequence of V- and R-band images, we also made a sequence of B, V, R and I images and a standard star at the beginning of each night. This allowed us to deduce magnitudes for RX J1914+24 across the broad optical/infrared band – see Table 1. In the I-band RX J1914+24 was found to be ∼4.8-mag fainter than star ‘A’, i.e. the same as it was when observed in 1998 June (Ramsay et al. 2000).
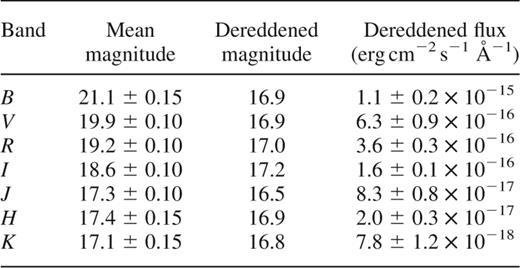
The apparent and dereddened magnitudes and fluxes of RX J1914+24 assuming an extinction of AV=3.0 mag. The B, V, R, I estimates were made in 1999 July, while the J, H, K magnitudes were made in 1998 July (when the I magnitude was within 0.1 mag of that in 1999 July). The error on the mean magnitudes includes the error in placing them on to the standard system. The error on the dereddened flux does not include the uncertainty on the interstellar extinction.
Profile fitting photometry was carried out on stars in the field using daophot (Stetson 1992). Since the profiles of the two polarized beams were different, two point spread functions had to be constructed We show the V- and R-band differential light curves (using one of the polarized beams) of the optical counterpart of RX J1914+24 folded and binned on the ephemeris of Ramsay et al. (2000) in Fig. 2. Both light curves resemble those in the I and J bands with their peak intensities occurring ∼0.3–0.4 cycles before the maximum in X-rays. The peak-to-peak amplitude is greatest in V: 0.13 mag in V, 0.10 mag in R and 0.07 mag in I.
We note the presence of a dip at φ∼0.85 that is seen in the V, R and J bands. (The time resolution of the I-band data is poorer than the other bands, which probably prevents us from detecting it in this band.) We would not regard this dip as significant if it were observed in only one band, but its presence in three bands (taken at different epochs) suggests that it is indeed significant.
The presence of a quarter-wave plate and calcite block in the optical path allowed us to search for circular polarization in RX J1914+24. The instrumental polarization was found to depend on the position of the stellar image on the CCD. To make a first-order correction for instrumental polarization we made the assumption that star ‘A’ has no intrinsic circular polarization (cf. Fig. 1). We applied this correction to the polarized light curves of star ‘B’ and RX J1914+24 and then folded them on the ephemeris of Ramsay et al. (2000). No significant polarization was found in RX J1914+24 in either the V or R bands. To test that the instrument could detect polarization, observations of the polar QQ Vul were made at the end of the first and second nights. It was found that significant circular polarization was detected, with the same polarity and a similar degree of polarization to that detected in the observations of Cropper (1998).
3 Spectroscopy
3.1 The optical spectrum
Central to their double-degenerate polar interpretation, Cropper et al. (1998) noted that the shortest orbital period a binary system could have with a main-sequence secondary is ∼80 min (see Ritter 1986). However, with a He degenerate secondary, the binary orbital period could lie in the range ∼6–50 min. A crucial test is the characteristics of the optical/infrared spectrum of RX J1914+24 – if hydrogen lines were to be detected, then this would cast considerable doubt upon the double-degenerate polar interpretation.
Spectra were taken with the 2.3-m telescope at Steward Observatory at Kitt Peak on the nights of 1998 September 24 and November 15, under conditions of moderate (∼1.0–1.5 arcsec) seeing with a slit of 3- and 2-inches width, respectively. The object could be discerned from surrounding nearby stars on the guider monitor. The total exposure time was 5400 s, using the CCD spectropolarimeter developed by Schmidt et al. (1992). The resolution was ∼12 Å. The resulting spectrum (Fig. 3) is very red and, remarkably, no emission lines are detected. The only possible line is an absorption line at ∼5200 Å, which could be caused by Mg i (5173/5184 Å). This feature was only observed on one of the two nights so this feature must be regarded as being tentative.
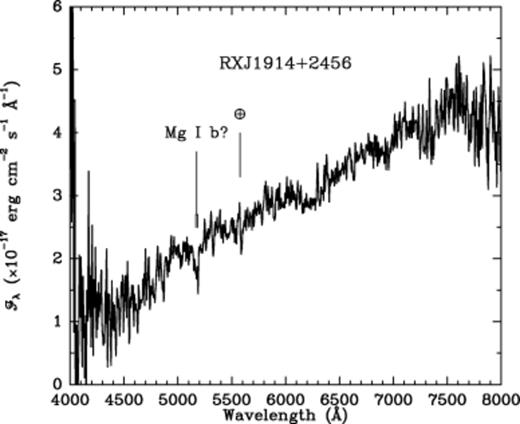
The optical spectrum of RX J1914+24 taken with the 2.3-m telescope at Steward Observatory at Kitt Peak, no correction for reddening has been applied. No significant emission lines are detected.
For the data taken in 1998 September, the instrument was configured for circular spectropolarimetry. Using the whole spectral range we find a formal result of V/I=0.14 per cent ±0.29 per cent (1σ), for a 3σ upper limit of 0.9 per cent. This is consistent with our imaging polarimetry data. There are no significant polarization features in the spectrum from 4000 to 8000 Å.
3.2 The K-band infrared spectrum
We obtained a K-band infrared spectrum of RX J1914+24 on 1999 August 14 using UKIRT on Hawaii as part of the service program. The detector was CGS4. A 30-s exposure was taken at each detector position, then the detector was moved by half a pixel over a distance of 2 pixels. Each frame was therefore over a total period of 120 s. The combined exposure was 104 min in total. The bright star BS7280 was observed to correct for telluric features. The images were reduced in the standard manner using figaro procedures. Because of variations in the seeing and water content in the atmosphere during the observations, it was not possible to obtain reliable flux-calibrated spectra, and therefore the flux scale is arbitrary. The resulting spectrum is shown in Fig. 4. Although the signal-to-noise ratio is low, no obvious emission lines of either H or He are present.
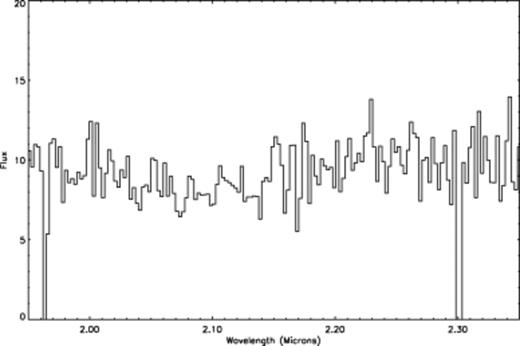
The K-band infrared spectrum of RX J1914+24 taken with the UKIRT telescope. The flux scale is arbitrary.
In the 1.9–2.4 μm wavelength range, several emission lines have been observed in the spectra of mCVs with red-dwarf secondaries (Dhillon & Marsh 1995, Dhillon et al. 1997, Dhillon 1998, 2000). These include the prominent emission lines He i (2.059 μm) and Bracket γ (2.166 μm). Dhillon et al. (2000) also show the spectrum of the non-magnetic, double-degenerate system, GP Com, which exhibits the prominent He i line at 2.059 μm. These spectra were also obtained using UKIRT and CGS4. Although there is no known K-band magnitude for GP Com in the literature, its V-band magnitude is ∼16, compared with ∼20 when we observed RX J1914+24 in 1999 July (the month previous to our UKIRT spectrum). The exposure of the GP Com spectra (24 min) is a factor of 4.3 shorter than that of our RX J1914+24 spectrum, which is equivalent to reaching 1.6-mag fainter. If the V-band magnitude difference between GP Com and RX J1914+24 is roughly comparable in the K band, this would suggest that the lines may be hidden in the noise.
4 The extinction towards RX J1914+24
Haberl & Motch (1995) fitted the ROSAT X-ray spectrum of RX J1914+24 with an absorbed blackbody spectrum and obtained a column density of 1.0±0.1×1022 cm-2. From this they derived an extinction of AV=5.6 using the NH, EB−V relationship (e.g. Predehl & Schmitt 1995) and AV=3EB-V. Using this value for the extinction, Ramsay et al. (2000) found that the extinction-corrected I, J, K and H fluxes could not be well fitted with a blackbody. We now have observations extending down to the B band, which allows us to re-examine the extinction towards RX J1914+24.
The BVRI-band data shown in Table 1 were taken on 1999 July 6–8, while the JHK data were taken over 1998 July 2–3. In addition, I-band data were taken on 1998 June 25–27, which show that RX J1914+24 had approximately the same magnitude in 1998 June as 1999 July (to within ∼0.1 mag). This suggests that we can combine the BVRIJHK data with a reasonable degree of confidence.
We fitted a blackbody to the optical–infrared data assuming an area of a Roche-lobe-filling secondary (a 0.08-M⊙ white dwarf) and one which just underfills its Roche lobe (a 0.1-M⊙ white dwarf). We caution that for such low masses, the reliability of the Nauenberg (1972) mass–radius relationship for white dwarfs is not known. The free parameters were the temperature of the blackbody; the extinction and the normalization (or distance). For the extinction we take the interstellar reddening law given in Zombeck (1990). In Fig. 5 we show the confidence contours in the temperature–EBV and temperature–normalization planes.
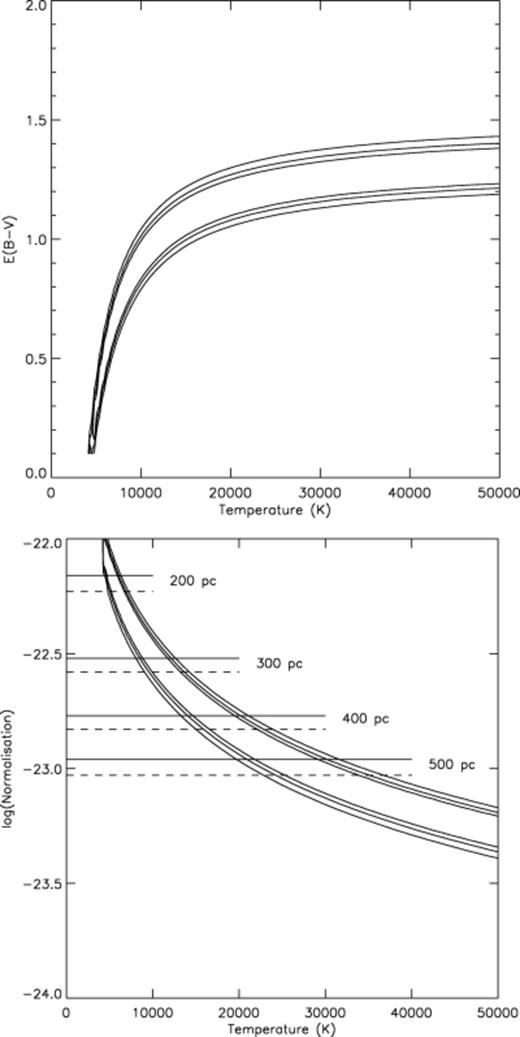
The temperature, extinction and normalization (=area white dwarf/2×distance2) derived using a blackbody fit to the BVRIJHK data. The 68, 90 and 99 per cent confidence contours are shown. The solid lines are for a white dwarf of radius appropriate for a Roche-lobe-filling secondary (a 0.08-M⊙ white dwarf) and the dashed lines are for a slightly underfilling its Roche lobe (a 0.1-M⊙ white dwarf).
We find that a wide range of temperatures are consistent with the data. Single DA white dwarfs have a mean temperature of ∼10 000 K, while accreting white dwarfs usually have photospheric temperatures in the range ∼10 000–30 000 K (Sion 1999). For a temperature of 10 000 K, EB-V∼0.85, AV=2.6, while for a temperature of 30 000 K, EB-V∼1.25, AV=3.9. For a temperature in the range 10 000–30 000 K the distance is ∼200–500 pc. To match the extinction derived by Haberl & Motch (1995), the temperature would have to be much greater than 50 000 K. From similar arguments, Ramsay et al. (2000) estimate a distance of 100–400 pc.
For an extinction of AV=3.0, the implied unabsorbed luminosity over the 4000–25 000 Å range is ∼ where
where  is the distance in units of 100 pc.
Since we derive a lower absorption than Haberl & Motch (1995), we extracted the ROSAT PSPC spectrum from the data archive. Rather than binning the spectrum into six bins, we binned it into 52 bins. We fitted the spectrum with an absorbed blackbody and find that the temperature and absorption column are closely correlated and the absorption is not closely constrained. We find that if we fix the extinction at AV=3.0(=5.4×1021 cm-2) we obtain a good fit:  (50 dof), kT=56 eV. This is consistent with the fits to the ASCA SIS spectrum (Ramsay et al. 2000). The phased-averaged bolometric X-ray luminosity is
  .
.
5 Amplitude variations at Optical/Infrared wavelengths
In Fig. 2 we show the V, R, I, J photometry folded and binned on the 9.5-min orbital period. The peak-to-peak amplitude variation is 0.13, 0.10, 0.07 and 0.16 mag, respectively. In the double-degenerate model of Ramsay et al. (2000) the optical/infrared modulation is caused by the secondary star, which is irradiated by the accretion sites on the primary. We can make a very crude estimate of the temperature difference between the irradiated and non-irradiated hemispheres of the secondary star, if we assume that they have equal areas and the emission can be approximated by a blackbody. In reality neither assumption is likely to be an accurate approximation, as the emission is probably characterized by a blackbody component together with another component, which is caused by irradiation. Other effects, such as limb darkening will also complicate matters. Assuming a mean temperature for the secondary of T=20 000 K, we find that the observed amplitude variations require a temperature difference of ∼1000–2000 K between the irradiated and non-irradiated parts of the secondary.
6 The nature of the short dip seen in the optical range
In Section 2.2 we concluded that the short dip seen at a phase of φ∼0.85 was significant. Using the J-band data, which has the highest time resolution, we find that the width of the dip is Δφ∼0.03 cycles. The phasing of the optical/infrared light curve with respect to the X-ray curve suggests that it could be caused by a stream that partially obscures the irradiated surface of the secondary. Since the dip is so narrow, the stream should have a small diameter.
Suppose RX J1914+24 consists of a magnetic white dwarf accreting material from its companion. For a dipole magnetic field, one can define a magnetospheric radius, r, at which point the magnetic pressure balances the ram pressure of the accretion flow. The magnetospheric radius takes the form:

which gives r=1.2×1010 cm for M1=1.0 M⊙ (giving R1=5.5×108 cm), B=5 MG and M·=1×10¹⁶ g s-1. This is comparable to the binary separation of a∼1.1×1010 cm for the same orbital parameters. This suggests that the stream gets coupled by the magnetic field very close to the L1 point.
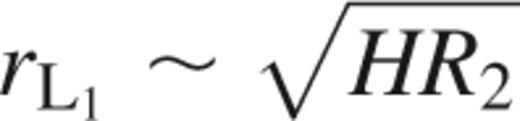
The azimuthal angular span of the accretion stream is approximately constant from the L1 point towards the primary and hence the width of the dip seen in the optical range can be estimated if we can determine the radius of the stream at the L1 point. The radius of the stream at the L1 point, rL1, is given roughly by
where H is the scale height of the unperturbed atmosphere, given by
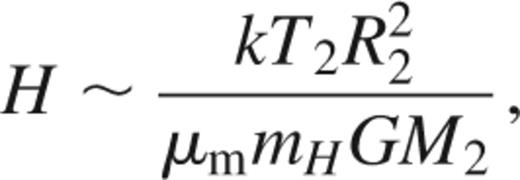
and T2 is the surface temperature of the secondary star, μm is the mean molecular mass and M2 is the mass of the secondary (Pringle 1985). In our double-degenerate polar interpretation, we have M2=0.08 M⊙, giving R2=2×109 cm from the mass–radius relationship of Nauenberg (1972) for white dwarfs. For a helium atmosphere, μm=4 and for T2=104 K, we obtain  =1.1×107 cm. This would result in a dip lasting ∼2π/1000∼0.006 cycles, which is of the right order of magnitude for the observed duration of the dip.
7 Unsolved mysteries
Cropper et al. (1998) suggested that RX J1914+24 is a double-degenerate polar to explain the lack of a second period in the ROSAT data and the shape of the X-ray light curve. The more extensive study of Ramsay et al. (2000), added weight to this argument: the X-ray spectrum is typical of polars; a main-sequence secondary star was found to be inconsistent with the infrared colours; and a more detailed search of the X-ray and optical data continued to reveal only a single period.
At this point it may be useful to briefly summarize the arguments that support the presence of mass transfer in RX J1914+24. The fact that we observe a modulation at X-ray and the optical wavelengths is not by itself indicative of mass transfer: for instance, a modulation is seen in the non-interacting white dwarf RE J0317−853 caused by its rotation (Barstow et al. 1995). On the other hand, since the optical and X-ray light curves are out of phase (Fig. 2) it is much more likely that it is indeed an interacting binary. Furthermore, Ramsay et al. (2000) found a large variation in the long-term X-ray light curve which can be explained in terms of mass-transfer variations. These features support the double-degenerate polar model. However, in this model we would also expect to detect optical polarization and emission lines – which we do not detect. We now go on to address these issues.
7.1 The problem of no polarization
I-band polarimetry by Ramsay et al. (2000) failed to detect significant circular polarization in the system. The antiphasing of the I-band and X-ray light curves indicates that the optical flux is unlikely to originate from cyclotron emission. Ramsay et al. (2000) concluded that the magnetic field of the primary must be sufficiently high for the cyclotron emission to peak in the ultraviolet (UV), or sufficiently low for it to be at infrared wavelengths. Alternatively, they suggested that no shock formed owing to the small dimensions of the system. Our V-band polarimetric and spectropolarimetric observations presented in this paper extend the non-detection of circular polarization to shorter wavelengths, so that the high-field option above can be considered less tenable. Unfortunately, no infrared circular polarimetry is available to test the low-field option.
7.2 The problem of no emission lines
A second difficulty with the double-degenerate polar model is that we find that no detectable emission lines. A general (indeed almost defining) feature of accreting binary stars is the presence of emission lines. In the case of AM CVn systems (non-magnetic interacting double-degenerate binary systems) the donor is a low-mass helium white dwarf. In these systems, no hydrogen lines are visible, but strong helium lines are present (e.g. Marsh, Horne & Rosen 1991).
If mass transfer does occur, the lack of emission lines may be caused by continuum emission from the heated face of the secondary that far exceeds the flux from any line emission from the accretion stream. Assuming the temperatures of the heated secondary and the accretion stream are approximately similar, then the flux ratio from the secondary and the stream is simply proportional to the relative emitting areas. For the secondary, the area is  . Crudely, the projected area of the stream is ∼ra, where r is the radius of the stream and a is the orbital separation. In Section 6 we estimate the radius of the stream as ∼107 and a=1010 cm (Ramsay et al. 2000), giving an area of 1017 cm2. The flux ratio is therefore ∼100. For a hot accretion stream, say T>30 000 K, line emission would be suppressed and therefore the flux ratio of 100 must be regarded as a lower limit. Although the double-degenerate polar model predicts that weak optical emission lines will be present, we will require a spectrum of much higher signal-to-noise ratio than the spectra obtained in Section 2 to test this.
8 Alternative models
Despite the success of the double-degenerate polar model in explaining many of the characteristics of the system, the absence of both detectable circular polarization and line emission requires some explanation. The arguments discussed earlier indicate that it is possible to explain the absence of these features, but only by adopting particular values for the magnetic field and that the emission lines are so weak that we did not detect them in our relatively low signal-to-noise ratio spectra. We have therefore explored whether there may be alternative models for RX J1914+24, which would explain its characteristics more naturally. We consider below three alternatives: a double-degenerate Algol model, a neutron star–white dwarf pair and an electrically driven model.
8.1 Double-degenerate Algol model
In normal Algol systems, the accretor is an early main-sequence star and the donor is either a late-type giant or subgiant star. For relatively short-period systems (less than ∼6 d), the radius of the primary, R1, is large enough compared with the minimum distance between the stream and the centre of the primary (Rmin), that the accretion stream will impact directly on to the primary without forming an accretion disc.
Here we consider the case when both the primary and secondary are white dwarfs with negligible magnetic fields. In Fig. 6 we show Rmin and R1 for a range of combinations of M1. We also show for interest, the radius from the primary at which a disc starts to form – the circularization radius Rcirc. Fig. 6 shows that for M1<0.5 M⊙ the stream will impact directly on to the primary.
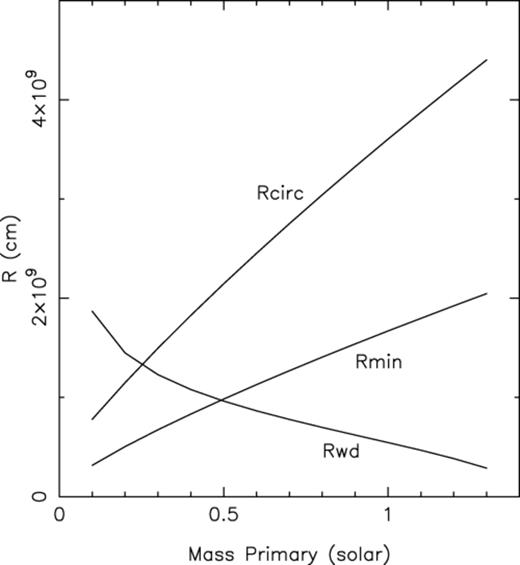
For a range of masses for the white dwarf primary we show the radius of the primary (Rwd), the circularization radius (Rcirc) and the distance of minimum approach of the stream to the primary (Rmin). For Rwd>Rmin the stream will impact directly on to the primary as in the case for short-period Algol systems.
This model has the advantage that it would naturally account for the lack of optical polarization. In addition, if the accretion stream flow impacts with the primary over a range of azimuth, it is likely that the brightness of the accretion site would not be uniform. This would result in a non-symmetric X-ray light curve: this is consistent with the X-ray light curves shown in Fig. 2. However, as with the double-degenerate polar model, emission lines (possibly weak ones) would be expected to be observed in optical spectra.
8.2 Neutron star–white dwarf pair
We now consider a second alternative, that of a neutron star primary and a white dwarf secondary. A number of accreting neutron stars are known. These include low-mass X-ray binary systems or isolated neutron stars that accrete from the interstellar medium. The luminosity of an accreting neutron star depends on the accretion rate, M·. For an isolated neutron star the accretion rate is determined by the proper motion of the star, and the gas density in the interstellar medium (e.g. Treves et al. 2000). Assuming a number density for interstellar gas of ∼0.1–1 cm−3 and a gas temperature of 103–104 K, which is typical of the solar neighbourhood, M·∼1011–1012 g s-1, implying that the luminosity of an accreting isolated neutron star would be ≲1032 erg s−1.
Our estimate for the X-ray luminosity (Section 4) is a factor of ∼10 greater than this. However, if the neutron star is accreting at a low rate, say from material located in the binary system that may be the remnants of a previous evolutionary phase, then the predicted luminosity could equal the observed luminosity.
We conclude that a neutron star–white dwarf model for RX J1914+24 is only viable if the neutron star is accreting material that has been left over from a previous phase of binary evolution. This scenario is attractive in the sense that we would not expect to observe significant levels of polarization in the optical band. Furthermore, we would not necessarily expect to observe optical line emission if the neutron star were accreting spherically. In addition, if accretion were occurring on to one of the magnetic poles of the neutron star, the X-ray light curve could match the observed X-ray profile for a wide range of geometries. As in the double-degenerate polar interpretation, the hot polar cap could irradiate the secondary white dwarf and cause a phase shift in the X-ray/optical data.
8.3 Unipolar-inductor model
In our double-degenerate polar model the less massive degenerate star, the secondary, must fill its Roche lobe in order to facilitate the mass-transfer process. Suppose that the companion is now slightly denser and unable to fill its Roche lobe. The companion is still tidally locked into synchronous rotation with the orbit, while the magnetic primary may not be in perfect synchronism. The secondary will then traverse the magnetic field of the primary. Because white dwarfs are highly conductive, a large EMF will be induced across the secondary. If the space between the two white dwarfs is filled with plasma, current loops can be set up (closed circuits), and the system acts like a unipolar inductor. Dissipation occurs mainly in the atmospheres of the white dwarfs, where the resistance is highest. We now consider an alternative to our accretion-driven scenarios.
One example of a cosmic unipolar inductor is a planet–moon system. A well-known example is the Jupiter–Io system, of which a bright trail of foot-points of the magnetic-field lines traversed by Io are observed on the surface of Jupiter (Clarke et al. 1996). Another type of unipolar inductor is a white dwarf–planet system. For such a system with an orbital period of 10 h, electrical energy with a power of ∼1029 erg s−1 (Li, Ferrario & Wickramasinghe 1998) can be generated. A double-degenerate unipolar inductor can produce a large EMF because of the strong magnetic field of the primary dwarf and the large diameter of the secondary white dwarf. Thus the electrical current and hence the power that it generates should be significantly larger than a planet–moon or a white dwarf–planet system. The details of the unipolar-inductor model for a double-degenerate star are presented in Wu et al. (2002).
This model predicts X-ray emission from both magnetic poles. We would expect the emission from each foot-point to result in light curves that had a ‘top-hat’ appearance. The X-ray light curves shown in Fig. 2 are consistent with a combination of two such light curves. Furthermore, if the foot-points of the current carrying field-lines remain fixed with respect to the secondary (as in the Jupiter–Io system, Clarke et al. 1996), then asynchronous rotation will not manifest itself in orbital period changes. The stability of the X-ray light curves is consistent with this scenario.
Furthermore, a luminosity of 1033 erg s−1 (cf. Section 4) can be produced if the system deviates sufficiently from synchronism (e.g. 1/1000; Wu et al. 2002). As there is no accretion column and no accretion shock, no strong emission lines or circular polarization are expected. Thus, the unipolar inductor can account naturally for the two main difficulties with the accretion models.
9 Conclusions
We have presented optical and infrared spectra of RX J1914+24: no strong emission lines are present. Furthermore, there is no evidence for significant levels of polarization. In the double-degenerate polar model, emission lines and detectable levels of polarization are expected. It is possible, however, that the emission lines are too faint to have been detected in our spectra. We have also explored other alternative models: a double-degenerate Algol, a neutron star–white dwarf pair and a cosmic unipolar inductor. The latter model is attractive in that the non-detection of polarization and emission lines is a natural consequence of this model. It can also account for the X-ray luminosity if the system has a small degree of asynchronism.
Acknowledgments
Based (in part) on data collected at Subaru Telescope, which is operated by the National Astronomical Observatory of Japan. We would like to thank the NOT for the allocation of observing time. NOT is operated on the island of La Palma jointly by Denmark, Finland, Iceland, Norway and Sweden, in the Spanish Observatorio del Roque de los Muchachos of the Instituto de Astrofisica de Canarias. We would like to thank the staff of UKIRT for providing a spectrum that was obtained as part of the UKIRT service program. UKIRT is operated by the Joint Astronomy Centre on behalf of the UK Particle Physics and Astronomy Research Council. KW acknowledges the support of PPARC for a Visiting Fellowship and the ARC Australian Research Fellowship. Studies of magnetic stars and stellar systems at Steward Observatory is provided by NSF grant AST97-30792 to GDS.
References
