


Abstract
We report the discovery of the first hyperluminous infrared galaxy (HyLIG) in the course of the European Large Area ISO Survey (ELAIS). This object has been detected by ISO at 6.7, 15 and 90 μm, and is found to be a broad-line, radio-quiet quasar at a redshift  . From a detailed multicomponent model fit of the spectral energy distribution, we derive a total IR luminosity LIR
 , and discuss the possible existence of a starburst contributing to the far-IR output. Observations to date present no evidence for lens magnification. This galaxy is one of the very few HyLIGs with a X-ray detection. On the basis of its soft X-ray properties, we suggest that this broad-line object may be the face-on analogue of narrow-line, Seyfert-like HyLIGs.
1 Introduction
Early ground-based infrared (IR) observations have revealed the existence of a population of galaxies emitting the bulk of their bolometric energy in this wavelength range (e.g. Rieke & Low 1972). Further studies of these objects (see Sanders & Mirabel 1996 for a review and definition of the various subtypes) have revealed their potential importance in the context of galaxy evolution (e.g. Sanders et al. 1988) or in contributing to the cosmic far-IR/submillimetre background (e.g. Hughes et al. 1998). Observational characteristics of this class of galaxies are now relatively well established. In particular, interacting processes are widely believed to play a pivotal role in triggering the IR excess, not only in the local Universe (Sanders & Mirabel 1996 and references therein) but also at moderately high redshift (Smail et al. 1998). While a contribution to the IR output can arise both from a dust-enshrouded active galactic nucleus (AGN) and from a (generally circumnuclear) starburst, there is strong evidence from optical or mid-IR spectroscopy for an increasing fraction of objects with AGN-like characteristics when progressing toward higher luminosities (e.g. Lutz et al. 1998; Veilleux, Sanders & Kim 1999).
Of particular relevance for a better understanding of this important population are the objects at the upper end of the luminosity distribution (the so-called hyperluminous infrared galaxies; hereafter HyLIGs).1 If their luminosities are starburst dominated, they are potentially forming the bulk of their stellar population in a single, violent episode. This makes them an interesting subpopulation of galaxies, but work so far is severely hampered by inhomogenous and/or AGN-biased selection. Only 13 HyLIGs are known at present from far-IR or submillimetre surveys, and a further 12 from cross-correlating far-IR source lists with AGN catalogues (Rowan-Robinson 2000, hereafter RR).
In regard of the exceedingly small space density of HyLIGs (van der Werf et al. 1999; RR), only major extragalactic IR surveys offer good prospects to uncover new candidates. Of particular interest in this respect is the European Large Area ISO Survey (ELAIS) which was conducted over ≈11 deg2 at 15 and 90 μm (down to ≈3 mJy and ≈100 mJy, respectively) and over 6 deg2 at 6.7 μm (down to ≈1 mJy). We refer the reader to Oliver et al. (2000, hereafter Paper I) for a complete description of this project. Details on the technical aspects of the ISOCAM and ISOPHOT observations can be found in Serjeant et al. (2000, hereafter Paper II) and Efstathiou et al. (2000a, hereafter Paper III), respectively. Assuming pure luminosity evolution of the form:  (Boyle, Shanks & Peterson 1988; Saunders et al. 1990), we estimate that about three HyLIGs might be detected in the total area covered by ELAIS. This estimate is considerably uncertain, as it is strongly dependent on the spectral energy distribution (SED) and evolutionary model assumed. As we can safely rule out no-evolution models, however, we find that the formal significance of detecting one object is very high (≈35σ). We report in this paper on the discovery of such a candidate HyLIG in the ELAIS N2 region.
2 Identification of the New Hylig
This new HyLIG was discovered as part of a study aiming at studying the IR colour properties of ELAIS galaxies (Morel et al., in preparation). The procedure used to isolate galaxies potentially detected at 6.7, 15 and 90 μm was to cross-correlate the ISOCAM and ISOPHOT source lists using a 35-arcsec association radius. Details on the production of the ISOCAM and ISOPHOT catalogues can be found in Paper II and Héraudeau et al. (in preparation), respectively.
Fig. 1 shows the ISOPHOT error circle of the HyLIG (ELAISP90_J164010+410502; hereafter ELAIS J1640+41) overlayed on a deep (down to  optical image. The ISOCAM error circles are also shown. The only obvious optical counterpart to the ISO sources is found to be a point-like object at:
  and
and  (J2000). This source is, within the uncertainties, spatially coincident with an optically-selected quasar at a quoted redshift of 1.097 ([CCS88] 163831.4+411107; Crampton et al. 1988). As can be seen in Fig. 1, a bright optical source (as well as a number of much fainter ones) appears to lie in close vicinity of the quasar. Since no redshifts are available for these objects, it is unclear at this stage whether they are physically associated with the new HyLIG.
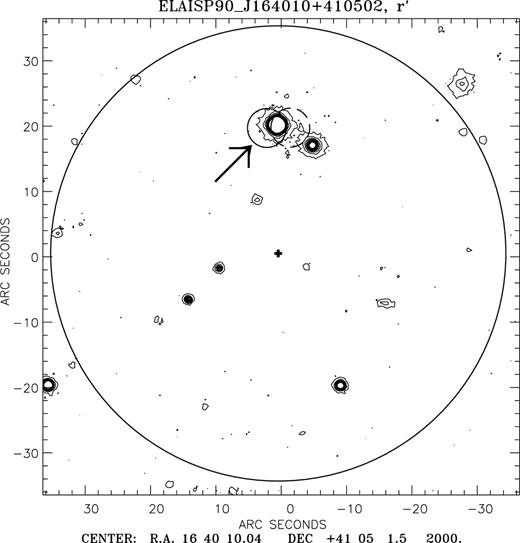
Optical (r′) contour map of ELAIS J1640+41 centred on the ISOPHOT detection (cross). The lowest contour is drawn at 3σ, and then by steps of 6σ. The error circle for ISOPHOT (35 arcsec), as well as the 6-arcsec error circles for the detections at 6.7 (solid) and 15 μm (dashed) are also overlayed. The new HyLIG is indicated by an arrow.
We used the quasar B-band source counts of Wisotzki et al. (2000) to estimate the number of random ISOPHOT-quasar associations in our sample at  (see Table 1), or brighter. The expected total number of random associations in the search radius is only 0.011 for the 285 ISOPHOT sources. Furthermore, 35 per cent of the ELAIS N2 area is covered by the parent sample of the quasar, i.e. only about 10 per cent of the total ELAIS area. The total number of random associations in the overlap region is therefore only ≈
 , giving strong support for the reality of the ISOPHOT-quasar association.
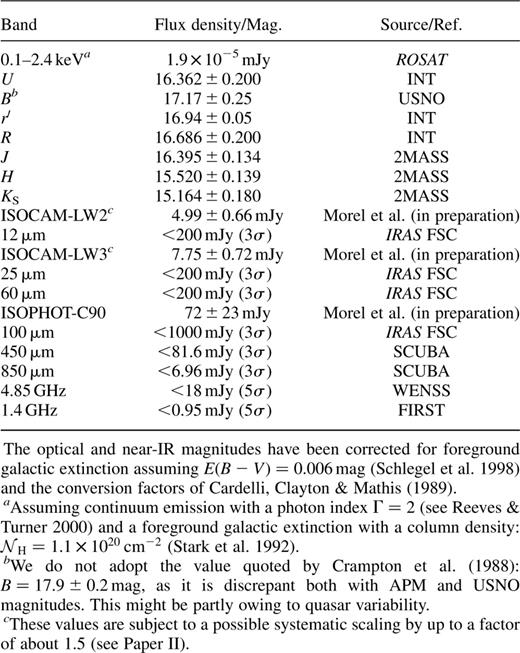
Photometric properties of ELAIS J1640+41.
The quasar does not appear in the IRAS Faint Source Catalogue (FSC) or Faint Source Reject (FSR) catalogues. To test the reliability of our ISOPHOT detection, we made IRASADDSCANs of the source, as well as of 15 galaxies with reliable 90-μm detections at similar flux densities  from the Paper III catalogue, and 16 control positions at random 20-arcmin offsets from the target positions. We found our ISOPHOT 90-μm data to be not well reproduced by the ADDSCAN 100-μm measurements, although most of the flux densities were positive. However, the control fields gave values distributed around zero as expected, from which we derived a ≈4σ ADDSCAN detection of our ISOPHOT source. This confirms the reality of the source, but we also conclude that it is too faint to reliably measure the flux density with ADDSCANs. We only consider in the following upper limits from the FSC.
Optical spectroscopy was obtained at the Nordic Optical Telescope using ALFOSC2 in non-photometric conditions and seeing of 1.5 arcsec. We used a 1.2-arcsec wide slit oriented EW. The exposure time was
  . The spectrum was reduced using standard iraf3 routines and is shown in Fig. 2. We derive a redshift:
  . This value is consistent with previous estimates (Crampton, Cowley & Hartwick 1989), and is used in the following. Table 2 gives the relative line fluxes, EWs and FWHMs.
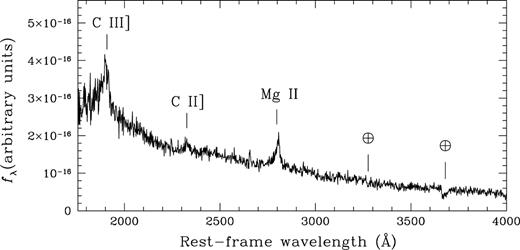
Rest-frame UV/optical spectrum of ELAIS J1640+41 (assuming a redshift of 1.099). The main lines are indicated (the ⊕ symbols mark terrestrial telluric absorption features). The spectrum has been corrected for both atmospheric and foreground galactic extinction. We assumed  (Schlegel, Finkbeiner & Davis 1998).
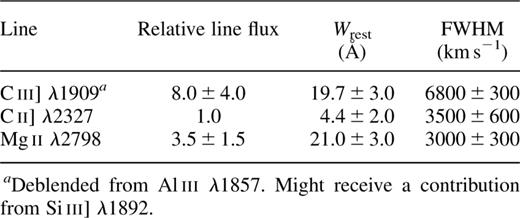
Line properties of ELAIS J1640+41.
3 Model Fit of the Sed
Table 1 summarizes the available photometric data for this seldom-studied object. New submillimetre observations (see Farrah et al., in preparation) were carried out with the Submillimetre Common-User Bolometer Array (SCUBA) at the James Clerk Maxwell Telescope (JCMT) in photometry mode. Data reduction was performed using the standard surf pipeline software. The source is undetected both at 450 and 850 μm, with 3σ upper limits of 81.6 and 6.96 mJy, respectively. The region surrounding the HyLIG was unfortunately not observed as part of the radio survey of the northern ELAIS areas (Ciliegi et al. 1999), but the available radio flux limits imply that this quasar is radio-quiet (Sopp & Alexander 1991). Following Véron-Cetty & Véron (2000), we obtain:  .
.
The SED is displayed in Fig. 3. Assuming that the host galaxy is similar to coeval quasars (e.g. McLure et al. 1999), we used the radio galaxy  relation of Eales et al. (1997) to estimate the host galaxy near-IR magnitude, obtaining:
  . As can be seen in Fig. 3, the contribution of the host galaxy to the SED is negligible. In order to estimate the energy budgets to the IR luminosity, we modelled the SED by simultaneously considering models for dust-enshrouded AGNs (Efstathiou & Rowan-Robinson 1995) and starbursts (Efstathiou, Rowan-Robinson & Siebenmorgen 2000b). Although we do not claim to have exhaustively explored the possible physical parameter space of these models, we found that the SED is most naturally explained by a combination of these two components. Pure AGN models have difficulties in accounting for the far-IR emission. We achieve a satisfactory fit to the SED (see Fig. 3) by assuming roughly similar contributions from dust grains heated by the nuclear UV/optical continuum
  and by a starburst
  The difficulties in fitting the region around
  might be related to uncertainties in the isocam absolute calibration (Paper II).
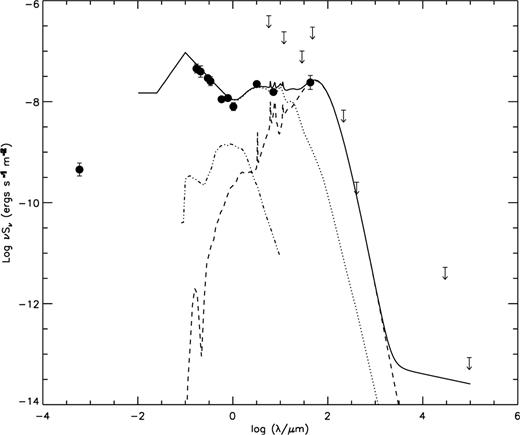
Rest-frame SED of ELAIS J1640+41 from X-rays to radio (data from Table 1). The SED is fitted with a combination of one of the starburst models of Efstathiou et al. (2000b)(dashed line; and an AGN dusty torus model (dotted line) from Efstathiou & Rowan-Robinson (1995). We assumed a half-opening angle for the torus of 45° and a face-on inclination. The starburst SED is extrapolated in the radio using the far-IR/radio correlation (Helou, Soifer & Rowan-Robinson 1985). For the host galaxy, the SED of a 4-Gyr old stellar population (dotted-dashed line;Fioc & Rocca-Volmerange 1997) has been normalized to
  (see text).
The total rest-frame IR luminosity we derive, LIR , is, in the scheme of RR, slightly above the threshold for a HyLIG classification. The robustness of the derived luminosity has been explored by considering two low-redshift objects in the list of RR with detections in all IRAS bands (IRAS
  and IRAS 18216+6418). Similarly to the approach adopted here, the IR luminosities have been derived by RR from a multicomponent model fit of the SED, and are found to agree to within 25 per cent with the values determined by the method prescribed by Sanders & Mirabel (1996). We conclude that estimates of the total IR luminosity are fairly insensitive to the choice of method used, although the relatively low value we obtain for ELAIS J1640+41 (coupled with the quite large uncertainties in the IR fluxes) indicates that this object can only be formally considered as a candidate HyLIG at this stage.
Gravitational lensing is known to enhance the luminosity in a number of HyLIGs (e.g. Serjeant et al. 1995). While our data do not allow us to rule out lens magnification at this stage, this possibility can be explored in the future via high-resolution Hubble Space Telescope (HST) imaging or by seeking for intervening Mg ii absorbers in high-quality, moderate-resolution spectroscopic data (e.g. Goodrich et al. 1996).
4 Discussion
4.1 ELAIS J160+1 in relation to other HyLIGs
We compare in Fig. 4 the SED of ELAIS J1640+41 with a sample of HyLIGs with optical evidence for quasar activity. It can be seen that ELAIS J1640+41 (which is the least luminous in this subset) presents a relative excess in the far-IR. Interestingly, the strongest outlier (BR  is also the most luminous (RR). This trend of hotter colour temperature with increasing luminosity might suggest an increasing contribution from AGN emission at high luminosities (see also Haas et al. 2000). However, such an effect is not apparent in the sample of quasars studied by Polletta et al. (2000). The detection of a large reservoir of molecular gas in BR
  (Ohta et al. 1996), but not in PG 1634+706 (Barvainis et al. 1998) also seems to be at variance with this simple picture.
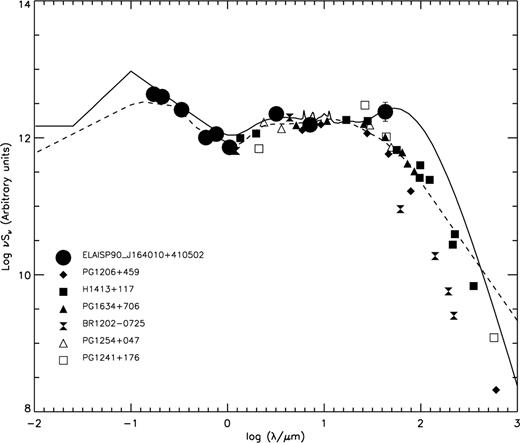
Comparison of the rest-frame SEDs of a number of HyLIGs with optical evidence for quasar activity (data from RR and references therein). The solid and dashed lines show the model fitted to ELAIS J1640+41 (see Fig. 3) and the mean SED of radio-quiet quasars in the UVSX sample (Elvis et al. 1994), respectively. The data points are normalized to their rest-frame flux at 15 μm. The vertical scale is arbitrary.
We also show in Fig. 4 the mean SED of radio-quiet quasars in the UVSX sample defined by Elvis et al. (1994). It can be seen that ELAIS J1640+41 displays a significant far-IR excess compared to this population, hence giving credence to the existence of a starburst contributing to the IR output. Indicative of the unusually strong level of IR emission from ELAIS J1640+41 is the fact that a number of more powerful quasars in the optical regime are not members of the HyLIG class (McMahon et al. 1999). Assuming a Salpeter initial mass function, we derive from the luminosity of the starburst component a current star formation rate in the range:  , depending upon the stellar low- and high-mass cut-offs assumed (see Thronson & Telesco 1986). Although such high values have already been claimed in HyLIGs with quasar activity (e.g. McMahon et al. 1999), we caution that the paucity of far-IR detections does not allow us to set stringent constraints on the star formation rate in ELAIS J1640+41.
Current samples of HyLIGs are severely affected by selection effects. General conclusions regarding the characteristics of this population must thus await the completion of large, unbiased surveys. With this limitation in mind, there is some indication at present for a diversity of power supplies. While AGN-related emission is able to account for the IR output in some HyLIGs (e.g. Granato, Danese & Franceschini 1996), others show evidence for a dominant contribution from star formation (e.g. Ivison et al. 1998). The results of our two-component model fit to the SED of ELAIS J1640+41 support a composite nature for this object. The existence of a number of HyLIGs, whose IR luminosity can be accounted for by a combination of an AGN and a starburst component, has been postulated on similar grounds by RR and Verma et al. (in preparation). The inference of a starburst component mostly contributing to the rest-frame flux longward of about 50 μm is independently supported in several cases by the large amount of molecular material deduced from radio CO observations (RR).
4.2 Soft X-ray properties of ELAIS J160+1
Inspection of the ROSAT all-sky survey  photon maps shows that our object lies within the 90 per cent error box of a X-ray source detected at the 3.4σ confidence level. We obtain a rest-frame (uncorrected for intrinsic absorption) X-ray luminosity in the
  band:
band:  , which translates into a
  ratio of about
  . This ratio supports an AGN interpretation for the soft X-ray emission (Wilman et al. 1998), but is almost two orders of magnitude higher than the upper limits found for HyLIGs with Seyfert 2 like optical spectra (Lawrence et al. 1994; Fabian et al. 1996; Wilman et al. 1998). The spectral index of the UV/optical power-law continuum in ELAIS J1640+41
  is typical of UV-selected quasars (e.g. Natali et al. 1998), and suggests little dust obscuration along our line of sight to the nucleus. In contrast, we estimate that column densities:
  would attenuate the (redshifted) ≈3-keV emission of ELAIS J1640+41 to levels comparable to those observed in Seyfert 2 like HyLIGs.4 This value compares well with the typical amount of obscuring material intrinsic to these objects (e.g. Wilman et al. 1998). In the context of the unification scheme, the soft X-ray properties of ELAIS J1640+41 are thus consistent with this galaxy being a face-on analogue of such narrow-line HyLIGs (see Franceschini et al. 2000). This interpretation is independently supported in several cases by the detection of strongly polarized continuum emission in edge-on objects (e.g. Hines et al. 1995).
Acknowledgments
We wish to thank K. G. Isaak for carrying out the submillimetre observations, as well as the referee (D. Sanders) and M. Villar-Martin for useful comments. This paper is based on observations with ISO, an ESA project with instruments funded by ESA member states (especially the PI countries: France, Germany, the Netherlands and the United Kingdom) and with participation of ISAS and NASA. This work was supported by PPARC (grant number GR/K98728) and by the EC TMR Network programme (FMRX-CT96-0068). This publication makes use of data products from the Two Micron All Sky Survey, which is a joint project of the University of Massachusetts and the Infrared Processing and Analysis Center/California Institute of Technology, funded by the National Aeronautics and Space Administration and the National Science Foundation. This research has made use of the NASA/IPAC Extragalactic Database (NED) which is operated by the Jet Propulsion Laboratory, California Institute of Technology, under contract with the National Aeronautics and Space Administration.
References
We adopt in the following the definition of Rowan-Robinson (2000):  . We use the same cosmology and
  throughout this paper.
The Nordic Optical Telescope (NOT) is operated on the island of La Palma jointly by Denmark, Finland, Iceland, Norway, and Sweden, in the Spanish Observatorio del Roque de los Muchachos of the Instituto de Astrofísica de Canarias. ALFOSC is owned by the Instituto de Astrofísica de Andalucía (IAA) and operated at the NOT under agreement between the IAA and the NBIfAFG of the Astronomical Observatory of Copenhagen.
iraf is distributed by the National Optical Astronomy Observatories, operated by the Association of Universities for Research in Astronomy, Inc., under cooperative agreement with the National Science Foundation.
Author notes
Present address: Inter-University Centre for Astronomy and Astrophysics (IUCAA), Post Bag 4, Ganeshkhind, Pune, 411 007, India
