


Abstract
Photometric bulge and disc properties of a sample of 21 M51-type pairs observed in BVRI bands are analysed, and the derived parameters obtained by the R1/4-law and exponential bulge models are compared with the sample of normal galaxies reported by de Jong & van der Kruit in 1994. Some characteristic properties of the intensity profiles are then interpreted by 3D N-body simulations, in which both components of the pair are described by an exponential star + gas disc embedded in a live bulge and halo.
The disc central surface brightness μ0 was found to be similar for the M51-type and for normal galaxies, being 21.5 ± 0.8B mag arcsec−2, when the exponential bulge model was used. The main galaxies had generally almost normal photometric properties, whereas for the companions secular evolution must have played an important role. Even though the mean scalelengths for the M51-type galaxies were smaller than for the comparison galaxies, their bulges were larger: especially the companions had extremely large bulge sizes relative to their disc scalelengths having 〈re(bulge)/h〉(B) = 0.37 ± 0.10 in comparison with 0.15 ± 0.09 for normal galaxies. Consequently, the bulge-to-disc luminosity ratios for the companions were also generally larger than known for any of the Hubble types of normal galaxy.
N-body simulations indicated that the inner disc can be steepened during the interaction, and that this steepened disc can be erroneously interpreted as belonging to the bulge. Simultaneously material in the outer disc is redistributed, producing shallow outer profiles similar to those observed for typical M51-type galaxies. These processes were demonstrated by applying photometric bulge-to-disc decompositions for some of the simulated intensity profiles. The decompositions also showed that one must be cautious when applying the R1/4-law bulge model, especially for interacting galaxies. A nearly parabolic experiment showed that the redistribution of matter in the disc during the close passage can be long-lived, suggesting that galaxy interactions even with small companions may play an important role in secular evolution for galaxies in clusters.
1 Introduction
Optical CCD surface photometry has been conducted for many large samples of disc galaxies in order to relate the bulge and disc properties to the Hubble type and to search for evidence of evolution processes. The fundamental parameters describing the discs are the central surface brightness μ0 and the scalelength h, while the bulges are generally characterized by the effective surface brightness μe and the effective radius re. Some basic correlations between these parameters are well known. Of these, the bulge fraction to total luminosity has been most clearly related to the Hubble classification, whereas the constancy of μ0 was suggested by Freeman (1970). Later observations have shown that physically larger systems tend to have dimmer μ0 (Kent 1985; de Jong 1996) and that the distribution of μ0 may be bimodal (Tully & Verheijen 1997; Bell & Block 2000). A rather similar distribution in the re-μe plane for the bulges of Sb and S0 galaxies suggests that there might be evolution between early- and late-type galaxies (Kent 1985).
On the other hand, there is a large amount of observational and theoretical work indicating that galaxy interactions play an important role in galaxy evolution: Toomre's (1977) suggestion that most E+S0 galaxies are merger remnants seems still to be relevant. Hubble Space Telescope observations by Abraham et al. (1996) at high redshifts have shown that the number of spirals has decreased at the present time and that the fraction of galaxies that fit the Hubble sequence well drops with increasing look-back time. Indeed, on the observational side there are strong indices of galaxy mergers, one of the most outstanding being the large number of E+S0 galaxies with shells and ripples. This has been convincingly demonstrated by Schweizer (1998) in his review of galaxy interactions. Also, the disc central surface brightnesses are suggested to be higher for interacting than for field galaxies (Reshetnikov, Hagan-Thorne & Yakovleva 1993). On the other hand, even rather strong interactions have been shown to have only a modest effect on the properties of the bulges (Reshetnikov et al. 1993; Vennik, Hopp & Popescu 2000).
On the theoretical side Toomre & Toomre (1972) emphasized the importance of tidal friction, orbital decay and violent relaxation in interacting systems. Later it has been shown that the orbital kinetic energy in galaxy encounters can cause the escape of stars from galactic discs (Aquilar & White 1985) and that mergers can increase the radial segregation of the luminous component with respect to dark matter (Barnes 1992). Consequently, the surface brightnesses and velocity dispersions of the galaxies are expected to increase. Very strong and rapid interactions may affect even the haloes by galaxy harassment in terms of removing material from the haloes (Oemler 1992; More et al. 1996).
So far, most of the photometric CCD studies of interacting galaxies have concentrated on mergers of two massive galaxies, whereas less attention has been paid to weaker interactions. We are interested here in M51-type systems in which a large galaxy is encountering a smaller companion. Low-mass companions, especially in direct encounters, can efficiently produce tidal bridges and tails, and the discs may be strongly affected (Toomre & Toomre 1972). Grand-design spiral arms are easily produced in mild interactions and can in some circumstances be long-lived (Donner & Thomasson 1994; Salo & Laurikainen 1993, 2000b). On the other hand, many grand-design galaxies have no companions (Elmegreen & Elmegreen 1987), and therefore it is important to understand in which way the interacting and non-interacting grand-design galaxies are different. Studies of nearby pairs may also help us better understand galaxy evolution at high redshifts, where the galaxy mergers are more frequent.
Here we analyse the photometric parameters of a sample of 21 M51-type pairs. The results are compared with a large sample of normal galaxies by de Jong & van der Kruit (1994) and a few 3D N-body experiments are also performed and provide a qualitative interpretation for some of our observations. The sample selection and data reductions are explained in Laurikainen, Salo & Aparicio (1998, Part I), and the bulge-to-disc decompositions are presented in Laurikainen & Salo (2000, Part II).
2 The data
2.1 The samples
Our sample of 21 isolated pairs was selected so that the galaxies showed tidal tails and bridges, and at least the main galaxies had deeply penetrating two-armed spirals. The nearby companions were generally smaller than the main galaxies, with projected location typically near the end of the spiral arm of the main component. Such systems are called ‘prototypical’ (prot.) M51-type systems in all the following, in distinction to pairs with larger galaxy separations in our sample. Note that our use of the term ‘M51-type’ is distinctly different from that in Vorontsov-Velyaminov (1959), who assumed that the companions were thrown out from the main galaxies. Except for two pairs, Arp 70 and Arp 74, the redshifts are known for both galaxies in the pair confirming that they are true physical pairs. Deep images were obtained in the Cousins BVRI photometric system and the magnitudes typically reached surface brightnesses of 26-27B mag arcsec−2.
In order to study the photometric properties of these galaxies, the azimuthally averaged surface brightness profiles were measured. Bulge-to-disc decompositions were then performed by simultaneously fitting the bulge and the disc by an iterative process. To correct for seeing effects, the model profiles were convolved with the Gaussian Point Spread Function as in de Jong (1996). In the error estimations, the background noise, magnitude calibration error and global variations in the sky level were taken into account, of which the sky variations were the most important source of error. The sample selection and data reductions are explained in Part I, together with R-band images and colour index maps, while the surface brightness profiles, isophotal shapes and the bulge-to-disc decompositions are presented in Part II.
For half the galaxies, equally good fits were obtained both by applying the exponential function for the bulge and the disc (exponential model), and by using the R1/4-law for the bulge (R1/4-law model). However, the exponential model fitted the observations better in 35 per cent of the cases. In addition to fairly normal exponential discs, many of the galaxies showed an extended more shallow outer part with surface brightness of about 25-26B mag arcsec−2. The central surface brightnesses generally followed the Freeman law, being typically 21.5B mag arcsec−2. In agreement with de Jong & van der Kruit (1994) we found no cutoffs in the surface brightness profiles below 26B mag arcsec−2. Such cutoffs have been previously detected by Barteldrees & Dettmar (1994) and Morrison, Boroson & Harding (1994).
As a comparison sample we use the volume-limited sample by de Jong & van der Kruit (1994) consisting of 86 galaxies, mainly spirals. Their work is especially suitable for us, because they used similar bulge-to-disc decomposition method and similar bulge models as we did. De Jong (1996) presented the analysis in the B and K-bands by applying 2D-method. As we made only 1D decompositions, comparisons are made here with their 1D decompositions that were available in electronic form for BVRI bands. De Jong (1996) concluded that 1D and 2D methods give rather similar results for most cases, except for galaxies with large bars or galaxies seen nearly edge-on.
2.2 Bulge-to-disc decomposition for Arp 86
Arp 86 (NGC 7753/7752) is a M51-type pair that was included in our original sample, but for which bulge-to-disc decompositions were not presented in Part II. Star formation properties for this pair have been discussed in a separate paper by Laurikainen, Salo & Aparicio (1993) and a detailed dynamical model by Salo & Laurikainen (1993). Here, the bulge-to-disc decompositions were performed in a similar manner as in Part II. The intensity profiles were calculated in elliptical annuli evenly distributed in radius, by assuming a fixed inclination and position angle for the galaxies. Foreground stars were automatically eliminated and the regions contaminated by the nearby galaxy were replaced by the mean value of pixels in the same annulus in the non-affected parts of the image. The measured photometric parameters are presented in Table 1. As explained in Part II the unweighted rms magnitude residual Δ measures the goodness of the fit. The error estimates were taken from the difference between the original measurement and the measurement where the sky background uncertainty was added to the original image. For the companion galaxy NGC 7752, it was difficult to fit the intensity profile, because it is a highly disturbed galaxy without any clear nucleus: one single R1/4-law function without exponential component fitted the whole profile rather well. As in Part II the measurements were done after correcting the images to face-on by assuming optically thin discs.
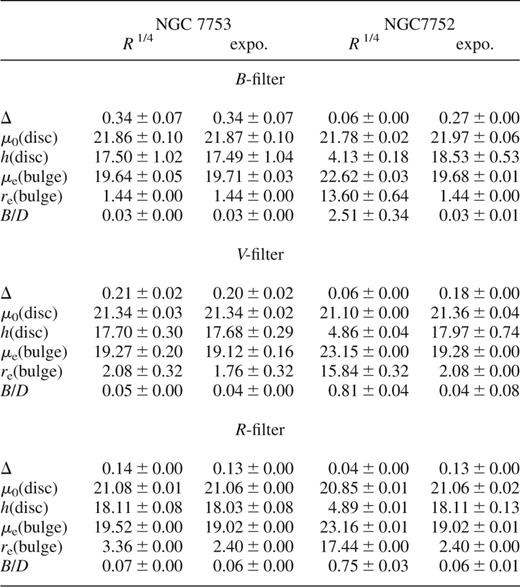
NGC 7753/NGC 7752 (Arp 86): bulge-to-disc decompositions.
2.3 Corrections


In all the following, the above corrections were applied for the parameters of the disc, except for the scalelength, which as a scale parameter is unaffected by the extinction effects. An optically thin case with C=1 was assumed. However, since it is not clear that the above corrections would be applicable also for the parameters of the spherical bulge, the effective surface brightness of the bulge was corrected only for the Galactic extinction. Therefore, in the current comparisons we eliminated the C=1 correction included in the data tabulated in Part II. The cosmological and Galactic extinction corrections were generally small, being on the average about 0.1 mag. The effect of the internal extinction on the surface brightnesses can vary about 0.5 mag between thin and thick discs, thus stressing the importance of using similar C-values while comparing observations between different authors.
3 Parameters of the disc
In the following we compare the central surface brightnesses of M51-type galaxies with those obtained for normal galaxies by de Jong (1996) (see Table 2). The comparisons are made both for the R1/4-law and for the exponential bulge models. In Part II, truncated exponentials were fitted for Freeman type II profiles, and in some cases a single R1/4-law function gave the best fit for the intensity profile. As these galaxies would bias the statistics unnecessarily, they were eliminated in all the following. Some galaxies also showed ‘anomalous’ characteristics compared with the properties of the other galaxies in our sample. For example, Arp 36 and Arp 183 had rather dispersed spiral arms, and Arp 36 also had a double nucleus, which properties may hint at older interactions, probably a merger. Also, Arp 298 B had no clear nucleus and in Arp 74 B the bulge component was not clear. The tables show the mean values without ‘anomalous’ galaxies, while in the figures they are marked with smaller symbols. Generally the statistics have been calculated for all M51-type galaxies, for the main galaxies and the companions, as well as for their subgroups of ‘prototypical’ M51-type galaxies.
Mean disc central surface brightnesses μ0 for normal and M51-type
For our sample, we found  (R1/4-law model), where the error refers to the standard deviation in the sample. While correcting only for the Galactic extinction, the value was 19.67, which is even half a magnitude brighter than
  obtained by Reshetnikov et al. (1993) for peculiar interacting galaxies using the same bulge and disc models. The value we obtained is 1.23 mag brighter than for normal galaxies by Simien and de Vaucouleurs (1986), used as a point of reference by Reshetnikov et al., and 0.9 mag brighter than for galaxies by de Jong & van der Kruit (1994). After also correcting the internal extinction and cosmological stretching for the compared samples the difference between M51-type galaxies and the galaxies by de Jong & van der Kruit remained, although it was reduced to 0.6 mag. However, it is not clear that μ0 for M51-type galaxies really is significantly brighter than for normal galaxies. Namely, if we look at the values derived using the exponential bulge model, 〈μ0〉 for M51-type galaxies was only 0.2 R mag arcsec−2 brighter than for normal galaxies, and this difference totally disappeared when comparing normal galaxies with morphological types Tm=0-6 only, which is a reasonable choice in our case. This is true for all bands. We trust more in the result obtained by the exponential model, for reasons that will be discussed in Section 7.2. Morphological types are difficult to take into account in the above comparison, because for many of the galaxies in our sample they are missing. However, it is not an important factor, because for normal galaxies μ0 is independent of the Hubble type for Tm=0-6, to which classes most of the galaxies in our sample with known classifications belong. Also, possible selection effects related to absolute brightnesses can be only marginal. Namely, dividing the sample of control galaxies into two magnitude bins, again imitating those for the main galaxies and the companions in M51-type pairs, would affect 〈μ0〉 by only 0.1 R mag arcsec−2.
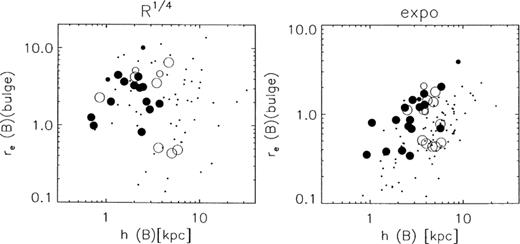
By using the exponential bulge model, the companions had half a magnitude fainter mean 〈μ0〉 (B) than the main galaxies (21.58 versus 21.19). However, there seem to be only a few companions (Arp 82 and Arp 86) with considerably dimmer μ0 than the rest of the galaxies (see Fig. 1), whereas for the large majority of the pairs μ0 was similar for the main galaxies and the companions.

The disc scalelength h versus the central surface brightness μ0 of the disc in the B-band. The left panel shows the parameters obtained by the R1/4-law bulge model and the right panel those obtained by the exponential bulge model. The main galaxies are denoted by open circles and the companions with filled circles, the ‘anomalous’ galaxies being shown by smaller sized symbols. The dots show the comparison galaxies by de Jong & van der Kruit (1994). The parameters for all galaxies were corrected as explained in Section 2.3 and H0=75 km s−1 Mpc−1 was used. The symbols are the same in Figs 1–5.
We next look at the correlation of μ0 with the disc scalelength (Fig. 1), the mean scalelengths for the exponential bulge model being shown in Table 3 at various bands. In the B-band for the main galaxies they were 3.8-4.2 kpc, in comparison with 4.7-5.1 kpc for the normal galaxies, while for the companions the scalelengths were 2.1-3.2 kpc, depending on the bulge model used. In Fig. 1, a weak correlation can be seen between μ0 and h for the main galaxies by the R1/4-law model, showing that smaller galaxies have brighter central surface brightnesses, as expected, whereas for the companions no correlation was found.
![Mean disc scalelength 〈h〉 [kpc] for normal and M51-type galaxies.](https://oup.silverchair-cdn.com/oup/backfile/Content_public/Journal/mnras/324/3/10.1046/j.1365-8711.2001.04347.x/2/m_324-3-685-tbl003.jpeg?Expires=1749967813&Signature=ZEkCFXte5DyC2KofvVXytbfhwc2txpPTpUKFqLz76Eyx2l~Ztrf88UR-3u7OddRRHk2RHzzax4aw3wwFug8BHeVh8F8H7OoY98XG5lXOly4rnypueslg4DBwhujQ5ktEE8ttqVxvFH9AjK~301~4gn6u5AP9R0OWTVYcatfd8b7~FV3pvTzteHIvaQ3Zyz6V~d4UTGjCIIoJljW-iD8Zjj2NA6Efuurw-i0KNM2Z9tWgn0lazZ3PPFWeiFstI1Dy40eZVXrdP7I-hlAdSw0A1wlhU~TtoUGzHBpmQwHSis8SHjKXkZBZzJEnw8hs4yWrSbX3pr94iltofsz0Ikp6Ww__&Key-Pair-Id=APKAIE5G5CRDK6RD3PGA)
Mean disc scalelength 〈h〉 [kpc] for normal and M51-type galaxies.
4 Parameters of the bulge
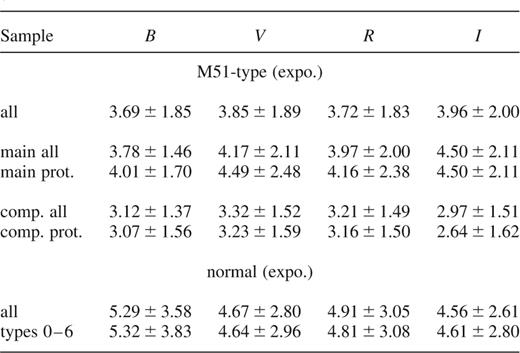
For normal galaxies, the effective surface brightness of the bulge decreases from early- to later-type galaxies (de Jong 1996), which has been suggested to characterize the Hubble sequence, while the effective radius is not correlated with the morphological type. Indeed, for normal galaxies the sizes of the bulges are not indices of the Hubble type at all, which can be seen by scaling the effective radius of the bulge by the scalelength of the disc. The mean re(bulge)/h values for different morphological types obtained by the exponential bulge model for normal galaxies are shown in Table 4: the ratio is nearly constant (0.13–0.16 in the B-band) for types Tm =0-8, being larger only for some Magellanic Cloud type Sm galaxies with Tm =9.
Mean effective bulge radius scaled to disc scalelength 〈re(bulge)/h〉 for normal and M51-type galaxies.
This is a good situation for comparisons with M51-type galaxies, for which the morphological types are poorly known. In Table 5 we show the mean effective bulge radii for the exponential model (for the R1/4-law model the variations in re for normal galaxies are too large for this purpose). Compared with normal galaxies, both the main galaxies and the companions had about 40 per cent larger re(bulge) in all bands, even though the standard deviations were large. The bulge sizes we obtained correspond more to those for S0–Sab galaxies than those expected by their observed Sb–Sc types. The bulges of the companions were extremely large, especially after scaling with the disc scalelength: while the main galaxies had nearly normal  , for the companions this ratio was 0.37±0.10. For comparison, for normal galaxies
  . The large re(bulge) values, we found for the companions are quite surprising, taking into account that they are on average almost 2 mag fainter than the main galaxies. This is true for all bands.
![Mean effective bulge radius 〈re〉 [kpc] for normal and M51-type galaxies.](https://oup.silverchair-cdn.com/oup/backfile/Content_public/Journal/mnras/324/3/10.1046/j.1365-8711.2001.04347.x/2/m_324-3-685-tbl005.jpeg?Expires=1749967813&Signature=hYAk7Won647iIvwznZQKPfP2gIdDdkZW0lY3lEgep3h~H6oQMvWJwYAkFa-0xWPUhdSD~TsUPUW8Q0F6~St7Ak4m5cYVbkQnYqy2rTXKqgnBGtsaKofN0C3kqpdsxC4mpk4jJE0hNIvgBdj67qOWIveEp3FSwhcJjtRcHiThsIrEjNocmnCo2ylU6YOtIriYBASCMLS50IiFepaZwAYjQ7jvlIhzxkArlpm-jL6vx71bJ518R5Vbyxmei~Zn7JjBw95afrtYYRBnkFm5mcV61hi5s7TXw5QCRN~PFyTdu8i-WMQhqOi2C0tgb0URZjiS1l4GJKrYeN5arLYuvji6Dw__&Key-Pair-Id=APKAIE5G5CRDK6RD3PGA)
Mean effective bulge radius 〈re〉 [kpc] for normal and M51-type galaxies.
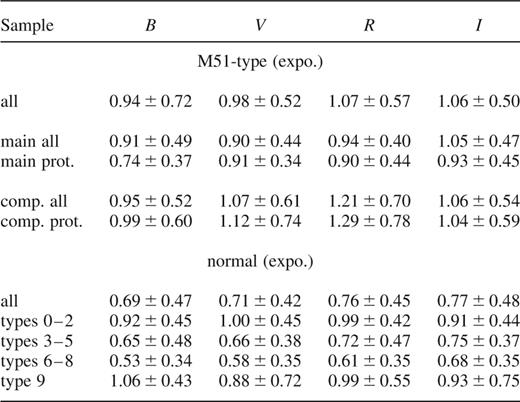
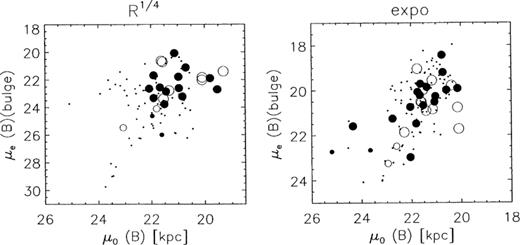
The effective surface brightness of the bulge depends strongly on the morphological type and therefore it is difficult to make any clear conclusions regarding the comparisons with normal galaxies. Anyway, as shown in Table 6, by including all morphological types for normal galaxies, the compared samples were rather similar. M51-type galaxies also showed rather normal behaviour in the re (bulge) versus μe(bulge) diagram shown in Fig. 2.

Mean effective surface brightness of the bulge 〈μe〉 for normal and M51-type galaxies.
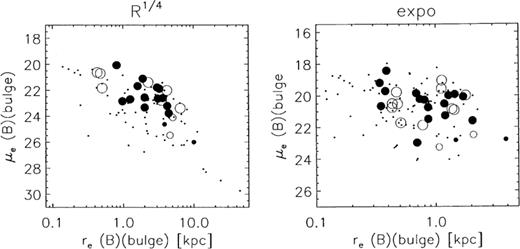
The effective radius of the bulge versus the effective surface brightness of the bulge for the two bulge models in the B-band.
5 Relation between disc and bulge parameters
In the models where the bulge forms first and the disc forms later, there is no reason to expect a strong correlation between the bulge and disc parameters. However, a correlation is expected if the bulge formed from the disc by intrinsic secular evolution, or if the bulge and disc were considerably modified during the interaction. We investigate this in the following by correlating h with re(bulge) and μ0 with μe(bulge), as shown in Figs 3 and 4.
The scalelength of the disc versus the effective radius of the bulge in the B-band.
The central surface brightness of the disc versus the effective surface brightness of the bulge in the B-band. Notice that normal galaxies with μe (bulge) > 22 in the right panel are all latest type galaxies with Tm =6-10.
The main galaxies did not show any characteristics deviating from the normal galaxies: μ0 had no correlation with μe(bulge) in either of the two bulge models used. In the h versus re(bulge) diagram, the main galaxies appeared in the same region as the normal galaxies, but their scalelengths were limited to a rather small range owing to our sample selection.
On the other hand, for the companions μ0 seems to have a positive correlation with μe(bulge) using the exponential model, which correlation does not exist for normal galaxies. Notice that in Fig. 4 normal galaxies with very low surface brightnesses all belong to the latest type galaxies with Tm =6-10. The companions with the lowest surface brightnesses are Arp 82 B, Arp 298 B, Arp 74 B and Kar 64 B. The companions had anomalous properties also in the h versus re(bulge) diagram, again using the exponential bulge model. Even though these parameters are correlated both for the normal galaxies and the companions of M51-type galaxies, the companions are clearly shifted towards a smaller scalelength or a larger re(bulge).
The bulge-to-disc ratio is one of the criteria for the Hubble classification. Indeed, for the main galaxies in our sample, the morphological type was correlated with the B/D-ratio for galaxies of known morphological type (see Fig. 5). It is also obvious that for the companions the B/D-ratio was completely independent of the Hubble type. In fact, the B/D-ratio was high for all companions and at all wavelengths, the values being generally larger than for any of the morphological types of normal galaxies. The only exception with a smaller B/D-ratio is Kar 64 B. The galaxies with large bulges in our sample are probably different from the Magellanic Cloud type galaxies (Tm =9) also showing a tendency to have large bulges (see Table 5).
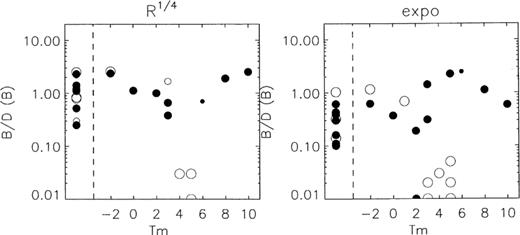
The B-band bulge-to-disc ratio as a function of morphological type. In the left of the plots, separated by the dashed line we denote the galaxies for which the morphological types were not given in RC3.
6 Shallow outer profiles
We have seen above that the bulges of the companions in the M51-type pairs are large compared with the scalelengths of their discs. An interesting question is then whether this is due to interaction effects and if so what the interactions have done to these galaxies? Has material mainly been redistributed to a more compact form during the disturbance reducing the exponential scalelengths, or did the encountering galaxies have originally nearly equal masses? In addition, in Part II we showed that quite a few of the galaxies in our sample have shallow outer profiles. In principle, this kind of profile can be understood by means of material stripped from the discs. However, by simply looking at the azimuthally averaged profiles one cannot be sure whether there really exist extended discs, or are the shallow profiles just caused by the open tidal structures seen in many M51-type galaxies?
In Fig. 6a we show the observed azimuthally averaged surface brightness profiles for the M51-type systems. Better to emphasize the shape of the outer profiles, the intensity profiles were also normalized by the fitted exponential model and the radius by the scalelength of the disc (Fig. 6b). In the latter plot the shallow portions correspond to the outer rising parts in the profiles typically seen beyond 3–4 h. It is evident that galaxies with shallow outer profiles are more characteristic of the ‘prototypical’ M51-type galaxies than for pairs with larger galaxy separations. Identification of the shallow profiles is a delicate matter and has been discussed at length in Part II. For example, bad sky subtraction can easily cause similar structures. Also, as we study close interactions, superpositions of some parts of the discs are evident in many cases. However, that was taken into account while measuring the intensity profiles: the region contaminated by the companion was excluded and the affected data points were compensated with the mean values of the good regions in the measured annuli.
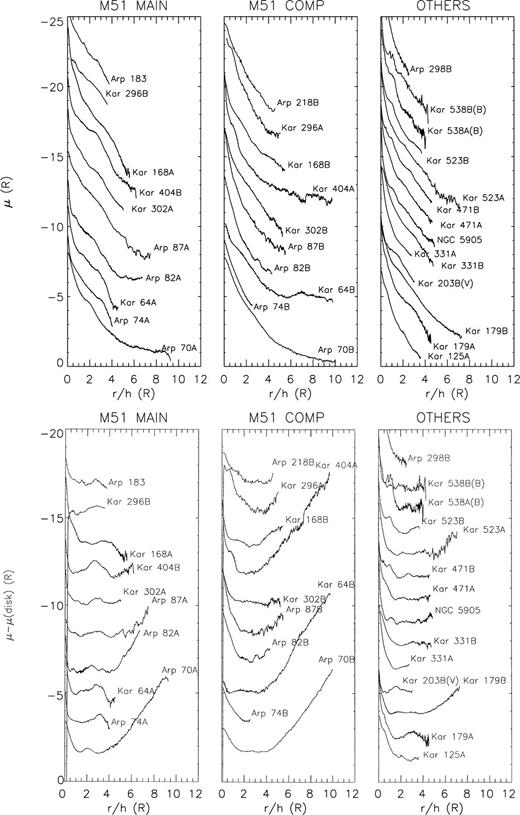
The observed R-band surface brightness profiles for M51-type galaxies. If R-profiles were not available, then V- or B-band profiles are shown (indicated in parenthesis). The left and middle panels show the ‘prototypical’ main galaxies and companions and the right panel the pairs with larger galaxy separations. Radius is scaled with the scalelength of the disc and in order better to illustrate the shallow outer profiles; in (b), the fitted exponential profiles were subtracted from the surface brightnesses. So as not to overlap the profiles, they have been shifted vertically.
In principle it is also possible that the shallow outer profiles are not properties of the discs themselves, being rather manifestations of the open tidal arms, caused by the gravitational forces of the companion. Therefore we investigated more carefully the outer profiles of Arp 70 A and B, Arp 82 A and B, and Kar 179 B. The profiles were remeasured by eliminating those parts of the images where the spiral arms appeared pronounced in the outer discs. Thus, if diffuse extended discs exist, the shallow profiles should also be visible in these measurements. Indeed, extended discs were found in all the remeasured galaxies. These measurements can also be used as an additional test to confirm that the shallow outer profiles are not caused by contamination of the neighbouring galaxy: namely measurements in different sections of the intensity profile gave similar outer profiles. Shallow outer profiles have been previously detected by Bagget et al. (1998) in 2 per cent (18 galaxies) of the galaxies in a sample of spiral galaxies, but similar profiles were not found by Reshetnikov et al. (1993) for interacting galaxies. The lack of detection of shallow profiles by Reshetnikov et al. may be related to their way of measuring the profiles. As possible superpositions of the discs were not intended to be eliminated, the intensity profiles could not be followed to very low surface brightnesses, where the shallow parts of the profiles reside. It is worth noticing that the profiles we found are different from that obtained by Chromey et al. (1998) for a strongly interacting galaxy NGC 3628, having a sharp cutoff before the flat outer region. Most probably, different kinds of mechanism are operating in these two types of flattened intensity profiles.
7 Comparison with simulations
It seems possible that the observed shallow outer profiles, and perhaps even the small scalelength of the inner disc relative to the bulge size for the companions, may be related to the interaction process. We investigate this scenario briefly by 3-dimensional N-body simulations. The aim is to follow the orbital evolution of an idealized pair, characterized by a slow orbital decay caused by the dynamical friction, leading to gradually increasing tidal deformation of the discs.
7.1 Simulation method
The simulations were carried out with a 3D multiple-grid code, based on the use of overlapping comoving logarithmic spherical-polar grids for the potential evaluation, combined with a Cartesian center-of-mass orbital integration. Both components of the pair were described with an exponential star + gas disc embedded in a live bulge and halo. The type of code we used is especially suitable for studies of interacting galaxies before the complete merging, because of the good resolution obtained simultaneously for both components. The simulation code has been described by Salo (1991) and Salo & Laurikainen (1993, 2000a) and the treatment of gas by Salo et al. (1999).
The simulation units were fixed by setting G =M = a =1, where G is the gravitational constant and M is the total mass within a =4hprim., hprim. denoting the exponential scalelength of the primary disc. The circular velocity at a is thus close to unity. For the primary galaxy, the disc mass is Md =0.333, the bulge mass Md =0.0625, and the halo mass Mh =1.75. The initial distribution of bulge and halo stars followed King models, with dimensionless central potentials W =3 and 7.5, respectively. Before starting the interaction, the bulge + halo + disc components were allowed to relax with respect to each other, following the method of Barnes (1988, 1990). The resulting rotation curve (Fig. 7) attains a maximum at about 2.5 h, and decreases slowly beyond this. The companion galaxy was described by a scaled-down version of the primary, with length scales divided by 2 and masses divided by 4. The stellar discs were presented by Nstar =100 000 and 25 000 particles for the main galaxy and the companion, respectively. A gas component was also included in terms of dissipatively colliding particles (40 000 and 10 000 particles for the primary and the companion, respectively). For bulge and halo, 5000 and 140 000 particles were employed for both galaxies.
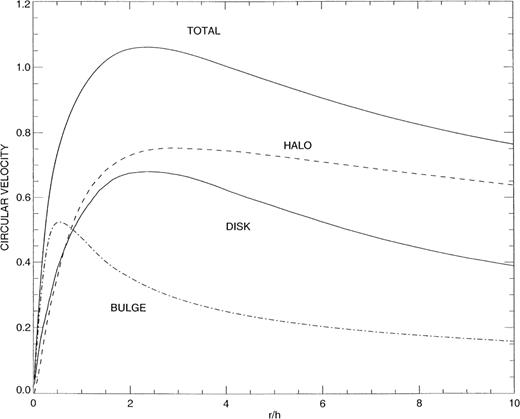
The initial rotation curve models for the simulated galaxies, with the bulge, disc and halo contributions shown separately. The initial bulge and halo star distributions followed King models and exponential discs were used. For a typical galaxy with a maximal rotational velocity of 200 km sec−1 and scalelength h =5, the total mass within 4 h equals about 1.6×10¹¹ Solar masses, and the simulation time unit corresponds to about 100 Myr.
In the present study we used a grid resolution with Nr =50 radial, Nφ =36 azimuthal and Nθ =19 latitudinal cells, with radial extent from 0.01 to 60 hprim.. The grid for each system is centered on the local minimum of its gravitational potential, searched on each step via a rapidly converging iteration process. The equatorial plane of the grid is oriented along the plane of the galactic disc. In each step, the particle's mass was added to the grid of the system where it originally belonged, with the cloud-in-cell assignment method, and the gravitational potential was evaluated in each grid cell with FFT and the force components with subsequent interpolation. Since the grid associated with a galaxy covers also the region of the other galaxy, this offers fast means for the evaluation of the gravity of both systems at each particle location. Besides the softening implied by the grid, the density was further smoothed by explicit gravity softening with ε = 0.05 simulation units.
7.2 Comparison with observations
Our brief survey with the above described pairs with a 1:4 mass ratio concentrated on the changes induced in the disc-mass distribution once the originally wide pairs had developed until they had morphologies corresponding to the typical pairs in our sample. Three different mutual inclinations of the relative orbit with respect to the primary disc plane were studied, with i =0°,90° and 180° (direct, perpendicular and retrograde passage). The initial orbital eccentricity was ≈0.25, and the companion was introduced in the apocentre of the orbit, at a distance of 16 hprim.. The spins of the two discs were parallel to each other, so that both components felt a similar type of perturbation. Owing to tidal friction, the radius of the relative orbit shrinks in each case by about 40 per cent during each revolution, so that successively stronger perturbation was felt by the components. As expected, in the direct encounter the discs were more affected than in the retrograde encounter, the perpendicular passage falling between these extremes. In the absence of perturbation, the simulation models for both the main galaxy and the companion were stable against any large-scale instabilities. A weak central oval formed in the interior (inside about one scalelength) but the azimuthally averaged profiles remained practically unaltered during a simulation lasting 40 time units.
We next look at the properties of the direct encounter (Fig. 8) in more detail. Notice that many of these simulated morphologies resemble the observed M51-type pairs in our sample (see Part I). For example, at T =25 the pair is very similar to M51 or Arp 86, and at T =30 more like Arp 82. In Fig. 9 the stellar surface density profile of the main galaxy is shown at different time steps for the run of Fig. 8. Owing to the perturbation, some of the outer disc material is drawn to the tidal bridges and tails, so that the disc starts to extend beyond the original outer truncation at r =8h. Initially, the azimuthally averaged density profile showed a steeper slope beyond the original disc region, but as the simulation proceeded, the outer profile became more and more shallow. Simultaneously, the profile of the inner disc was steepened, resulting in a transition zone between the inner and outer disc profiles. This zone moved inwards with time. At T>20, when the overall morphology of the pair was very reminiscent to our ‘prototypical’ M51-type pairs, the outer shallow profiles were seen beyond about 3-4h, the simulated profile being very similar to some of our observed profiles in Fig. 6.
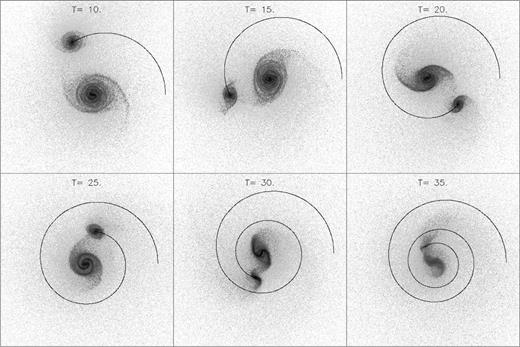
Snapshots from a direct planar encounter between galaxies with mass ratio 1:4. The distribution of both gas and stars is overplotted. The size of the frames corresponds to 40 hprim.. In each frame, the time in simulation units is indicated, counted from the beginning of the simulation.
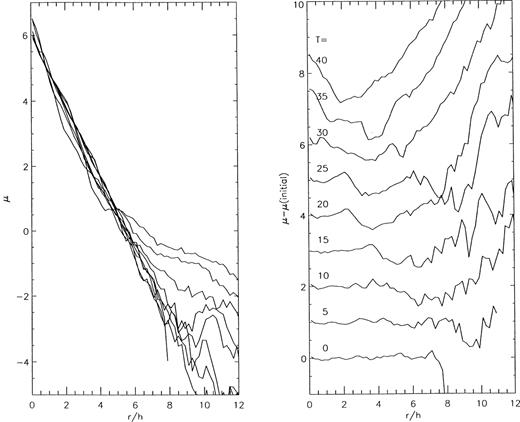
The evolution of the azimuthally averaged surface density profile of the main galactic stellar disc in the simulation of Fig. 8, shown in magnitude units. In the right panel, the profiles have been normalized by the initial profile, and the resulting profiles at each time step have been shifted vertically. This can be compared directly with Fig. 6b.
In the perpendicular, and especially in the retrograde passage, the profiles were less affected, showing, however, the same qualitative evolution at later stages. The steepening of the inner disc and the flattening of the outer profile were somewhat more pronounced for the companion than for the main galaxy, as may be expected since with our initial galaxy models the tidal perturbation felt by the companion was about twice that for the primary galaxy. Also, in the planar case there was considerable material flow from the main galaxy to the companion, amounting to about 1 and 4 per cent at T =25 and 30 in the run shown in Fig. 8. (counted as the relative fraction of the main galaxy gas particles ending up within 4hcomp. of the companion centre). Inclusion of this material to the companion profile would considerably enhance its outer shallow portion. However, as discussed in Salo & Laurikainen (1993) the amount of mass transfer is very sensitive to the original distribution of material and to the orbital inclination. For the perpendicular case there is no material transfer, and also in the case of retrograde passage the amount truly captured is greatly reduced, owing to the roughly opposite directions of the velocity of the incoming material with respect to the orbital velocities in the companion disc (see the example in Salo 1991).
In the above simulations with shrinking bound relative orbit, the modified profiles appeared at phases of evolution where the pairs had typically experienced two or more close encounters. Another experiment with a perpendicular encounter was also made, with an initially parabolic orbit, leading to a single close passage at a distance of 8hprim.. Also, this model led to a qualitatively similar behaviour after the close passage, although due to shorter duration of the perturbation the profiles were less affected. However, the shallow outer profiles remained visible for several Gyr after the passage.
In order further to illustrate the strong influence of the orbital geometry on the effects of perturbation on the profiles, Fig. 10 displays an example of a run where two similar systems, but with opposite spins, were interacting. The encounter took place in the plane of the galaxies and thus the perturbation felt by one of the components of the pair was direct and that by the other was retrograde. It is worth noticing that even though the original masses of the encountering galaxies were identical, after T =15 the pair looked much like the typical M51-type pairs with the direct component having much more compact appearance. An example of the bulge +disc stellar profiles during this run is shown in Fig. 11 for T=15. For the retrograde component of the pair, the disc profile is very close to the original one, except for a slight rise in the outer part, whereas simultaneously for the direct component especially the inner disc has been considerably enhanced. On the other hand, bulges were in both cases practically unaltered. In the profile of the direct component we can see a similar steepened inner disc as visible for example in the observed profiles of Kar 168 A, Kar 64 A, Arp 87 A and in Kar 331 A (see fig. 4 in Part II).
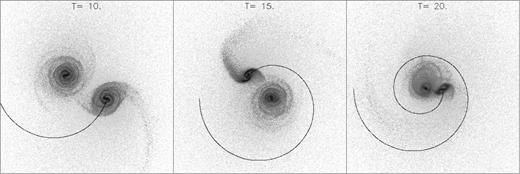
Snapshots from a planar encounter between galaxies with mass ratio 1:1. The direction of the spin of the galaxies is opposite: the orbit of the galaxy experiencing a direct encounter is shown with respect to the galaxy experiencing a retrograde encounter. Notice that at T=15-20, the galaxy that feels a direct encounter looks much like the small companions in M51-type pairs.
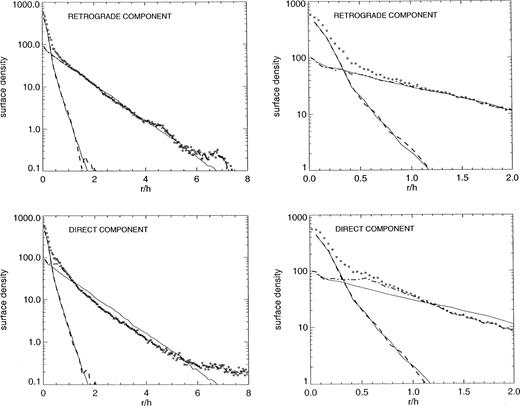
In the upper left panel, the bulge + disc stellar surface density (open squares) is shown for the galaxy experiencing a retrograde encounter in the simulation displayed in Fig. 10 at T=15. The bulge and disc contributions are also shown separately, by dashed and dash–dotted lines, respectively. Thin solid lines indicate the original disc and bulge profiles. In the upper right panel, the central parts of the same profile are shown. The lower row corresponds to the simultaneous profile of the component that has felt a direct perturbation.
It is interesting to apply a similar photometric bulge-to-disc decomposition method to simulation data used in Part II and in Section 2.2 of this paper for the observed profiles. In Fig. 12 this is done for the profiles of Fig. 11. For the retrograde component, the exponential bulge model yielded practically correct results B/D=0.16, whereas for the direct component the fit misinterpreted the inner ‘bump’ of the disc profile as belonging to the bulge, leading to a considerably overestimated bulge scalelength and thus B/D-ratio. It is also worth noticing that the R1/4-law bulge model failed badly in both cases. In fact, for the direct component the fit with the R1/4-law bulge model was near to the case where the whole profile could be fitted by a single function, which was the case for some of our observed profiles, as for example for Arp 86 B. The R1/4-law bulge model also overestimated the B/D-ratio when applied to the unperturbed profiles (the fit gave B/D=0.91 instead of the actual ratio of 0.17). This could partly follow from the bulge model used in simulations, which does not necessarily correspond the bulge profiles in real galaxies. Nevertheless, this kind of analysis is powerful for studying the limitations of the bulge-fitting model, because in simulations the true masses of the bulge and the disc are known. Above all, our analyses imply that one must be cautious with the deduced bulge-to-disc ratios derived, especially for strongly perturbed systems.
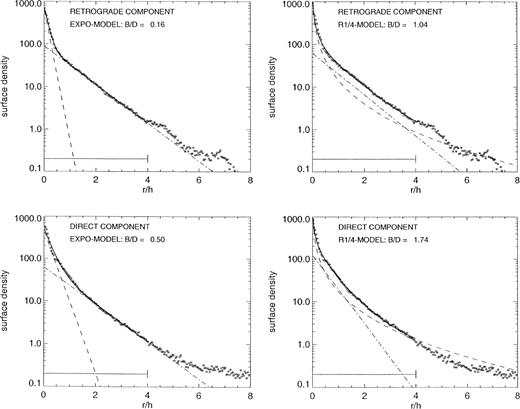
Bulge-to-disc decomposition methods applied to simulated profiles in Fig. 11. The upper row shows the bulge-to-disc fits made both with the exponential and R1/4-bulge models, for the component feeling a retrograde perturbation. In the lower row, similar fits are shown for the galaxy feeling a direct perturbation. Note that except in the fit by the exponential bulge model for the retrograde component, the fitted bulge-to-disc ratio is considerably overestimated. The horizontal bar shows the region used to fit bulge-to-disc decompositions (0-4h).
Redistribution of the disc mass is expected also by the internal effects of bars, without invoking any tidal effects, as discussed for example by Sellwood (1996) and by Lerner, Sundin & Thomasson (1999). The stars orbiting just outside the bar will be strongly perturbed in each orbit, and they can be either accelerated into a more eccentric orbit or deaccelerated into a less eccentric one. Therefore, the effects of the bar will not be limited to the bar region, but can extend throughout the galaxy. The net effect is that the length of the bar will increase, and the region in the near vicinity of the bar will be flattened, while the outermost part of the intensity profile will remain in its original form. In some circumstances, stars can even be ejected to distances outside the disc. Indeed, except for the outermost profile, the profile shapes in some of our observations fit with this picture.
In order to answer how importantly bars might affect the intensity profiles in our case, additional simulation studies should be performed. However, it is worth noticing that most galaxies in the Universe, not showing shallow outer profiles, are barred: 50–60 per cent in optical up to even 90 per cent in the infrared (see the review by Knapen 1999), and M51-type galaxies are not exceptional in this sense, about 50 per cent of them being barred. Also, the bars of the galaxies in our sample are generally not pronounced, and therefore we believe that in our case any possible effects of the bars on the redistribution of matter are overshadowed by tidal effects.
We have given here one possible explanation for the small observed scalelengths as compared to bulge sizes for the companions in M51-type systems. Recently, Burstein (2000) have found a subgroup of small disc galaxies with high B/D-ratios in a large sample of elliptical and early-type spiral galaxies. It will be interesting to see whether these small disc galaxies were formed with high B/D-ratios or if the mechanism presented here could have been in operation in some phases of their evolution.
8 Conclusions
We have compared photometric bulge and disc properties of interacting M51-type galaxies with those obtained by de Jong (1996) for normal spiral galaxies. For the bulges, both the R1/4-law and the exponential models were used. Some characteristic properties of the intensity profiles, like the shallow outer profiles and the large relative bulge sizes of the companions, were then interpreted by 3D N-body simulations. Both galaxy components were described with an exponential star + gas disc embedded in a live bulge and a halo. We generally waited until the pair had developed long enough to show the morphologies corresponding the typical pairs in our sample. Our main conclusions are the following.
- (1)
The central surface brightness μ0 of the disc was similar for M51-type and for normal galaxies with a mean value of
 according to the exponential bulge model. Using the R1/4-law model, μ0 was brighter for M51-type galaxies in comparison with normal galaxies, but the usefulness of that model, especially for interacting galaxies, was questioned.
 - (2)
The bulges of M51-type galaxies were generally somewhat larger than for the comparison galaxies, even though their disc scalelengths were slightly smaller. Most importantly, the bulges of the companions were extremely large in respect to their disc scalelengths. For the companions we found
 in comparison to
  for normal galaxies in the B-band. Consequently, the bulge-to-disc ratio, in the range 0.1–2 for the companions, was generally larger than for even the earliest type normal galaxies. Also, for the companions the B/D-ratio was totally independent of the Hubble type.
 - (3)
Contrary to that found for normal galaxies, μ0 for the companions in M51-type pairs was correlated with μe(bulge). The companions also appeared anomalous in that the h versus re(bulge) diagram was shifted towards a smaller scalelength. These correlations can be interpreted as indices of secular evolution induced by galaxy interactions.
- (4)
Many ‘prototypical’ M51-type galaxies showed shallow outer profiles, which were interpreted by simulations in terms of the stripping of stars and gas from the disc, which occurred in rather late phases of the interaction. In agreement with de Jong & van der Kruit (1994) no cutoffs were found in the profiles below 26 mag arcsec−2.
- (5)
Simultaneously with the modification of the outer profile, the inner disc was steepened, which process was somewhat more pronounced for the companions than for the main galaxies. Bulge-to-disc decompositions for the simulated profiles showed that the steepened inner disc can in some cases be erroneously interpreted as part of the bulge. Especially the R1/4-law model gave unrealistically large B/D-ratios. It was also shown that, even for the unperturbed intensity profiles, the R1/4-law model gave too large B/D-ratios, at least for the particular bulge model (King model) adopted in the simulations.
- (6)
As expected, the orbital geometry affected the results considerably. In direct encounters, the disc was more affected than in a retrograde encounter, even though the evolution was qualitatively similar in all types of passage. By assuming opposite spins for the encountering galaxies, it is possible to interpret some of the M51-type pairs as systems of two galaxies that originally had almost similar masses.
- (7)
An experiment with a nearly parabolic orbit showed that the redistribution of matter that occurred in the disc during the perturbation showed no sign of dying within several Gyr after the close passage.
Acknowledgments
We thank the referee Phil James for valuable comments. This work was supported by the Academy of Finland.
References
