


Abstract
The light curve and spectra of Nova Centauri 1995 (V888 Cen) are analysed. The spectra were obtained a few days post-maximum. The nova is found to be a very fast nova, declining by 2 mag within about 5±2 d of maximum. The light curve shows strong oscillations in the transition region, of peak-to-peak amplitude about 1.5 mag and period 12–15 d. The light curve of Nova Centauri resembles closely that of Nova Aquilae 1918 (V603 Aql).
The early blue and red spectra obtained at Mt John show broad emission lines, many with P Cygni profiles. The absorption lines are found in two velocity systems at about −1765 and −3010 km s−1, in respectively the principal and diffuse-enhanced stages of spectral development, as defined by McLaughlin. Nova Centauri has many Fe ii lines in emission, indicating that it is a member of the Williams Fe ii class of classical novae.
1 Introduction
Nova Centauri 1995 (V888 Cen) was discovered by Liller (1995) on 1995 February 23.31 at a visual magnitude of 7.2. The discovery was confirmed the following night. Further confirmation came from spectra and photometry which were reported from Mt John University Observatory in New Zealand on 1995 February 25, indicating that the object was a new classical Galactic nova (Hearnshaw & Watson 1995). Other spectroscopic observations were reported in the IAU Circulars by Benetti, Della Valle & Molendi (1995) and by Jablonski (1995), but no full analysis of the optical spectrum or light curve has hitherto been published.
The nova appears to be an example of an unusually fast nova, and the spectra from Mt John were obtained shortly after maximum light, probably within 3–4d of the outburst.
2 Observations
A total of 10 spectra were obtained at Mt John University Observatory by two of us (JBH, LCW) on 1995 February 25 and 26, all within 72 h of discovery. The instrument was the newly commissioned medium-resolution spectrograph (MRS) with the Thomson 384×576pixel CCD detector on the McLellan 1-m telescope. As it happens, these were the first spectra taken by us with this spectrograph, and some of the first recorded with it by any observers. The spectra were either third-order blue (60 Å mm−1, wavelength range 381 to 454 nm) or second-order red (90 Å mm−1, wavelength range 572 to 680 nm) with a wavelength resolution of about 0.1 nm. Respectively six blue and four red spectra were obtained. The spectra were reduced using standard procedures in midas.
Table 1 lists the spectroscopic observations. Unfortunately no observations were made at other grating settings, so that the region 454–572 nm was not recorded, nor was the far red beyond 680 nm.
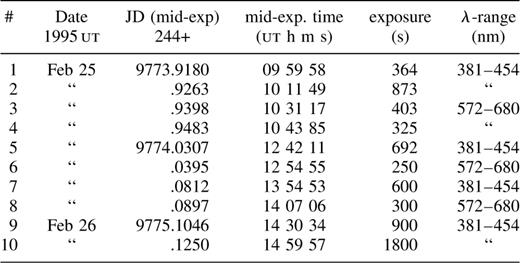
Mt John medium-resolution spectrograph observations of Nova Centauri 1995.
Photoelectric photometry in the UBV(RI)C system was obtained (by ACG) using the 61-cm O. C. Cassegrain reflector at Mt John on nine nights from 1995 February 25.415 to April 8.571 inclusive, during which time the visual magnitude declined from about 8.1 to 10.6. The comparison stars used were Cousins F-region standards F218 and F205. Table 2 lists the details of this photometry. Typical precisions are about ±0.01 mag in most indices. In addition, a total of 435 visual magnitude estimates of V888 Cen were obtained by courtesy of the Variable Star Section of the Royal Astronomical Society of New Zealand (Bateson, private communication). These began on 1995 February 25.02 ut and concluded on 1998 October 18.35. However, only that part of the light curve up to 1995 October, covering about 225 d, and 373 data points, is used in this analysis. The quality of these visually estimated magnitudes from many different observers is variable, and probably ranges from ±0.1 to a few tenths of a magnitude.
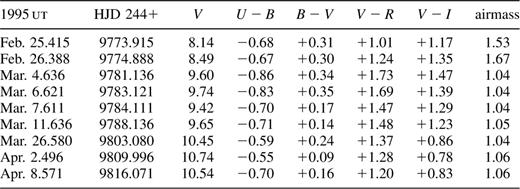
Mt John UBV(RI)C photoelectric photometry of Nova Centauri 1995.
3 Analysis of the light curve
3.1 Time of maximum
The light curve is shown in Fig. 1. The main characteristics are the following:
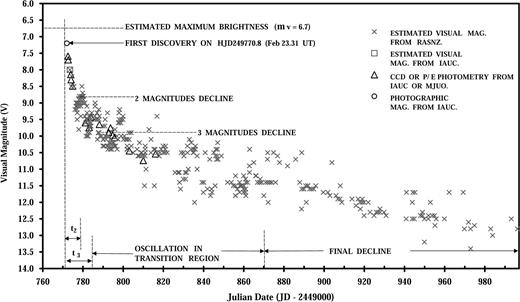
Light curve of Nova Centauri 1995.
- (i)
a steep and smooth early decline of about 1.5 mag (from V = 7:2 to 8.7), lasting from discovery (JD 244 9771.8) until 7 d later;
- (ii)
a transition phase marked by strong quasi-periodic oscillations of peak-to-peak amplitude up to about 1.5 mag and period about 12–15 d;
- (iii)
a final decline from about JD 244 9870 at V = 11.3 with a smooth and linear decrease in magnitude to V = 13.0 at JD 245 0000 (a uniform rate of decline of about 0.013 mag d−1).
The basic morphology of the light curves of classical novae was noted by McLaughlin (1936, 1939, 1943), in particular an early decline, a transition phase which occasionally shows oscillations, and a final decline. In this respect V888 Cen fits in well with the McLaughlin classification of light curve morphology. The oscillations of the transition phase were similar to those observed for V603 Aql in 1918 (the brightest nova at maximum light of the 20th century), in both amplitude and periodicity. According to Payne-Gaposchkin (1957), the oscillations are found to occur in about a quarter of all Galactic novae during the transition stage, but the fraction is about 38 per cent for very fast novae, of which this is an example.
The discovery of V888 Centauri by Liller on 1995 February 23.31 (Liller 1995) was after maximum light, but probably no more than 1 d later. The evidence for maximum having been at or after February 22.3 is as follows.
- (i)
All visual magnitudes are observed to be fainter with time, making it very likely that maximum occurred before discovery.
- (ii)
van den Bergh & Younger (1987) have shown that many if not all novae observed at maximum show a large sudden increase in colour index, lasting a few days, and occurring within 1 d of maximum. This reddening pulse was not observed for V888 Cen, suggesting that the pulse, if it occurred, was over by February 25.4, when photoelectic photometry, with the determination of colour index, commenced.
- (iii)
The observed part of the early decline was steep (1.5 mag in 7 d from discovery). If maximum occurred before February 22.3, the unobserved part of the early decline would have been even steeper, making V888 Cen not merely a very fast nova, but the fastest known.
Realistically, therefore, maximum is probably constrained to the interval February 22.3–23.3 or to February 22.8 ± 0.5.
3.2 Rate of decline
The rate of early decline of novae is related to their absolute visual magnitude at maximum light (McLaughlin 1942; Arp 1956; Schmidt 1957). Calibrations of this effect are usually based on the time for a fall of either 2 or 3 mag from maximum, respectively t2 and t3. If maximum occurred at February 22:8 ± 0:5, then  (by extrapolation), giving
  and
and  for declines of respectively 2 and 3 visual magnitudes. The error bars are those arising solely from the uncertainty in the time of maximum light.
Warner (1995) has noted that  a relationship which the above values for t2 and t3 for V888 Cen fit well. Once again, the similarity with the t2 and t3 values for V603 Aql in 1918 is noted
 These values, according to Payne-Gaposchkin (1957), put both novae in the rare class of very fast novae
3.3 Colour index and reddening
According to van den Bergh & Younger (1987), the intrinsic colour index 2 mag below maximum for novae is (B − V)0=−0.02 ± 0.04. This occurred at HJD 244 9776.4 ± 0.5, when the observed colour index (by interpolation) was 0.32, suggesting  and
and  provided that
A less reliable colour index criterion is that  at
at  after maximum (Buscombe & de Vaucouleurs 1955) at JD 244 9785.8, so
  at this time. The Mt John photometry would indicate
  giving
  by this method.
Alternatively, the visual extinction in the direction to V888 Cen can be estimated using the Galactic extinction and reddening data of Neckel & Klare (1980) and of Lucke (1978). Neckel & Klare suggest that AV = 1.26 mag to about 3.5 kpc in the direction  This would give a reddening of E
 provided that the calibration is valid out to the distance of Nova Centauri 1995, which is probably greater than 3.5 kpc.
In a very closely neighbouring direction, AV = 1.50 mag appears to be valid as far as 6 kpc, and in both directions there is little additional reddening beyond 1 kpc. We have therefore adopted the values of AV = 1.26 and E(B−V) = 0.39, which result in (B−V)0=−0.07 at 2 mag below maximum, in close agreement with the result for novae in general of van den Bergh & Younger (1987)
The data of Lucke (1978) suggest a reddening of at least 0.2 mag kpc−1 in  for the direction of V888 Cen, and possibly of 0.3 mag kpc−1, implying a visual extinction AV of 0.65 to 1.0 mag kpc−1. However, the calibration data are based on OB stars only to 2 kpc from the Sun, and it is uncertain what the extinction might be beyond that distance. It is noted that the total reddening of V888 Cen is unlikely to be much in excess of 0.5 in (B−V), or otherwise the intrinsic colour would be excessively blue. Therefore the rate of increase of reddening found by Lucke within 2 kpc is unlikely to be maintained as far as the nova, at a distance (Section 4) of about 7380 pc.
In summary, the most reliable values for extinction and reddening would appear to be  and
and  based on the Galactic extinction data of Neckel & Klare (1980).
4 Absolute magnitude and distance
Various authors have calibrated the rates of decline of classical novae in terms of absolute magnitude at maximum, the faster declines corresponding to greater maximum luminosity. Such a correlation was first noted by Hubble (1929) for novae in M31 and was further studied by McLaughlin (1942, 1945), who gave a calibration between MV(max) and t2. Warner (1995) has summarized some recent calibrations, starting with that of Schmidt (1957).
In this paper we consider three recent calibrations:
- (i)
- (ii)
- (iii)


The first is in terms of t3 (the time for a 3-mag decline from maximum) which is difficult to measure, given that the light curve showed oscillations of quite large amplitude about a week after discovery.
Only the calibration of Della Valle & Livio (1995) is non-linear in log t2, and for very fast or very slow novae (V888 Cen is very fast) this will give a different value for absolute magnitude from that which would otherwise be obtained. For this reason, the last calibration is preferred here.
The preferred value (last column of Table 3) is  where the error bar is that arising purely from the uncertainty in the time of maximum. The agreement with Cohen's (1988) calibration is very satisfactory.
Taking  then gives a distance modulus
  If
If  then
then  The large uncertainty comes both from the uncertainty in apparent magnitude at maximum and from the uncertainty in the true value of extinction at such large distances.
A second way of estimating distance comes from the absolute magnitude at t = 15 d, for which Capaccioli et al. (1989) estimate  and van den Bergh & Younger (1987) give
  . Combining these with
  gives
gives  in good agreement with the distance modulus evaluated at maximum light. The distance derived is therefore essentially the same as that derived from the photometry of the early decline. We note that at 15 d post-maximum the nova was in an oscillating transition stage which made interpretation of the light curve difficult, so less weight is given to this method.
A third and independent distance indicator comes from the interstellar lines of Na D1 and D2. Evans (1941) has given a calibration of mean equivalent width W as a function of distance d, based on OB stars within about 3 kpc of the Sun. We have measured the equivalent widths of the interstellar D lines in our spectra and obtained  and
and  with a mean value of 1.1 Å. This would result in
  using Evans’ calibration. This value is substantially less than that obtained from the photometry. Evans (1941) has also calibrated the relation between colour excess and D-line equivalent width, and this gives
  (albeit in an unspecified photometric system). Therefore we note that the interstellar D lines provide excellent confirmation for the reddening found by other methods.
Both extinction and the D-line equivalent width may be low for a star at such a large distance; however, this can probably be explained by the fact that at this distance V888 Cen would lie 340 pc above the Galactic plane through the Sun, and hence the line of sight may be clear of most of the interstellar dust and gas for most of this distance.
In summary, our best values for various parameters obtained from the light curve analysis are as follows:


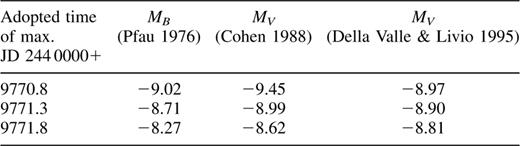
Absolute magnitudes derived from the decline rate.
5 Line identifications and velocities
The four red and six blue spectra do not show any appreciable evolution over the short time interval of the spectroscopic observations, except that the Balmer emission lines increase in strength relative to the continuum. The main spectral features are the following:
- (i)
very broad
 to 9 nm) and blended emission lines of low redshift;
 - (ii)
relatively narrow absorption lines (typically with FWHM ∼1.5 nm), in many cases as part of P Cygni profiles and with large blueshift from an expanding shell;
- (iii)
narrow interstellar lines of Ca ii H and K and of Na i D1 and D2.
Plots of the reduced spectra in the blue and red regions are shown in Figs 2 and 3 respectively.
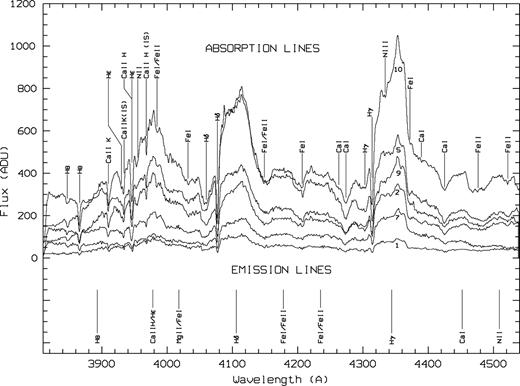
Blue Mt John spectra of Nova Centauri 1995.

Red Mt John spectra of Nova Centauri 1995.
As noted in Section 2, the spectral coverage is limited to 381–454 and 572–680 in the blue and red spectra respectively. We have attempted to identify all spectral features in absorption and emission visible in the spectra. Most features are seen in all spectra taken in a given wavelength region. Because of severe blending, many features have multiple possible identifications; we have been guided by the need for seeing the strongest lines in the most prominent multiplets of the most abundant light elements, with a consistent, although not necessarily single-valued, radial velocity, and also by line identifications in other bright novae.
In the emission lines, the Balmer series are the most prominent, together with features of Ca ii H and K, Na i D lines, and several features arising from Fe ii (multiplets 27, 28 and 74). Amongst the absorption lines, P Cygni profiles with radial velocities of both  in the principal spectrum and
  in the diffuse-enhanced spectrum, as defined by McLaughlin (1942, 1960), were clearly present. Absorption features of Hβ, Hγ and Hδ had absorptions at both these velocities, but in the case of Hα only the higher velocity diffuse-enhanced absorption could be found. High-excitation features such as He i (587.5-nm D3) could also only be found in the diffuse-enhanced spectrum.
The presence of strong Fe ii multiplets in emission suggests that V888 Cen belongs to the Fe ii class of classical novae, as defined by Williams (1992). No strong lines of [N iii], [N v] or [Ne iii], which are characteristic of the Orion spectrum stage in the development of a classical nova, were observed. This absence can be ascribed to the fact that the spectra were all recorded early on, within 4 d of maximum light.
Tables 4–7 give the identifications of the most prominent features in emission and absorption, together with the corresponding heliocentric radial velocities. The fact that the absorption radial velocities cluster about the two values quoted is unmistakable, and these are therefore the approximate expansion velocities of two separate expanding shells, the diffuse-enhanced shell being ejected slightly later and at higher velocity.
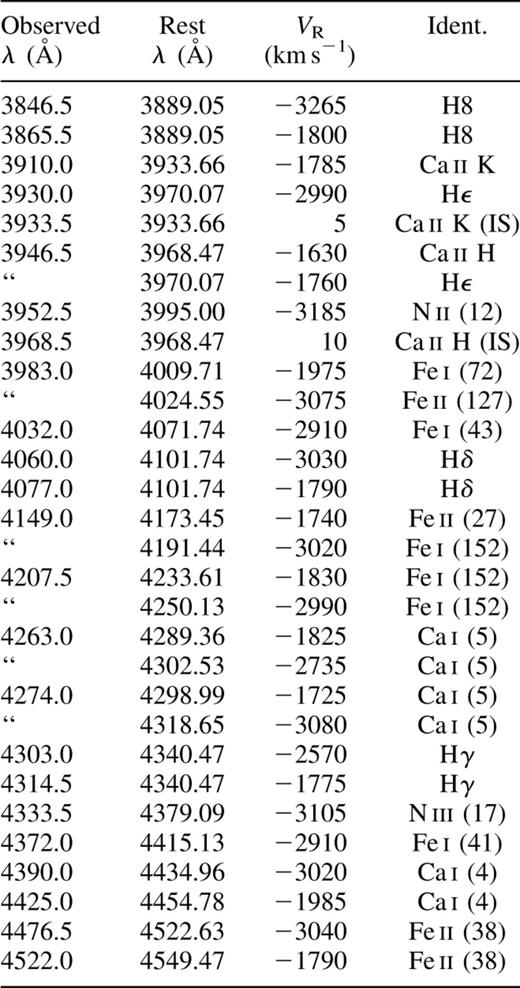
Absorption-line identifications in Nova Centauri, blue region. (Features with multiple possible identifications have a ditto (“) in the observed wavelength column. A barycentric correction of 18.6 kms−1 has been applied to all observed Doppler shifts. ‘IS’ denotes interstellar.)
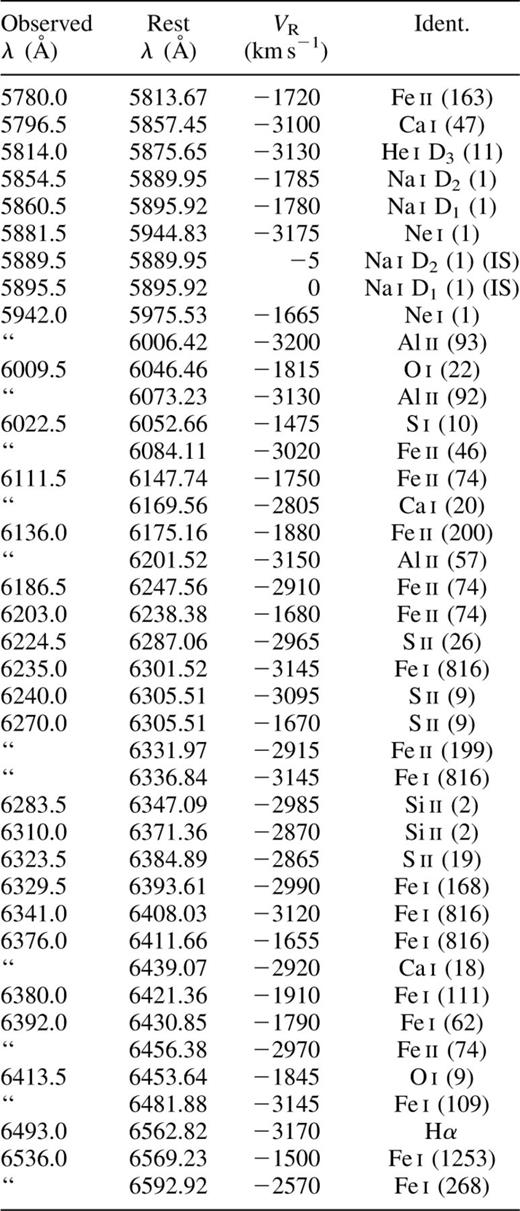
Absorption-line identifications in Nova Centauri, red region. (Features with multiple possible identifications are marked with a “in the observed wavelength column. A barycentric correction of 18.6 km s−1 has been applied to all observed Doppler shifts. IS denotes interstellar.)
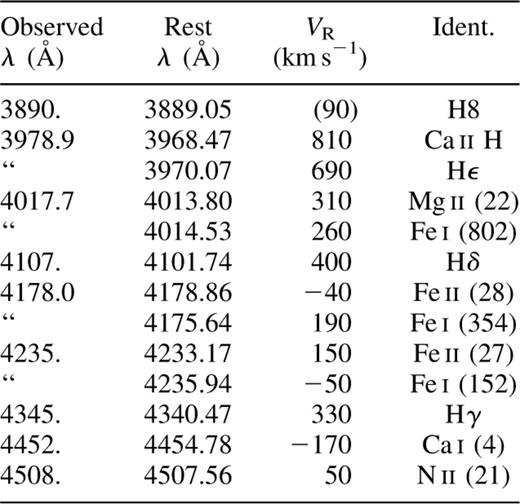
Emission-line identifications in Nova Centauri, blue region. (Features with multiple possible identifications are marked with a “in the observed wavelength column. A barycentric correction of 18.6 km s−1 has been applied to all observed Doppler shifts.)
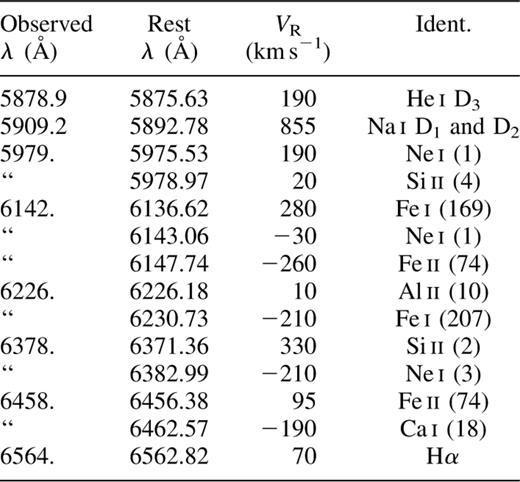
Emission-line identifications in Nova Centauri, red region. (Features with multiple possible identifications are marked with a “in the observed wavelength column. A barycentric correction of 18.6km s−1 has been applied to all observed Doppler shifts.)
The emission-line radial velocities in Tables 6 and 7 show a mean recessional radial velocity of about 155 km s−1, but within a fairly wide range of several hundreds of km s−1 about the mean. However, the centre of the very strong Hα line was consistently at a lower velocity  while higher members of the Balmer series in emission were found at progressively greater velocities (Hγ at 330 km s−1, Hδ at 400 km s−1 and Hε at 690 km s−1; the measurement for H8 is too uncertain to be taken into account).
The position of V888 Cen in the Galactic plane  would indicate, assuming circular Galactic orbits, a velocity of approach to the Sun of −24 km s−1 owing to differential Galactic rotation (based on d = 7380 pc). Therefore we interpret the positive emission-line velocities as being due to asymmetric expansion of the ejecta, the far side of the shell dominating for one or both of the ejected shells.
McLaughlin (1960) has related the expansion velocities from the absorption lines to the rates of light curve decline, the higher decline rates corresponding to a higher velocity of the ejecta. His calibrations for the principal and diffuse-enhanced spectra give


If  (Section 3.2) then
and

which are in very satisfactory agreement with the observed mean values of expansion from the absorption lines. It is noted that other very fast novae have had similar expansion velocities; for example V603 Aql (Nova Aql 1918) had 
 (Wyse 1940), and V1500 Cygni (Nova Cygni 1975) had respectively −1600 and −4000 km s−1 (Duerbeck & Wolf 1977), the ratio
  being
being  in all three cases.
Acknowledgments
We are grateful to the CDCHT and Intercambio Cientifíco (both from the Universidad de Los Andes) and to Fundacite-Mérida for their support for the visit of JBH to the Universidad de Los Andes. One of us (PR) thanks Project C-1021-00-05-B. We thank M. Bode for helpful comments as a referee of this paper.
References
