


Abstract
We have extended our previous analysis of morphologically selected elliptical and S0 galaxies in the Hubble Deep Field (HDF) North to include Hubble Space Telescope (HST) data in the HDF South and the HDFS—NICMOS areas. Our final sample amounts to 69 E/S0 galaxies with K<20.15 over an area of 11 arcmin2. Although a moderately small number over a modest sky area, this sample benefits from the best imaging and photometric data available on high-redshift galaxies. Multi-waveband photometry allows us to estimate with good accuracy the redshifts for the majority of these galaxies, which lack a spectroscopic measure. We confirm our previous findings that massive E/S0s tend to disappear from flux-limited samples at z>1. 4. This adds to the evidence that the rest-frame colours and spectral energy distributions (SEDs) of the numerous objects found at 0. 8<z<1. 2 are inconsistent with a very high redshift of formation for the bulk of stars, while they are more consistent with protracted (either continuous or episodic) star formation down to z≤1. These results based on high-quality imaging on a small field can be complemented with data from colour-selected extremely red objects (EROs) on much larger sky areas: our claimed demise of E/S0s going from z=1 to z=1. 5 is paralleled by a similarly fast decrease in the areal density of EROs when the colour limit is changed from (R−K)=5 to (R−K)=6 (corresponding to z≃1 and z≃1. 3 respectively). Altogether, the redshift interval from 1 to 2 seems to correspond to a very active phase for the assembly of massive E/S0 galaxies in the field, and also probably one where a substantial fraction of their stars are formed.
1 Introduction
The evolution with redshift of the mass function of bright galaxies is an important discriminant among competing cosmogonic scenarios. Present instrumentation, including HST and large optical telescopes on ground, is close to providing decisive tests of these alternative schemes for galaxy formation.
The surface density of extremely red objects (EROs) has been recently used by Daddi et al. (2000) to constrain the epoch of formation and the evolution of elliptical galaxies in the field. These authors claim that the density of EROs with (R — K) ≥ 5 (the typical colour of an old elliptical galaxy at z ≥ 1) is consistent with the passive evolution of giant ellipticals, implying an early formation of the spheroidal population through violent starbursts at high redshifts (z ≥ 2.5). This formation paradigm for ellipticals has the nice feature of making clear and testable predictions.
On the other hand, hierarchical galaxy formation models (Kauffmann & Charlot 1998) predict that elliptical galaxies form through the merging of disc galaxies at moderate redshifts. This scenario is supported by other studies that emphasize a lack of massive ellipticals at a redshift greater than z ȣ 1.5 (Zepf 1997; Franceschini et al. 1998, hereafter FA98; Barger et al. 1999).
In particular, FA98 studied the photometric and statistical properties of a complete sample of early-type galaxies with K < 20.15 in the HDF North (HDF-N). The FA98 sample was selected on a deep K-band image from Kitt Peak, by applying a rigorous morphological classification scheme based on the observed surface brightness profiles. FA98 found that the vast majority of bright early-type galaxies in the HDF-N are located at z ≤ 1.3 and display colours indicative of a fairly wide range of ages. There is a remarkable absence in the FA98 sample of objects with z = 1.3. According to the passive evolution scenario, these objects should be easily detected, because of the luminous star formation phase expected to happen at these redshifts.
To enforce the statistical significance of these results, an extension of the analysis to different sky regions would be critical. For this reason, we extend the study to the HDF—South WFPC2 and NICMOS fields in this paper, by selecting a new complete sample of early-type galaxies and following the same prescriptions outlined in FA98 to process the data.
For consistency with previous analyses, we assume  s−1 Mpc−1 and
  with zero cosmological constant Λ.
2 Sample selection
The present analysis makes use of a collection of high-quality, deep images, well suited for the study of field galaxies and covering three different areas: (a) the HDF-N, (b) the HDF-S WFPC2 area and the (c) HDF-S NICMOS field. Our galaxy catalogue includes early-type objects selected in the near-infrared in such fields.
2.1 Optical and near infrared imagery
We defer the reader to FA98 for details on the HDF-N observations. The WFPC2 strategy adopted for the HDF-S (Williams et al. 1998) was similar to that adopted for the HDF-N. In particular, the images were taken in the same four bands (F300W, F450W, F606W, F814W), with similar total exposure times. For each filter, several exposures, obtained in dithering mode, have been combined in a single image with pixel scale of ∼0. 04 arcsec. The sky area covered by both HDF-N and HDF-S is 10. 6 arcmin2.
Da Costa et al. (1998) observed the HDF-S WFPC2 area from optical to near-infrared at the ESO 3. 5 New Technology Telescope (NTT). The optical observations were carried out using the SUSI2 camera in binned mode, yielding a scale of 0. 16 arcsec pixel−1. Infrared observations were obtained in the J, H and K bands, using the SOFI camera (scale of 0. 29 arcsec pixel−1).
The HDF-S NICMOS images were acquired using camera 3 with a pixel size of 0. 2 arcsec2 and the filters F110W, F160W and F222W. The dithered images were processed, drizzled and combined giving a final pixel size of 0. 075 arcsec2 and covering an angular area of ∼1 arcmin2.
The HDF-S NICMOS field has also been observed as part of the VLT—UT1 Science Verification program, using the Test Camera (VLTTC) at the Cassegrain focus and the U, B, V, R, I filters. The total field sampled covers 1.5 × 1.5 arcmin2 and the scale of processed images is of 0. 092 arcsec pixel−1 (Fontana et al. 1999).
2.2 The photometric filter
The criteria adopted to ensure a careful selection of the sample in the HDF-N, as well as the accurate treatment of photometric data in seven passbands (U, B, V, I: from HST imaging, by Williams et al. 1996; J, H, K: from KPNO imaging, Connolly et al. 1997) have been discussed in FA98 and Rodighiero et al. (2000). For the other fields we have applied the same selection scheme used by FA98. We refer the reader to those papers for a thorough description of the procedure, while for convenience we summarize the main steps below.
2.2.1 HDF-South-WFPC field
Our primary selection is in the K band, in order to minimize the biases resulting from the effects of K and evolutionary corrections. The sample of galaxies has been extracted from the SOFI-K image, running sextractor (Bertin & Arnouts 1996). As in FA98, to determine the limit of completeness in the K band (KL) for inclusion in our sample, we have used large simulated fields, including several HDF-like toy galaxies, and mimicked the image quality of the K-band image. Running sextractor on these synthetic frames allowed us to check its performance, determining the biases and the standard deviations of the magnitude estimates as a function of the surface brightness. We then derived the corrections that must be applied to the sextractor photometry and the limit for completeness KL = 20.2 (in the standard system). From the simulations we derived also an evaluation of the K-band limiting surface brightness observable in the field, μk∼ 23 mag arcsec2. An analogous procedure was used to derive, for each object in the selected sample, the corrected magnitudes in the J and H bands. We did not correct optical HST magnitudes.
2.2.2 HDF-South-NICMOS field
The same procedure has been adopted for the HDF-S NICMOS field. In this case, however, we have chosen the F160W-HST band (∼H) for source selection, because of the higher noise in the F222W image (K band). The importance of this field concerns its depth in the near-infrared (observed from the space), that allows to reach deeper limiting magnitudes. In particular, from the simulations we derived a magnitude of 22. 05 for the limit of completeness in the H band. As for the HDF-S-WFPC2 field, we computed the corrections for the J and K bands, and also for the ground based observations in the U, B, V, R and I bands. Note that the selection in the F160W band does not introduce appreciable bias with respect to the nominal K-band selection adopted in the other fields, because the typical spectra for z ȣ 1 E/S0 galaxies are flat between 1. 5 and 2. 2 μm and are contributed by similarly old stellar populations.
2.3 The morphological filter
We have used the Galaxy Automatic Surface PHOTometry tool (gasphot;Pignatelli & Fasano 1999, 2000) to perform the morphological analysis of all galaxies brighter than the proper limiting infrared magnitudes in the WFPC2 and NICMOS fields of the HDF-S.
This tool operates on CCD images and consists of three different steps.
- (i)
First, it exploits the basic extraction capabilities of sextractor to perform a simultaneous slicing of all selected objects with a given step of surface brightness (we used 0. 1 mag), providing luminosity, ellipticity and position angle profiles for each object as a function of the equivalent radius of the isophote.
- (ii)
Secondly, it gives an accurate, smooth representation of the point spread function (PSF) by averaging (with a k σ clipping procedure) the luminosity profiles of the stars identified in the frame.
- (iii)
Finally, it uses the generalized de Vaucouleurs law
 (where μr is the surface brightness at radius r and re is the half-light radius; Sersic 1968, see also Ciotti 1991), convolved with the proper PSF, to fit the equivalent luminosity profiles of galaxies, providing unbiased estimates of the profile parameters.
The performance of gasphot is presently undergoing a systematic investigation (Pignatelli & Fasano, in preparation) by means of both extensive simulations of toy galaxies of different morphological types and comparison with galaxy samples, the morphology of which has been previously estimated by visual inspection of images and profiles. Figs 1 and 2 illustrate some preliminary results of this analysis. In particular, in Fig. 1 we report the histograms of the Sersic index n obtained by running gasphot on a crowded artificial field containing 200 toy galaxies (with different magnitudes and radii) having exponential (100 objects) or r1/4 luminosity profiles. In Fig. 2 we show the correlation between the Sersic index (n) and the de Vaucouleurs morphological type (T) for a sample of galaxies in the cluster Abell 2670. In this case the morphological types were derived by visual inspection of the individual galaxies, complemented by luminosity and geometrical profiles obtained from detailed surface photometry (Fasano et al. 2001). From both the above figures the value of n given by gasphot appears to be a good indicator of the ‘true’ morphological type.
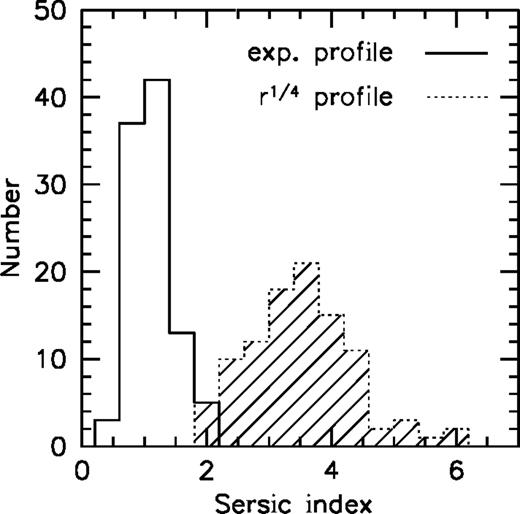
Histograms of the Sersic index n obtained by running gasphot on a crowded artificial field containing 200 toy galaxies with different magnitudes and radii. Galaxies with exponential profiles (100 objects) are binned with the solid line histogram, whereas the dotted line histogram refers to galaxies with r1/4 profiles.
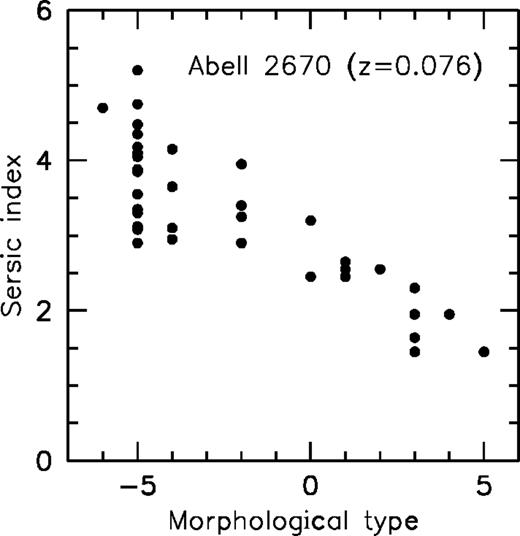
Correlation between the Sersic index (n) and the de Vaucouleurs morphological type (T) for a sample of galaxies in the cluster Abell 2670. The morphological types were derived by visual inspection of the individual galaxies, complemented by luminosity and geometrical profiles obtained from detailed surface photometry (Fasano et al. 2001).
According to Fig. 1, after running gasphot on our high-resolution images, we decided to exclude from the final samples the galaxies with n ≤ 2 (considered late-type). In addition, we rejected the galaxies with early-type classifications that were judged dubious from a visual inspection (three objects in the WFPC2 field and one object in the NICMOS field). The final sample includes the 35 E/S0 galaxies extracted from the HDF-N in FA98, 28 galaxies from the WFPC2 field and 11 galaxies from the NICMOS field, for a total of 74 objects. Note that only six galaxies in the NICMOS field are brighter than the completeness limit for the WFPC2 fields (KL = 20.15).
In Table 1 we report the data of our sample: coordinates (at J2000), photometric redshifts and the observed K mag (the data for HDFN galaxies have been published in FA98).
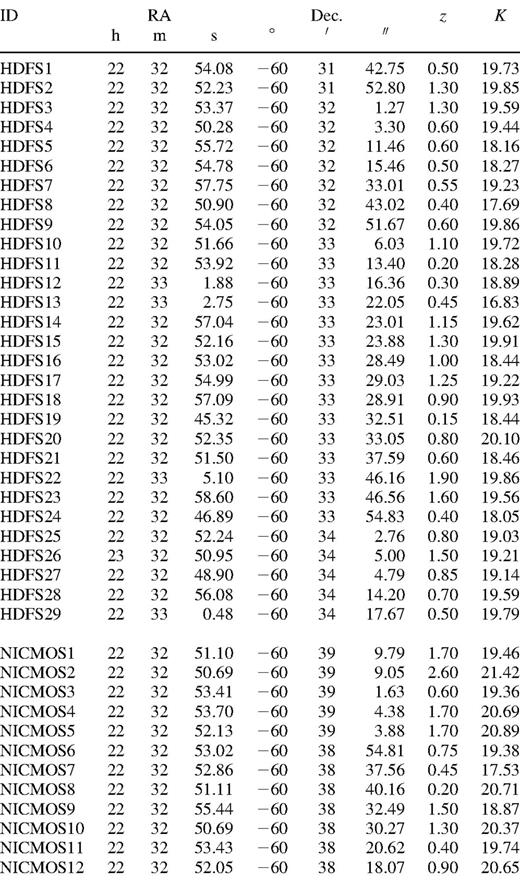
Data for the sample galaxies.
3 Analysis of the broad-band spectra
3.1 Tools for spectral synthesis
The observed UV—optical—near-infrared spectra of the sample of E/S0 galaxies presented in this work have been fitted with spectrophotometric models describing their integrated emission. In order to check the consistency of our approach, we decided to compare the results from two different codes: grasil (Silva et al. 1998) and pegase (Fioc & Rocca-Volmerange 1997). As in FA98, we have considered two models describing the spectral behaviour of elliptical galaxies. We adopt a Salpeter initial mass function (IMF) with a lower limit Ml = 0.15 M⊙ and a Schmidt-type law for the star formation rate (SFR):  where ν is the efficiency and Mg(t) is the residual mass of gas. A further relevant parameter is the time-scale tinfall for the infall of primordial gas. The evolution patterns for the two models considered here are obtained with the following choices of the parameters. Model 1:
 Model 2:
 The corresponding star formation (SF) laws have a maximum at galactic ages of 0. 3 (Model 1) and 1. 4 Gyr (Model 2), and are truncated at 1 (Model 1) and 3 Gyr (Model 2) to mimic the onset of galactic winds.
A χ2 fitting procedure has been adopted for the determination of the best solution for each galaxy spectrum. We use grasil as our reference model and use pegase only for comparison (the two give equally good fits).
3.2 Photometric redshifts and completeness
An application of spectrophotometric models is the determination of photometric redshifts. Our sample in the HDF-S lacks a complete spectroscopic coverage (40 per cent of sample objects in the HDF-N have measured redshift). We deemed useful to compare the grasil and pegase redshift estimates. There is a slight tendency for grasil to predict larger values of z, but in general the agreement is quite good (∼10 per cent).
The distribution in redshift of a flux-limited population of galaxies provides a constraint on its evolutionary history and on the epoch of formation. However, selection effects have to be taken carefully into account, in particular the surface brightness limit, the cosmological dimming and the K correction. Our selection in the K band minimizes K and evolutionary corrections as a function of redshift. Our evaluation of the effective radii allows us to control the effects of the limiting surface brightness (μk ȣ 23 mag arcsec2) observable in the K-band image. We found that the cut-off in surface brightness in the K image does not affect the selection above our limit of KL = 20.15, for redshifts up to z ∼ 2.5.
4 Results and discussion
4.1 Redshift distributions
Fig. 3 reports the observed redshift distribution of elliptical galaxies in the HDF-S (dashed histogram), compared with that in the HDF-N (continuous line). The two distributions clearly differ: the HDF-N distribution shows a peak at z ∼ 1, while in the HDF-S the peak is shifted toward lower redshifts (z ȣ 0.5). These differences can be explained in terms of clustering effects in the limited volumes sampled. It is worth noticing the global lack of bright spheroids in both fields at high redshifts. In particular, early-type galaxies seem to disappear at z ≥ 1.5. As this conclusion is now based on a significantly larger area than used by FA98, it is becoming more unlikely that this is caused by galaxy clustering effects [see further arguments about this in Section 4.3].
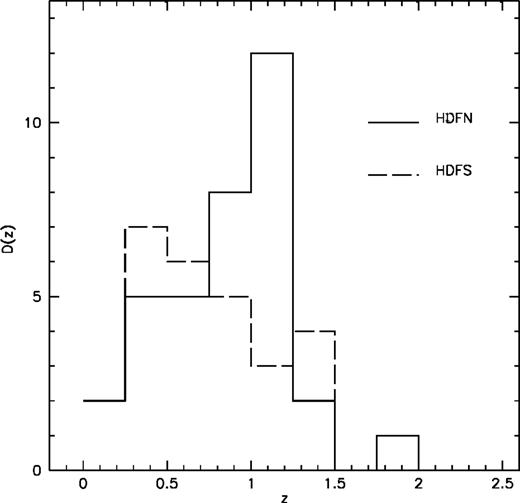
Observed redshift distribution in the HDF-N (solid line) compared with that in the HDF-S (dashed line).
In Fig. 4 the observed distribution (continuous line) relative to the total area of ∼11 arcmin2 (HDF-N + HDF-S-WFPC2 + NICMOS), for K < 20.15, is compared with the corresponding distributions predicted in the monolithic collapse scenario (dashed lines). The four panels report the predictions of Model 1 for increasing redshift of formation zF. Low values of zF appear to be consistent with the observed distribution (zF = 1.5 ∼ 2), while an early epoch of formation for field E/S0 seems to be ruled out (see also Nakata et al. 1999). In particular, 39 E/S0 galaxies would be expected at z > 1.5 for zF = 3 and 50 for zF = 4, compared with the two observed. Our data are more consistent with the hierarchical scenario, where large galaxies are predicted to form from the merging of smaller units. This finding is in agreement with Menanteau, Abraham & Ellis (2001), who estimate that at z ∼ 1 about half the field ellipticals must be undergoing episodes of star formation.
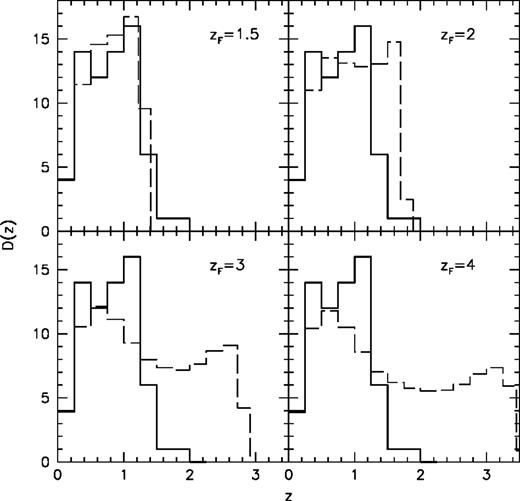
Observed total redshift distribution (solid lines), including our sample objects from the HDF-N, the HDF-S and the NICMOS field at the limiting magnitude of KL = 20.15. The data are compared with predictions based on Model 1 for different redshifts of formation zF (dashed lines), zF = 1.5, 2, 3, 4 from top left to bottom right respectively.
Among the solutions proposed to explain the demise of high-z ellipticals, FA98 consider the bias in the morphological filter against disturbed E/S0s (consequence of merging), which may become significant at z > 1.4. This point has been addressed by Rodighiero et al. (2001), who have analysed, in a way similar to that presented in this paper, a complementary sample of 52 late-type spiral and irregular galaxies selected in the same HDF-N area with total K magnitudes brighter than K = 20.47. One of their main conclusions was regarding the fact that only two out of 52 galaxies in the sample have z > 1.4. The lack of massive galaxies of any morphological kinds at high z supports the suggestion that the morphological selection of the spheroidal subsample is not responsible for its cut-off at z ≥ 1.4.
4.2 Ages and baryonic masses for the sample galaxies
The observed galaxy SEDs present two different types of spectral behaviour: red objects with spectra typical of old ellipticals, and blue objects that are flatter at all wavelengths, indicating the presence of residual ongoing star formation and a spread in the ages of stellar populations. Our χ2 fitting procedure led us to the same conclusions as found by FA98: model 2 with protracted star formation seems to reproduce better all kinds of spectral behaviour of galaxies in the HDF-S, providing a formally acceptable total χ2 of ∼290 (7-band data for 28 HDF-S galaxies), corresponding to a reduced χ2 of  Model 1 gives acceptable fits only for galaxies with red spectra, while the total χ2 ∼ 400 is unacceptably high
  This result supports the hypothesis that, on average, star formation activity in these galaxies occurs over protracted periods (3 Gyr in the model), rather than in short-lived single starbursts (at least when considering our limited set of models).
We compare in Fig. 5 the rest-frame (V — K) and (B — J) colours (computed from best-fitting solutions) of early-type galaxies as a function of redshift with the predicted colours of single stellar populations with solar metallicity. The colours for HDF-N ellipticals (open circles) are consistent with those found for HDF-S objects (filled squares), whereas the large spreads observed in both colour distributions correspond to a wide range of ages for the galaxies in the sample, typically from 1 to 5 Gyr. The figure shows a tendency for high-redshift ellipticals to be intrinsically bluer, in particular in the HDF-S, while the clumped distribution observed in the HDF-N at z ∼ 1 and V — K ≃ 2.5 likely indicates the presence of clustering at this redshift.
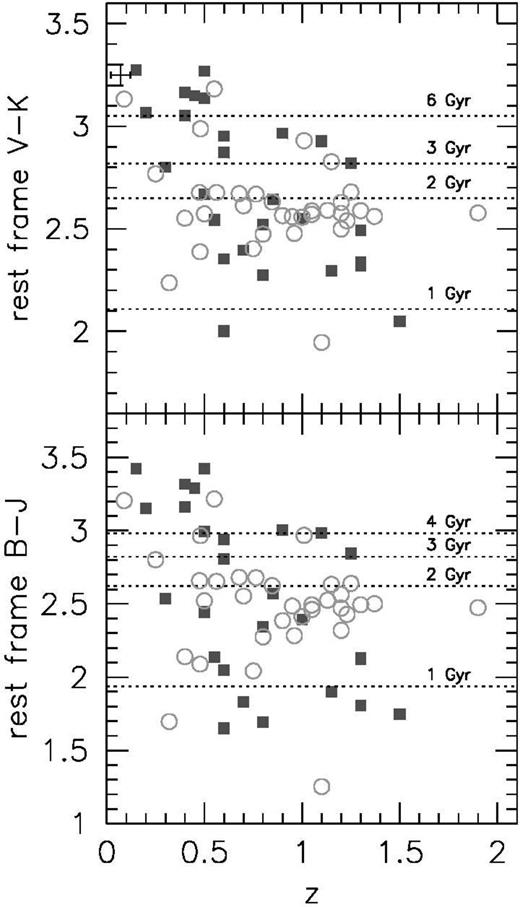
Rest-frame (V — K) (upper panel) and (B — J) (lower panel) colours of early-type field galaxies, compared with predicted values for single stellar populations with solar metallicity. Filled squares refer to HDF-S objects, open circles to the HDF-N.
We plot in Fig. 6 the baryonic masses of our sample galaxies as a function of redshift, and compare them with predictions of model 1 (dotted lines) and model 2 (solid lines) corresponding to the lowest galaxy mass still detectable within the flux limit of the survey (KL = 20.15) as a function of redshift. Different curves in the figure refer to various redshifts of formation zF (numbers attached to each curve).

The observed baryonic mass of the sample galaxies at  is plotted against the redshift. The curves represent the predictions of model 1 (dotted lines) and model 2 (solid lines) for the lowest galaxy mass still detectable within the flux limit of the survey
  as a function of redshift for various redshifts of formation (number attached to each curve). The error bar shows the mean uncertainty in the determination of the mass from spectral fitting, when considering the two different models.
In agreement with the results of Fig. 4, only low values of zF (≤2) are consistent with the observed mass distribution. In particular, the predictions of model 1 with  are inconsistent with the observed distribution, half of the sample galaxies having estimated masses lower than the prediction. This model fails to reproduce the broad-band spectra of each single galaxy. Model 2 with
  seems to reproduce the observations better, and provides an appropriate match with the lower envelope of the mass distribution. Several galaxies at
  have masses requiring a lower redshift of formation
We stress that Fig. 6 does not imply that ellipticals at  do not exist. Rather, according to the prescriptions of hierarchical models (Kauffmann & Charlot 1998), they are likely to be missed in our flux-limited sample because of their lower mass (and luminosity). This is strongly suggested by the location in Fig. 6 of the five objects selected in the NICMOS field and fainter than
  (three-pointed stars).
Benitez et al. (1999) have detected and identified in the NICMOS field four early-type galaxies at  with
with  (corresponding to
  Of these, ET2 (in the Benitez et al. list) is fainter than our limit of completeness, ET1 and ET3 are included in our sample, while ET4 has been rejected, as it is undetected in the VLT images and SEDs based on the NICMOS near-infrared data cannot be satisfactorily fitted with any of our galaxy models.
Benitez et al. suppose that the presence of luminous red galaxies at high z in a small field indicates that evolved  massive galaxies are common at
  They suggest that the absence of distant ellipticals claimed by others (FA98; Menanteau et al. 1999; Barger et al. 1999) may be due to the depth of the NICMOS data compared with ground-based infrared data (about 3 mag) or to clustering effects.
The present study is not inconsistent with the results reported by Benitez et al. First, we confirm the presence of a substantial number (21 out of 74) of E/S0 galaxies at z between 1 and 1. 4. We also prove the existence of E/S0 galaxies above  In particular, if we include the fainter NICMOS data, we find four early-types in NICMOS at
  with
with  Our claim is that the baryonic masses found for these high-z objects (typically a few 1010 M⊙ units) are typically lower than expected on consideration of the very massive
  galaxies detected around
  in our areas. The areal density of massive E/S0 as a function of redshift shows a drastic decrease, not a complete disappearance, above
All this seems to favour an evolutionary scenario where the bulk of luminous spheroids are assembled at relative recent cosmic epochs  although not as recent as supported by Kauffmann & Charlot (1998).
Obviously, the assembly of stellar populations into the dynamically relaxed shapes of spheroids could have occurred later than the birth epochs of stars. The distribution of redshift of formation for stellar populations in E/S0 has been quantified by FA98 in their HDF-N analysis. This showed that the bulk of stars formed at cosmic epochs between  and
and 
The results of a similar analysis of our combined sample are reported in Fig. 7. The histogram in the figure shows the mass in stars formed per unit comoving volume in the redshift bins. This estimate is based on our best-fitting photometric model solutions for all galaxies in the sample, by adding up the individual rates of star formation in the redshift bins. The mass is corrected for the portion of the luminosity function not sampled by our K-flux selection using the local observed luminosity function (LF) in the K-band (see FA98 for details on the computation).
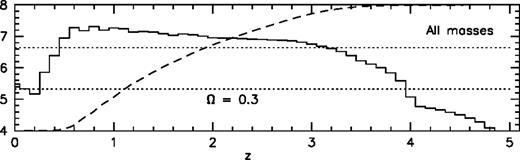
Distributions of the density of stellar mass per unit comoving volume generated in the redshift bin as a function of redshift (in M⊙ Mpc−3 born in the redshift bin). The dashed lines represent the cumulative distributions of the mass density generated as a function of redshift, on a linear scale ranging from 0 to 100 per cent. The dotted horizontal lines mark the 33 and 66 percentiles.
As shown by the figure, the history of formation of stars for this combined HDFN, HDFS, NICMOS sample is different from the partial result based on the HDF-N. The dashed curve is the normalized integral distribution: in the present case and for our adopted cosmology, 30 per cent of stars are formed at  40 per cent between
  and 2, and the remaining 30 per cent at
4.3 Effects of cosmic variance on searches for high-z spheroids
Clearly, cosmic variance affects results based on small areas such as the HDFs (see Section 4.1 and Fig. 3). Daddi et al. (2000; hereafter DA) showed that the surface density variations of the extremely red objects (EROs) population found in their survey can contribute to explain the discrepant results obtained by different authors regarding the density of  ellipticals. Similarly, Eisenhardt et al. (2000), using a selection of
  elliptical galaxies based on the
  colour, examined the surface density variation between their K-selected survey (124 arcmin2) and the HDF-N and argued that clustering can affect results based on small-area surveys. Actually, the cosmic variance is clearly apparent in our HDF-S and HDF-N catalogues (see Fig. 3, see also Lee & Hwang 2000).
Some insights about the effects of cosmic variance on our conclusions can be obtained by comparing results based on our small (11 arcmin2) area with data on the surface density of EROs derived by DA for a much larger sky area (∼700 arcmin2). DA define as EROs those objects with colours  They could be passively evolving galaxies at
  (with red colours because of the large K correction) or heavily dust-reddened, star-forming galaxies or AGN. Using the above definition of EROs, DA found a surface density of 0. 67 ERO arcmin−2 at the limit of their survey
  A more stringent colour criterion of
  should select objects at
  At the limit of
  they found a surface density of only 0. 10 ERO arcmin−2. If we adopt the same magnitude limit of
  the corresponding surface densities for
  and
and  ellipticals that we find in our sample are 0. 88 arcmin−2
 and 0. 17 arcmin−2
 Thus, in spite of the very different survey areas and selection criteria, the EROs statistics and our results about the fraction of E/S0 galaxies at high z turn out to be in quite good agreement. This supports our conclusions about the demise of bright massive spheroids at high redshifts.
This fast decrease of the areal density of E/S0 at  is likely to correspond to a fast evolution of the mass function at these epochs. Altogether, a very active phase not only for the assembly of massive E/S0 galaxies in the field but also for the origin of stellar population seems to happen around
  to 2.
to 2.
5 Conclusions
We have analysed a K-band flux-limited sample of 69 E/S0 galaxies in three different areas (HDF-N, HDF-S and the NICMOS field, for a total of ∼11 arcmin2) where deep HST data are available. This sample is uniquely suited, in terms of the quality of the imaging and photometry, to the study of high-redshift spheroidal galaxies.
Our main conclusions can be summarized as follows.
- (i)
We confirm the finding by FA98 that massive E/S0s tend to disappear from flux-limited samples at
 At least the assembly of massive spheroids has to take place efficiently in the redshift interval
- (ii)
The large spreads in the rest-frame colour distributions (both
 and
and  for the early-type galaxies observed at
  in our sample indicate a wide range of ages, typically from 1 to 5 Gyr. These objects are inconsistent with a very high redshift of formation for the bulk of stars, and are consistent with protracted star formation (either continuous or episodic) down to
- (iii)
Averaged over our (small) selected area, the bulk of stars (40 per cent) are formed in the redshift interval
 Of the remaining fraction, half form at
  and half at
- (iv)
Our finding of a demise of E/S0s at
 in small fields is confirmed for much larger areas by a similarly fast decrease in the number density of EROs, when the colour limits are changed from
  to
to  (corresponding to an increase of the redshift cut-off from
  to
to  for typical evolved stellar spectra).
 - (v)
Hierarchical models for the formation of spheroidal galaxies may naturally explain the present results.
References
