


Abstract
We have taken K-band spectra covering seven cooling flow clusters. The spectra show many of the 1-0S transitions of molecular hydrogen, as well as some of the higher vibrational transitions, and some lines of ionized hydrogen. The line ratios allow us to conclude that the rotational states of the first excited vibrational state are in approximate local thermodynamic equilibrium (LTE), so that densities above 105 cm−3 are likely, but there is evidence that the higher vibrational states are not in LTE. The lack of pressure balance between the molecular gas and the ionized components emphasizes the need for dynamic models of the gas. The ratios of the ionized to molecular lines are relatively constant but lower than from starburst regions, indicating that alternative heating mechanisms are necessary.
1 Introduction
Cooling flows result when the hot, X-ray emitting, gas in a cluster is compressed by the gravitational force of the central galaxy to a density where it can cool in less than the Hubble time (cf. Fabian 1994). In many cases 100–1000 M⊙ yr−1 condense out of the hot gas. They present at least two major unsolved problems: the ultimate fate of the gas after it has cooled, and the source of the copious optical line emission in the centre of the flows (Heckman et al. 1989; Voit & Donahue 1997, hereafter VD97).
A new aspect of both these problems was revealed by the detection of infrared line emission of H2 molecules from the centres of several CF clusters (Mouri 1994; Elston & Maloney 1994; Jaffe & Bremer 1997 (Paper I); Falcke et al. 1998; Genzel et al. 1998). This emission arises from dense gas at ∼2000 K and is not found in similarly radio-loud active galactic nuclei (AGNs) not associated with cooling flows. Thus it represents prima facie evidence for ‘cool’ material in cooling flows. Its spatial extent and energetics suggest an intimate association with the optical line emitting gas (Paper I). High surface brightness molecular line emission is generally concentrated within the giant central cluster galaxies (typically in the inner 10 kpc) in a similar manner to the emission from ionized gas. Both can be considered galactic-scale phenomena, even though the presence of the gas is statistically correlated with the presence of a cooling flow on larger scales (Paper I).
We do not yet understand the heating mechanism of the molecular gas, and cannot accurately estimate the mass associated with it. The mass in gas at 2000 K is only about 105–6 M⊙ but the cooling time from this temperature is very short, about one year. Without a consistent thermal model, we do not know whether this represents a minor mass component (the equivalent of only 1000 yr of CF mass accumulation) that is kept continually warm, or the tail of a cooler but much more massive molecular dog that is heated to IR temperatures by shocks, X-rays, or stellar photoionization.
In this paper we describe new K-band IR spectroscopy of six cooling flows taken with the United Kingdom InfraRed Telescope (UKIRT) on 1997 January 2 and 3. By studying the ratios between the various lines of H2 and between the H2 and H ii lines we hope to shed light on the thermal state of the gas, and ultimately on the heating mechanism. The clusters studied were Abell 0335, 478, 1795, and 2029, Hydra A, NGC 1275, and PKS 0745-19. They were observed with the CGS4 detector in the following configuration: 75 line mm−1 grating; 256 (spectral)× 84 (spatial) InSb array; slit size: 2 arcsec, spatial scale: 1 arcsec pixel−1, dispersion: 0. 0026 μm pixel−1.
2 Observation and reduction
The observations followed standard IR spectroscopic techniques. Each observation consists of a series of 60s frames, consisting of four subframes, each shifted 1/2 pixel in the spectral direction. The four subframes are combined into a single 514 × 84 frame.
We calibrated the atmospheric transmission by observing, with the same technique, standard stars about every 90 minutes. We chose the stars from the Carlsberg Meridian Catalog (Fabricius 1993) to be of early F type and within 10° of the target galaxies.
For any one-dimensional target spectrum we used the telluric calibrators to subtract the smooth underlying stellar continuum leaving only non-atmospheric absorption and emission features. Our procedure is to find emission lines in these spectra, and then correct the fluxes for the atmospheric absorption, rather than to first correct the spectra and then fit lines. For narrow lines, the former procedure is less sensitive to spurious lines created by minor atmospheric fluctuations. These steps are illustrated for the cluster PKS0745-11 in Fig. 1.
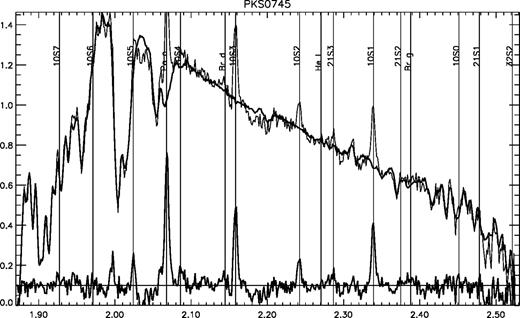
The top section shows the extracted spectrum and the best-fitting continuum fit, including telluric absorption. The bottom section shows the difference – the uncorrected emission profile. Wavelengths are in the telescope system.
We applied this procedure to the summed two-dimensional spectra for each cluster as follows. A continuum model, with atmospheric corrections, was subtracted from each row of the spectrum. This yields a two-dimensional spectrum with emission/absorption lines only. We then summed the spatial profiles of the strongest hydrogen emission lines. The resulting profile was compared to the spatial profile of temporally adjacent standard stars to determine the spatial extent of the emitting regions. Lastly the rows of the two-dimensional emission line spectrum were weighted by this spatial profile and summed to yield a single profile with the optimum signal-to-noise ratio for detecting weak lines, assuming that all lines have the same profile.
From the uncorrected spectra we determined, by Gaussian fitting, the line widths of the strongest H2 lines. We then searched for weaker lines by fitting Gaussians of this given width at the given wavelengths of a large number of H2, H ii, and metal lines. Because the position and width of the Gaussians were fixed, there should be no bias toward finding positive peaks. We estimated the uncertainties in the fitted fluxes empirically by applying the same procedure at 100 random points along the spectrum and producing a smoothed rms average of the fluxes so determined as a function of wavelength. This method includes residual telluric features.
As a last step, the line strengths are converted to physical units by correcting for atmospheric absorption and using the standard star magnitudes. In this process an estimate of the uncertainty in the absorption is added in quadrature to the uncertainty in the Gaussian estimate. The resulting flux and error estimates are given in Table 1 for each cluster except Abell 2029 where no lines were detected during 12 min of observation. Negative flux estimates indicate non-detection (rather than absorption) but are included for statistical completeness. The error estimates do not include the uncertainty of the absolute flux scale. This last uncertainty is relatively large because few of the Carlsberg calibrators have known K-band magnitudes, so their magnitudes were extrapolated to K-band from known B and R fluxes using a standard F-star spectrum. We estimate the additional uncertainty in the absolute line flux scale to be of the order of 30 per cent, but the relative line strengths within one spectrum, or in one cluster relative to another, are accurate at the levels quoted in Table 1.

Line fluxes from the studied clusters. Fluxes are in units of 10−16erg cm−2s−1.
3 Reduced spectra and derived quantites
In Fig. 2 we present the continuum subtracted and absorption corrected spectra for all clusters in physical units and in the rest wavelength frame. In Table 2 we present for each cluster the measured velocity dispersion of the brightest H2 lines, the radial extent of the emission (standard deviation of Gaussian fit along slit, deconvolved with stellar profile), the total luminosity in the detected H2 lines the luminosity in Paα, luminosity in Hα (Heckman et al. 1989, White et al. 1994 for Abell 478) and the excitation temperature T5:3,determined from the ratio of the 1-0S(3) and 1-0S(1) lines (cf. Section 4.2). The instrumental dispersion, measured on arc and sky lines was 240 ± 10 km s−1. This may be somewhat larger than the effective dispersion for emission that does not uniformly fill the slit. In comparing our luminosities with those of Heckman et al., determined by narrow-band imaging, our luminosities should be corrected for light blocked by the slit jaws. This can be crudely estimated by assuming circular symmetry and calculating the light lost in this case from the emission profile along the slit. This leads to corrections ranging from 1. 6 to 2, but these will be incorrect if the source is highly asymmetric, or if we have missed a very large, low brightness component. The latter possibility is particularly likely in the nearby cluster NGC 1275.
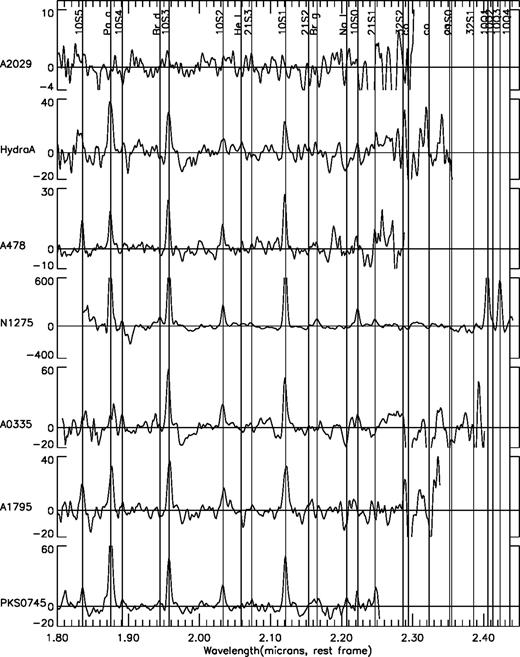
Calibrated and continuum subtracted spectra for the seven clusters studied. Wavelengths are in μm in the rest frame and the vertical scales are in 10−6 erg cm−2s−1 υ−1.
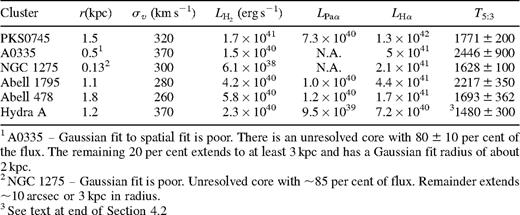
Quantities derived from analysis of the spectra.
The velocity dispersions, corrected for instrumental widening, run from 100 to 300 km s−1. These are comparable to the dispersions measured by Heckman et al. (1989) in Hα and are much smaller than the typical velocities in the clusters, the stars in the envelopes of cD galaxies or the ionized gas in the narrow- or broad-line regions around active nuclei.
4 Discussion
4.1 Optical extinction
The ratio of Hα to Paα fluxes should measure the extinction of the optical light. This ratio, for Case B H ii regions, should be about 7 (Osterbrock 1989), and values much below this would indicate dust around the emission regions. Unfortunately the fluxes are measured with different techniques: slit spectroscopy for Paα and narrow-band imaging for Hα. Hence the ratio is subject to uncertainties in the absolute calibration, and the flux lost outside of the spectroscope slit. For the four high-redshift clusters with good Paα fluxes, we have taken the ratio  where the factor of 2 corrects for slit losses. The values of the ratio are 10, 22, 7 and 4, with an average of 11. While the variation confirms the difficulties with calibration, we conclude that there is no evidence for strong extinction of the Hα fluxes (e. g. more than 1 magnitude).
4.2 LTE modelling of H2 line ratios
If the warm gas is sufficiently dense that collisional transitions dominate over radiative transitions from the relevant states, then we can regard the gas to be in LTE. We regard this case as a reference model and ask if the measured line ratios are consistent with this model. In Table 2, we have given the excitation temperatures derived from the ratio of 1-0S(1) and 1-0S(3) lines; in Fig. 3 we plot for each cluster log(F/ ag) versus Tu. Here F is the measured flux in each line, and a, g and Tu are the Einstein coefficient, statistical weight and energy (expressed as a temperature, Tu = Eu/k) of the upper state of the transition. In LTE, of course, 
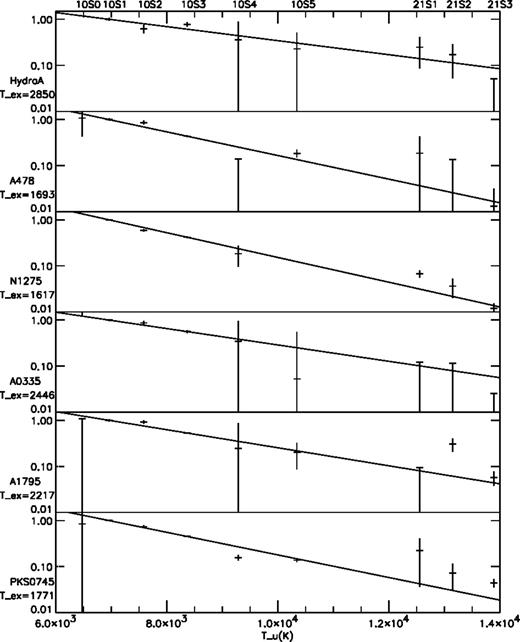
LTE diagrams for the six clusters with detected lines. For each cluster the plot shows logF/ag versus Tu with the straight line through the 1-0S(1) and 1-0S(3) points. For undetected lines, 2σ upper limits are given.
From Table 2 and Fig. 3 we conclude that the LTE model is a reasonable approximation for the 1-0 lines in all clusters, with excitation temperatures of ∼2000 K. There are some lines which deviate significantly more than the formal errors and these we have investigated individually. In some cases we have downgraded the significance of the result, because the line appears in a spectral region with a poor baseline. This is unfortunately true for many of the high excitation, but quite weak, 2-1 lines. By this standard, the remaining significant deviations from LTE are as follows.
- (i)
For NGC 1275, the 2-1S(1) lies a factor of 3 above the LTE model for 1617 K. This is the cluster with the highest signal/noise ratios. Krabbe et al. (2000) discuss deeper observations of this object, where 2-1S(1),S(3) and 3-2S(3) are clearly detected. They find the higher lines to require higher excitation temperatures: 2600 K versus 1500 K for the 1-0 lines and attribute this largely to fluorescent excitation by Lyα photons. They conclude that for most transitions collisional processes dominate, requiring ne > 105 cm−3.
- (ii)
For A478 and PKS0745, and marginally for N1275 the 1-0S(4) line lies about a factor of 2 below the model.
- (iii)
For Hydra A the ratio of 1-0S(3) to 1-0S(1) is so high (1. 9) that no plausible excitation temperature can be assigned. This is probably due to the fact that the 1-0S(3) line falls in a telluric absorption band at 2. 06μ and the correction for this is inaccurate. Excluding this line, the estimated excitation temperature for all the other 1-0S lines is 1480 ± 50 K.
4.3 Physical implications of the H2 emission
We conclude from the above analysis that for the clusters studied the rotational states of the first excited vibrational state are close to LTE. This implies a gas density high enough that collisional transitions state dominate over radiative transitions. Using collision cross sections from Allison & Dalgarno (1967) and Sternberg & Dalgarno (1989), modified using more recent results by Mandy & Martin (1993), at T = 2000 K a molecular hydrogen density n ≥ 106 cm−3 is required for an 84 per cent thermal population of the ν = 1, J = 7 level which decays through the H2ν = 1−0 S(5) line detected in A478 and PKS0745. For the remaining clusters, the highest line detected is H2 1-0 S(3) which is 83 per cent thermalized at n = 3 × 105 cm−3 Using collision cross-sections from Le Bourlot, Pineau des forëts & Flower (1999) would even increase these densities somewhat. On the other hand, if there is a significant electron abundance in the molecular gas, collisions with electrons would contribute to the excitation, decreasing the required densities. With a fractional ionization of 1 per cent, the required densities would be decreased by a factor of two, for a fractional ionization of 10 per cent the densities would be decreased by a factor of 10. Based on these considerations it is safe to conclude that the densities of the emitting regions are at least 105 cm−3, and possibly even higher. At these densities, the line ratios provide little information on the gas heating source, since the signature of non-thermal excitation processes such as UV-pumping or X-ray excitation is quenched, except in lines of very high critical density which are faint and not detected in the present data.
The high density and temperature of the gas emitting the near-IR lines imply high thermal pressures  exceeding by of the order 100 to 1000 that of the X-ray gas in the region near the galaxy
 or the ionized optical line emitting gas
 as estimated from the [S ii] doublet ratio (Heckman et al. 1989). The latter two phases have comparable pressures. Because of this, most models of the optical line emission in the literature assume pressure equilibrium with the X-ray phase. Some theoretical work has been done on the expected properties of the molecular phase in cooling flows (e. g. Fabian 1994). Our results make it evident that a dynamic, non-isobaric model must be used to self-consistently explain the ionized and molecular line emission.
One possible model suggested by the obvious pressure imbalance, and the strong linkage of the optical and K-band fluxes, is an ablative or ‘rocket’ model of the gas system. X-ray or UV-radiation could heat the surface layers of a cold, gravitationally bound, molecular cloud to 2000 K. At this temperature the gas is no longer gravitationally bound and will expand into the surrounding space. As the density decreases the material will ionize and emit the observed optical line emission. We will explore this model, and test the predicted line ratios, in a future paper.
4.4 Relation of H ii to H2 emission
In general, the H2 and H ii emission in cooling flows are similarly distributed. As noted in Paper I, the H2 and H ii emission lines correlate well spatially, energetically and kinematically. An extreme example of this is Abell 2029, which to date has shown no detectable Hα or H2 IR lines, although it is a strong cooling flow and strong radio source. In the two nearest clusters, NGC 1275 and A0335, the IR line emission is dominated by an unresolved, presumably nuclear component. This is partly an artifact of their large angular size which excludes some of the extended emission from the slit. Both of these cluster have in fact, an extended component, as do the spectra of all of the other objects.
More recently, two of the objects in our sample were imaged with H2 lines at high resolution with Hubble Space Telescope by Donahue et al. (2000). In the images, the H2 emission traces Hα emission. This implies that the H2 and H ii gas are cospatial on scales of a few hundred parsecs or less and strongly suggests that the excitation mechanisms of the two gas phases are either the same or closely coupled.
For the four clusters in Table 2 for which good Paα fluxes are available, the ratios of  range from 2. 3 to 4. 8
  The single line ratio
  ranges from 0. 6 to 1. 8 (mean 1. 0; rms 0. 4). Brγ is generally not detected; the estimated ratio to 1-0S(1) is less than 0. 15 in all cases.
The ratios of the H ii lines to the H2 lines are lower than those seen in ‘active’ comparison galaxies: Seyferts, starburst galaxies and ultraluminous infrared galaxies (ULIRGs). For all these galaxies, the ratio of Brγ/1-0S(1) is greater or equal than 1 (Moorwood & Oliva 1988, 1990; Puxley, Hawarden & Mountain 1988; Genzel et al. 1995; Goldader et al. 1995; Thompson 1995; Vanzi, Alonso-Herrero, & Rieke 1998; Genzel et al. 1998; Schinnerer, Eckart & Tacconi 1998; Murphy et al. 1999). We discuss the implications of this difference for UV-photoionization and shock excitation models below.
From the consistency of the line ratios, the spatial overlap, and the difference of the ratios from those of other active galaxies, we conclude that in most cooling flows the excitation of radiation from the ionized and molecular gas are causally related. This may not be true for some galaxies with exceedingly active nuclei. Cygnus-A for example shows a much higher ratio of Paα/ 1 − 0S(1) than we find (Wilman et al. 2000).
4.5 Excitation by stellar UV radiation
Some authors (e. g. VD97) have suggested that the optical spectra of cooling flows can be explained largely by stellar photoionization. This cannot be the case for the molecular gas detected here. The faintness of Brγ in the cooling flows, compared to starburst galaxies, argues against H2 excitation by star formation. Photo-ionization by the hottest stars is also known to be insufficient to account for the high electron temperatures in the ionized filaments of cooling flows, which thus already required an additional source of excitation (VD97). The addition of the IR spectra to the optical spectra then potentially requires three excitation mechanisms to be acting simultaneously, and in concert, to yield the uniform IR spectra presented here.
An additional diagnostic is provided by the ortho/para ratio, which is expected to be three (the ratio of the statistical weights) in situations where the high-temperature equilibrium ortho/para ratio is reached (Burton, Hollenbach & Tielens 1992). On the other hand, in regions where the H2 lines are UV-excited, a significantly lower ortho/para ratio is expected, due to spin-exchange reactions with protons and hydrogen atoms (Draine & Bertoldi 1996). Indeed, a low ortho/para ratio is observed in the extended H2 vibrational emission in the starburst galaxy NGC 253 (Harrison et al. 1998) and in regions of the well-studied Galactic photodissociation region in the Orion bar (Marconi et al. 1998) and the giant extragalactic H ii region NGC 5461 (Puxley et al. 2000). The low ortho/para ratio in UV-excited regions has been highlighted in the models of Sternberg & Neufeld (1999).
In all of our targets, the  S(1) (ortho), S(2) (para) and S(3) (ortho) lines are detected at high signal-to-noise ratio and there is no indication for a deviation from a ortho/para ratio of three in our sample. Together with the above discussion, this argues against stellar UV-excitation.
4.6 Shock excitation
A single shock model, where the various emission systems are produced in one gas stream that cools after the shock, does not predict the observed pressure differences between the H ii and H2 regions. A shock in cold gas, just strong enough to produce the 2000 K H2 lines, would not produce the H ii lines. A stronger shock could produce the H ii lines, but, if the H2 lines come from a cooler, post-shock region, the pressure there would be lower than directly behind the shock. A third alternative, a shock ionizing gas previously warmed to 2000 K, would also produce higher pressure in the H ii gas than in the H2 gas.
The consistent and low  line ratios severely restrict more complicated shock models. As discussed in Paper I, only a narrow range of shock velocities, below ∼30 km−1, could produce the H2 emission without excessive H ii luminosity, while the characteristic velocities in the centres of cD galaxies are well above this. Van der Werf et al. (1993) discuss a similar situation in the merging galaxy pair NGC 6240 (see further the section on LINERS below). They propose, effectively, that dense molecular clouds collide with a low-density atomic or molecular ISM, forming a fast ionizing shock in the low density medium and a slow, C-type shock in the molecular medium. They do not explicitly calculate the ionized to molecular line ratios in this case, and we find the existence of such a low-density, low-temperature medium unlikely at the centre of the cooling flow.
Alternatively, organized, rotation-like, motions of the cloud ensemble may allow the local cloud—cloud collisional velocities to be ∼30 km s−1while the large scale global motions are much higher. In this case the origin of the H ii emission is unclear. It cannot arise directly in the shocks (because of the pressure argument) but might arise indirectly, for example in a star-forming region downstream.
While the H ii and H2 line systems could conceivably arise in different regions from different mechanisms (e. g. H ii emission from an AGN narrow-line region and H2 lines from shocks in a circumnuclear disc), the low variation of the line ratios from cluster to cluster argues against unrelated emission sources.
We conclude that our results can be explained by systems of shocked clouds, but only under rather special conditions, whose likelihood requires further investigation.
4.7 Comparison to LINER spectra
The relative strengths of H2(1-0)S(1) and Brγ in our spectra are remarkably similar to those found in LINER galaxies (e. g., Larkin et al. 1998), perhaps not surprisingly as the optical spectra of cooling flows also have many similarities with LINERS (e. g. VD97). Models for the excitation mechanisms in LINERS include central AGN photoionization and ionization by an aging starburst (effectively a mix of H ii regions and supernova remnants, with a relative deficiency in ionizing photons accounting for the faintness of Brγ), and depend on the details of the near-IR spectrum (Alonso-Herrero et al. 2000). What produces the H2 vibrational emission in LINERs is not clear, except in the class of LINERs where shock-excitation dominates the observed spectrum, e. g., in NGC6240, discussed above, which has an optical spectrum which is typical for shock-excited LINERs (e. g., Fosbury & Wall 1979; Fried & Schulz 1983, Heckman, Armus & Miley 1987).
5 Conclusions
Our UKIRT observations detect multiple lines in six of the seven cooling flux clusters observed. In all cases except Abell 2029, we detect at least four of the 1-0S series, sometimes some of the 2-1S series. Paschen α is detected where the redshift allows this, but Brγ and δ are weak.
The ratio of molecular to ionized hydrogen line emission is much higher than those found in starburst regions or Seyfert galaxies, but are similar to those in LINERS. The ratios of Hα to Paα do not indicate large absorption of the former line by dust.
The 1-0S lines show near-LTE ratios, indicating densities well above 105 cm−3. This implies pressures in the warm gas that are 2 to 3 orders of magnitude higher than the surrounding ionized gas, and rule out static equilibria.
The line ratio and pressure data argue against gas heating by stellar UV emission. X-ray heating in non-isobaric conditions remains an option, as do shocks under highly constrained conditions.
Acknowledgments
UKIRT is owned by the United Kingdom Particle Physics and Astronomy Research Council and is operated by the British-Dutch-Canadian Joint Astronomy Centre at Hilo, Hawaii.
References
