


Abstract
A new tool is proposed for finding out the completeness limit in apparent magnitude of a magnitude–redshift sample. The technique, closely related to the statistical test proposed by Efron & Petrosian, presents a real improvement compared to standard completeness tests. Namely, no a priori assumptions are required concerning the redshift-space distribution of the sources. It means in particular that neither the clustering nor the evolution of the mean number density of the galaxies affects the result of the search.
1 Introduction
Extracting the intrinsic characteristics of the galaxies population from magnitude–redshift samples (e.g. the luminosity function, the power spectrum of the spatial density fluctuations) remains one of the major concerns of observational cosmology. The task is somehow complicated because of the presence of selection effects in observation, e.g. a detection threshold in apparent fluxes. Because a part of the population is indeed not observed, standard statistical methods lead in general to biased estimate of the genuine parameters characterizing the population. While correcting for such biases is hardly feasible when intricate selection effects are at work, the problem has been fortunately handled in some special cases.
Samples complete in apparent magnitude obviously deserve mention. Indeed, magnitude–redshift data truncated to a lower flux limit has been extensively studied in the literature. Powerful methods have been developed in such a case for fitting or reconstructing the luminosity function of the galaxies population (for example the C− method of Lynden-Bell 1971, the maximum-likelihood fitting technique of Sandage, Tammann & Yahil 1979). If the sample is furthermore complete in redshift, sophisticated methods have been proposed for estimating the power spectrum of the galaxies distribution (e.g. Heavens & Taylor 1997) and for inferring the cosmic velocity field from magnitude–redshift data (e.g. Rauzy & Hendry 2000, Branchini et al. 1999).
Flux-limited magnitude–redshift samples can be built by primarily selecting from a parent magnitude sample all the objects brighter than the adopted flux limit. In a second step the redshift of each of these sources (in this case the sample is complete in redshift), or a random subselection of these galaxies, is collected. By following such a strategy of observation, the completeness in apparent magnitude is essentially warranted as long as the parent sample is itself complete up to the flux limit. However, the completeness of the parent sample is in general difficult to assess. Undesired selection effects in observation are often at work and to some extent, the selection process depends on how the magnitudes of the galaxies are defined and measured (e.g. isophotal, visual, total magnitudes), how surface brightness threshold affects the sample, and so on (see for example Sandage & Perelmuter 1990, Petrosian 1976, Driver 1999). Moreover, the parent sample may have been selected using criteria involving other observables not straightforwardly related to magnitudes (e.g. diameters, fluxes in a different passband). It turns out that the completeness assumption, a crucial prerequisite for applying any fitting and recontruction methods mentioned above, must be checked thoroughly.
A classical test for completeness in apparent magnitude is to analyse the variation of the galaxies number counts in function of the limiting apparent magnitude (Hubble 1926). This test, which presupposes that the galaxies population does not evolve with time and is homogeneously distributed in space, is however not very efficient. It is difficult to decide in practice whether the deviation of the counts law is due to the presence of clustering and evolution of the galaxies luminosity function, or is indeed created by incompleteness in apparent magnitude. Including the redshift information, the  test of Schimdt (1968) has been also used for assessing the completeness of magnitude–redshift samples (see for example Hudson & Lynden-Bell 1991), but suffers unfortunately from the same major drawback than the Hubble completeness test.
Efron & Petrosian (1992) have thoroughly analysed the statistical properties of magnitude–redshift samples complete in apparent magnitude. They proposed a robust test for independence, free of the assumption concerning the spatial distribution of sources, which allows us to estimate the cosmological parameters characterizing the geometry of the Universe from a quasar sample (see also Efron & Petrosian 1999). It turns out that this statistical test, given a world model, can easily be recycled for testing the completeness assumption. The purpose of the present paper is exactly to take advantage of such a possibility.
The statistical background of the method as well as the test for completeness are presented Section 2. An example of application is given in Section 3, where the test is used for investigating the completeness in apparent magnitude of the South Sky Redshift Survey of da Costa et al. (1998). The properties of the new completeness test and its range of application are finally summarized in Section 4.
2 The completeness test
2.1 Assumptions and statistical model
 It is assumed hereafter that the luminosity function of the population does not depend on the 3D redshift-space position
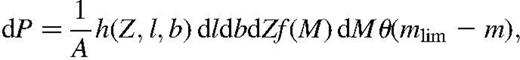
 of the galaxies. Without accounting for selection effects in observation, the probability density describing the population splits under this assumption as
 is the 3D redshift-space distribution function of the sources along the past light-cone.
The present model is thus well-suited to describe the observed spatial fluctuations of the galaxies density and to account for a pure density evolution scenario (i.e. the variations of the mean galaxies density with redshift or equivalently with time). On the other hand, equation (1) fails to describe environmental effects (i.e. the luminosity function of the sampled objects depends on the local environment) and an evolution of the specific characteristics (e.g. mean absolute magnitude, shape) of the luminosity function.
 Accounting for selection effects in observation, the probability density describing the sample may be written as
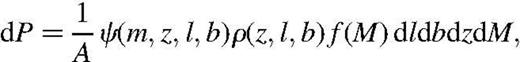

 describes some eventual selection effects in angular position and observed redshift. For example, it could account for a mask in angular position as well as pure selection or subsampling in redshift (e.g. a lower and upper limits).


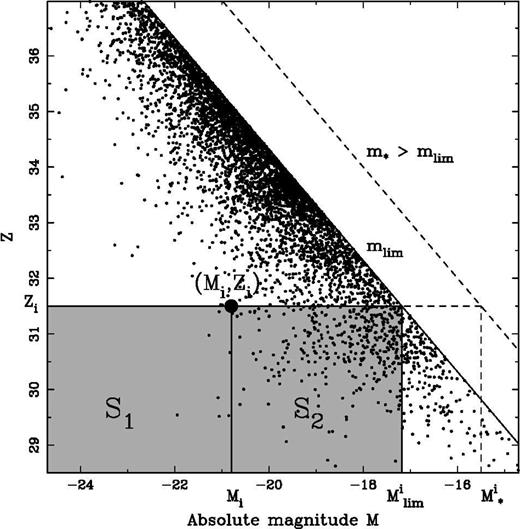
The variable Z defined in equation (6) versus absolute magnitude M. The procedure for evaluating ri and ni entering the calculation of the random variable ζ˚i of equation (15) is illustrated.
2.2 The random variable ζ
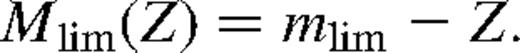
Because of the introduction of the quantity Z, the maximum absolute magnitude Mlim(Z) for which a galaxy at a given Z would be visible in the sample is uniquely defined, i.e.

 It follows from equation (12) that
 - (i)
P1: ζ is uniformly distributed between 0 and 1;
- (ii)
P2: ζ and (Z, l, b) are statistically independent.
Property P1 will be used hereafter to construct the test for completeness.
2.2.1 Estimate of the random variable ζ
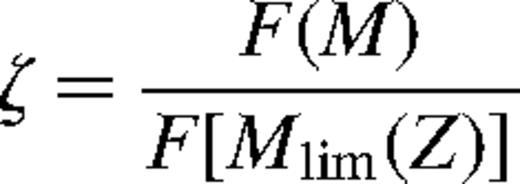
Under the null hypothesis H0, the random variable ζ can be estimated without any prior knowledge of the cumulative luminosity function F(M). Let us consider the distribution of the sampled galaxies in the M–Z diagram (see Fig. 1). To each point with coordinates (Mi,Zi) is associated the region defined as
- (i)
 such that
 and
and
- (ii)
 such that
 and
and
 and
and (see Fig. 1). It implies from equation (7) that the number of points ri belonging to S1 is given by
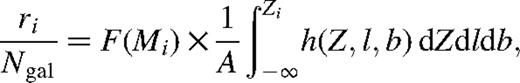
 is
is 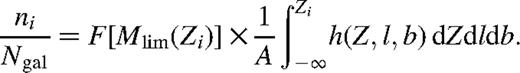
 An unbiased estimate of the random variable ζ introduced in equation (9) is indeed provided by the quantity
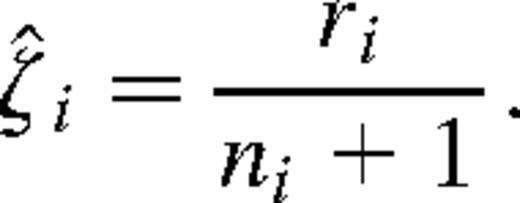
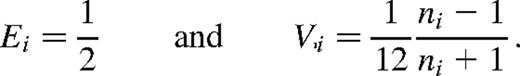
Note that the value of the variance Vi tends towards the variance of a continuous uniform distribution between 0 and 1 when ni becomes large enough.
The TC statistic can be estimated without assuming any prior model for the luminosity function. It is worthwhile mentioning that no assumptions have been made concerning the distribution function h(Z, l, b) introduced in equation (7). It means that the property of the TC statistic derived above holds for any 3D redshift-space distribution ρ(z, l, b) (allowing the presence of clustering and the evolution of the mean galaxies density with time), and for any selection function φ(z, l, b) (e.g. subsampling in redshift bins would not bias the TC statistic).
2.3 The test for completeness TC
The principle of the test is to evaluate the quantity TC defined in equation (17) for subsamples truncated to increasing apparent magnitude limit m∗, i.e. m∗ is replacing mlim in equation (8).
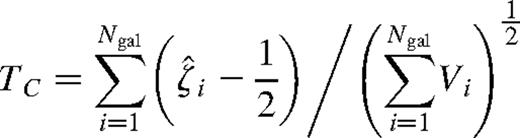
As long as m∗ remains below the completeness limit mlim the subsample is obviously complete up to m∗ and the TC statistic is thus expected to be distributed around zero with sampling fluctuations of dispersion of unity. On the other hand as m∗ becomes greater than mlim, the incompleteness introduces a deficit of galaxies with M fainter than Mlim(Z) (see Fig. 1). It results in a lack of galaxies with a value of ζ^i close to unity. Fig. 2 dramatically illustrates such a trend for a sample characterized by a strict cut-off in mlim, but the trend would remain similar for a smooth imcompleteness function as well. It turns out that the TC statistic is expected to be systematically negative for limiting apparent magnitude m∗ greater than the completeness limit mlim.
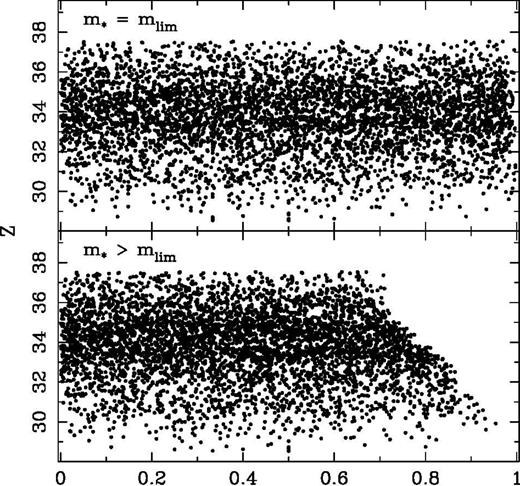
Diagram ζZ for two values of the limiting apparent magnitude m*. For m* greater than the completeness limit mlim, the number of galaxies fainter than Mlim(Z) is underestimated due to incompleteness (see Fig. 1), inferring a systematic lack of points with a value of ζ˚i close to unity. This effect is particularly visible at high Z (i.e. distant galaxies).
Therefore, the curve TC(m∗) is characterized by a plateau of zero mean for m∗ below mlim, followed by a systematic decline beyond this apparent magnitude, i.e.

Under H0, the sampling fluctuations make the TC statistic follow a Gaussian distribution of variance. The decision rule for fixing the completeness limit is a matter of choice, having in mind that the confidence levels of rejection associated to the events

 are respectively 84.13, 97.72 and 99.38 per cent (i.e. these numbers correspond to the probabilities drawn from a Normal distribution for a one-sided rejection test).
3 Example of application
The test for completeness TC is herein applied to the South Sky Redshift Survey (SSRS2) sample of da Costa et al. (1998). The sample, containing 5369 galaxies with measured B-band magnitude and redshift, has been drawn primarily from the list of non-stellar objects identified in the Hubble Space Telescope Guide Star Catalog (Lasker et al. 1990). The redshift survey is more than 99 per cent complete up to the magnitude limit mSSRS2 of 15.5 mag (da Costa et al. 1998). The test for completeness TC is thus applied to assess the completeness in apparent magnitude of the primary list of galaxies used to build on the SSSR2 sample.
The type-dependent k-correction are calculated following Pence (1976), i.e. with
with for
for
 for
for and
and for
for Galactic extinctions are obtained as
 by use of the dust maps of Schlegel, Finkbeiner & Davis (1998) for the redenning correction.
The redshifts have been transformed in the cosmic microwave background rest frame and the distance modulus is computed adopting an Hubble constant of in a flat universe with no cosmological constant (i.e.
 and
and
Galaxies not belonging to the redshift range [2500, 15000] km s−1 are discarded. The lower limit in redshift has been introduced in order to minimize the impact of peculiar velocities on the TC statistic. In particular, the kinematic influence of the Virgo cluster will be considerably reduced by removing nearby galaxies. The upper bound in redshift sets some limits on the interval of time spanned by the data and thus reduces the influence of an eventual evolution of the luminosity function on the TC statistic corresponds to a look-back time of 0.5 109 yr for
 respectively 1 Gyr if
 ). Note that such a subsampling in redshift is not expected to affect the result of the search.
Finally, a random component uniformly distributed between [−0.005, 0.005] has been added to the catalogued magnitudes (the apparent magnitudes of the SSRS2 sample are rounded to 0.01 mag). Rounding problems have negligible effects on the present analysis but can infer spurious variations of the TC statistic. Because magnitudes are set to discrete values, it creates some artificial gaps in the magnitude distribution function. The effect is observable on highly rounded data sets and containing a large number of galaxies, e.g. the Zwicky catalogue (Zwicky et al. 1968).
The test is applied to subsamples truncated to increasing values of the limiting apparent magnitude m∗. For each galaxy with coordinates (Mi, Zi), the quantity is formed, the numbers ri and ni are computed, as well as the random variable ζ^i and its variance Vi. The statistic Tc(m∗) is obtained following equation (17) by summing over all the galaxies of the subsample. The results are shown in Fig. 3, bottom panel. Considering the value of
 at
at it is clear that the completeness in apparent magnitude of the SSRS2 sample is not satisfied up to the magnitude 15.5. Or in other words, the assumption that the sample is complete up to 15.5 is rejected at a confidence level greater than 5σ. The rule for deciding which value of the completeness limit has to be adopted is on the other hand a matter of choice. Herein a 2σ criterion has been chosen to reject the completeness hypothesis, leading to a value of
 for the completeness in apparent magnitude.
The test for completeness TC applied to the 4324 galaxies (all types) of the SSRS2 sample with redshifts between 2500 and 15 000 km s−1. A systematic decline of the TC statistics can be observed beyond Top panel shows in logarithmic scale the galaxies number count in function of the limiting apparent magnitude m*. The 0.6 slope (grey line) is the slope expected if the sources were uniformly distributed in space.
The decimal logarithm of the number count versus the limiting apparent magnitude is shown Fig. 3, top panel. A slope of 0.6 is expected if galaxies were uniformly distributed in space (i.e. this is the standard completeness test proposed in Hubble 1926). The test does not allow us to draw any firm conclusions concerning the completeness of the sample. The observed slope appears to be slightly shallower than 0.6 but nothing prevents the effect from being a result of inhomegeneity in the spatial distribution of the galaxies. Moreover, no particular trend is visible beyond the limit where the TC statistic indicates that the SSRS2 sample suffers from incompleteness.
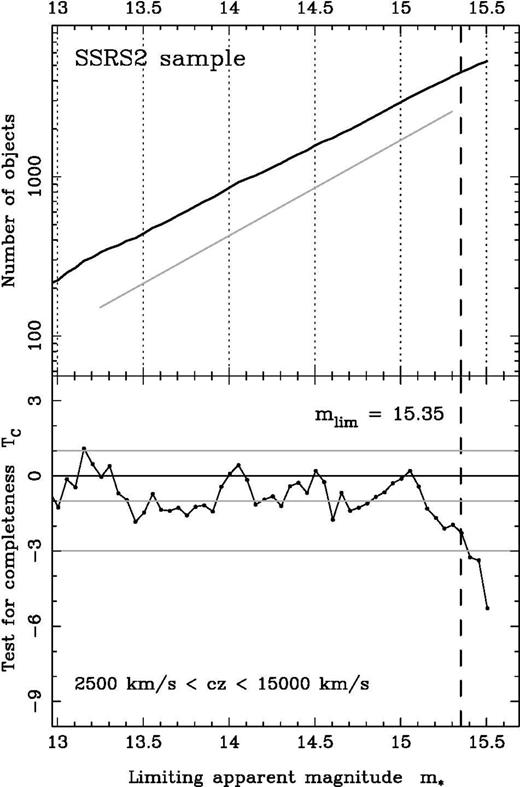
The application of the TC statistic to the SSRS2 sample allows us to conclude, with a high confidence level, that the sample is not complete in apparent magnitude up to However, the significant deviation of the TC statistic from zero may be as a result of hidden systematic effects. In particular, it has been assumed that the luminosity function does not depend on the spatial position of the galaxies. It is well known that the E/SO galaxies, in contrast to spirals, populate preferentially galaxy clusters (see for example Loveday et al. 1995). If the luminosity functions of E/SO and spiral galaxies are indeed different (say for example that E/SO galaxies are brighter on average), the luminosity function of the whole population (E/SO+spirals) is expected to depend on the spatial position (on average, galaxies will be brighter in clusters than in the field). Such an environmental effect could influence the TC statistic and therefore affect the conclusions drawn from the completeness test. The influence of E/S0 and spiral galaxies segregation is investigated Fig. 4. The completeness test has been applied separately to the two populations. The systematic decline of the TC statistic can be observed for both types and the completeness limit of
 is ruled out with a high confidence level of rejection (≈4σ).
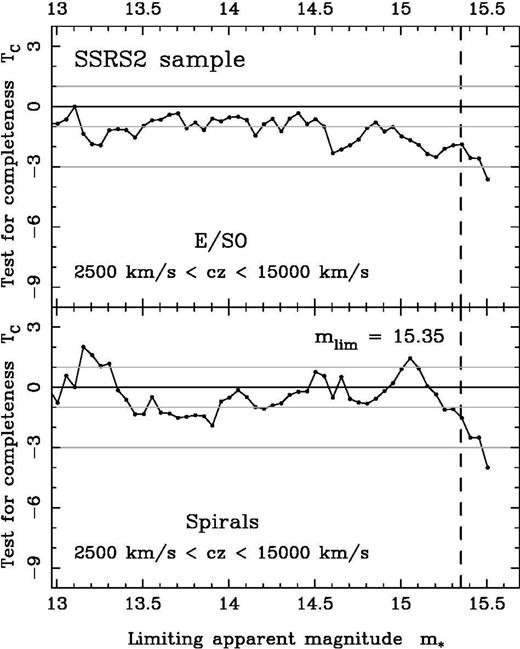
The test for completeness TC applied to the 1373 E/SO galaxies (top) and to the 2780 spiral galaxies (bottom) of the SSRS2 sample with redshifts between 2500 and 15 000 km s−1. The systematic decline at is present for both E/SO and spirals galaxies.
As pointed out by Jon Loveday, the referee of this paper, other potential problems may affect the present analysis. It has been assumed for example that the k-correction and the Galactic extinction map used herein are correct. An improper correction of these quantities could lead to systematic biases for the TC statistic. The influence of such effects is investigated in Fig. 5. The top panel shows the completeness test applied to a subsample of all types nearby galaxies of the SSRS2 survey The k-correction for this subsample is therefore small, 0.048 mag in average with a maximum of 0.11 mag. The decline of the TC statistic at
 is still present, suggesting that an improper k-correction term cannot explain the imcompleteness observed in Fig. 3. The bottom panel of Fig. 5 shows the completeness test applied to the all types SSRS2 galaxies with a Galactic extinction Ag(l,b) less than 0.1 mag. Note that such a subsampling is not supposed to bias the TC statistic since selection effect in angular direction are allowed (see Section 2.2.1). Again, the TC statistic falls beyond
 It thus appears that the systematic deviation of the completeness test is not due to an eventual improper correction for the k-correction or for the Galactic extinction.
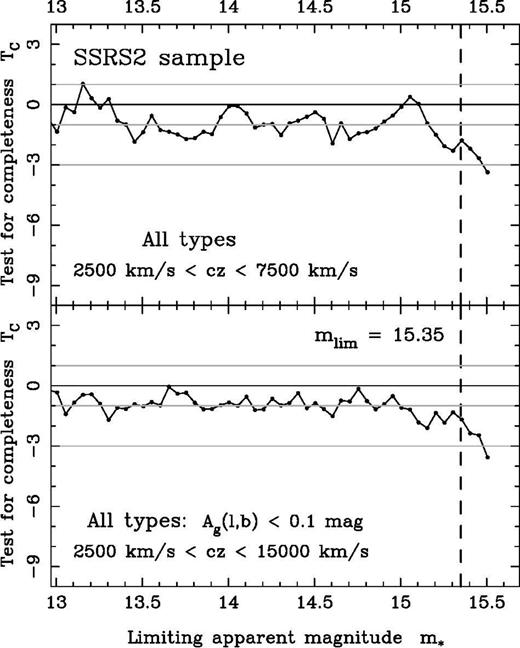
The test for completeness TC applied to the SSRS2 all types galaxies (top) with redshifts between 2500 and 7500 km s−1 (2416 galaxies with a mean k-correction of 0.048 mag) (bottom) with redshifts between 2500 and 15 000 km s−1 and a galactic extinction (1260 galaxies). The systematic decline at
 is present in both cases, suggesting that the imcompleteness cannot be explained by an improper k-correction term or Galactic extinction correction.
Another potential problem is that the k-correction is herein type dependent, which is not described by the statistical formalism presented in Section 2.1, at least if the luminosity function is also type dependent. To be strictly valid, the completeness test has to be applied type by type. Six subsamples of spirals have been selected (from type to
to The result of the completeness test at
 on these subsamples is respectively
 −1.09, −2.73, −2.33, −0.94 and
 which indicates that on average the completeness of the sample is not satisfied up to
 Note however that the incompleteness is less flagrant in this type-by-type analysis than for the all spirals subsample of Fig. 4
 at
at It is not surprising since, as any rejection test, the efficiency of the TC statistic is improved as the number of the data points increases.
The results of the test for completeness on the SSRS2 sample can be summarized as follows. The test for completeness indicates that the primary list of galaxies used to build on the SSRS2 redshift sample is not complete in appparent magnitude to the limit. Rather, it suggests that we adopt
 (or less) as a reasonable completeness limit. This point is of importance since incompleteness in apparent magnitude is source of biases when evaluating the intrinsic characteristics of the galaxies luminosity function for example (Marzke et al. 1998). Special attention has been paid to investigate the systematic effects that could bias the TC statistic (influence of peculiar velocities, evolution of the luminosity function with time, environmental effect, influences of the k-correction and galactic extinction).
4 Summary
A new tool has been proposed for assessing the completeness in apparent magnitude of a magnitude–redshift sample. The technique presents a real improvement compared to standard completeness tests. Namely, no a priori assumptions are required concerning the redshift space distribution of the sources. It means in particular that neither the clustering nor the evolution of the mean number density of the galaxies affect the result of the search.
The test for completeness presented herein is however reliable if, and only if, the magnitude–redshift sample verifies the following criteria.
- (i)
The distances of the galaxies are required, which implies that a cosmological world model has to be specified and that the contribution of peculiar velocities to observed redshifts can be safely neglected. Furthermore, the galactic extinction and the k-correction involved in the definition of the absolute magnitudes are required.
- (ii)
The shape of the luminosity function of the galaxies is not allowed to change with time (in practice, this criterion is achieved if the sample is divided into thin intervals of redshift, i.e. time).
- (iii)
The luminosity function of the population is assumed to be independent of the spatial position of the galaxies. In particular, environmental effect may affect the results of the completeness test.
Acknowledgments
I would like to thank Richard Barrett, Martin Hendry, Gilles Theureau and David Valls-Gabaud for fruitful discussions. I acknowledge the support of the PPARC and the use of the Starlink computer node at Glasgow University.
References
