


Abstract
A nearly complete sample of 24 Magellanic Cloud WC/WO subclass Wolf–Rayet stars is studied spectroscopically and photometrically to determine its binary frequency. Theory predicts the Roche lobe overflow produced Wolf–Rayet binary frequency to be 52±14 per cent in the Large Magellanic Cloud and 100 per cent in the Small Magellanic Cloud, not counting non-Roche lobe overflow Wolf–Rayet binaries. Lower ambient metallicity (Z) leads to lower opacity, preventing all but the most massive (hence luminous) single stars from reaching the Wolf–Rayet stage. However, theory predicts that Roche lobe overflow even in binaries of modest mass will lead to Wolf–Rayet stars in binaries with periods below approximately 200 d, for initial periods below approximately 1000 d, independent of Z. By examining their absolute continuum magnitudes, radial velocity variations, emission-line equivalent widths and full widths at half-maximum, a WC/WO binary frequency of only 13 per cent, significantly lower than the prediction, is found in the Large Magellanic Cloud. In the unlikely event that all of the cases with a less certain binary status actually turn out to be binary, current theory and observation would agree. (The Small Magellanic Cloud contains only one WC/WO star, which happens to be a binary.) The three WC+O binaries in the Large Magellanic Cloud all have periods well below 1000 d. The large majority of WC/WO stars in such environments apparently can form without the aid of a binary companion. Current evolutionary scenarios appear to have difficulty explaining either the relatively large number of Wolf–Rayet stars in the Magellanic Clouds, or the formation of Wolf–Rayet stars in general.
1 Introduction
With the absence, or nearly so, of hydrogen, and the presence of H- or He-burning nucleosynthetic products in their atmospheres, Wolf–Rayet (WR) stars are viewed as a class of stars at the ultimate stage of massive stellar evolution before their explosion as supernovæ or non-violent collapse to black holes (Chiosi & Maeder 1986; Crowther et al. 1995). A main-sequence O star begins its evolution by gradually consuming the hydrogen in its core via the CNO cycle. Internal mixing brings some of the fused products (mainly He and N) outwards. Meanwhile, stellar winds, indicated by strong and broad emission lines in the spectra, blow away most of the H-rich outer layers, exposing the He- and N-rich interior of the star. The result is the formation of a WN star, possibly followed by a WC star.
As the loss of matter from the outer layers of the star is important for the start of the WR phase, it is necessary that the stellar wind be strong enough in the O-star (and/or luminous blue variable) progenitor to blow off this hydrogen envelope. Since this wind is mainly the consequence of radiation pressure on the ions of the photosphere, accelerating the particles in a net outward direction, the rate of mass loss should depend on conditions that promote a strong stellar wind. One such requirement is that there be a high initial mass. The higher the mass, the higher the luminosity (e.g.  with
with  for most main-sequence stars, decreasing slightly for the most massive stars), and so the greater the pressure on the photospheric particles. This increases the probability that the star will reach the WR stage.
Maeder (1991) proposed that the mass loss leading to WR stars is related to the initial metallicity of the star. With the wind resulting from radiation pressure on the ions of the photosphere, the higher the metallicity, the greater the opacity per unit mass of the material to the impinging photons. As more of the momentum from the radiation is transferred to them, particles of higher metallicity will tend to be more highly accelerated outward than those of lower metallicity. Maeder therefore argued that single stars with low initial metallicity would require higher initial mass to evolve into the WR stage.
The metallicity of the Magellanic Clouds [the Large Magellanic Cloud (LMC) and the Small Magellanic Cloud (SMC)] is substantially lower than the mean metallicity of the Milky Way, which we characterize by solar abundance  Maeder (1982, 1991) theorized that an O star with insufficient mass and metallicity to evolve into a WR star could still become a WR if it had a close binary companion. The companion will effectively reduce the gravitational potential near the surface of the more massive evolving star, allowing it to lose mass more rapidly via Roche lobe overflow (RLOF) and thus reach the WR phase (see also Vanbeveren, van Rensbergen & De Loore 1998).
The results of Maeder & Meynet (1994) with evolutionary models can be used to predict that the relative binary frequency of WR stars should be higher when the ambient metallicity is lower. Assuming that the fraction of stars in massive binaries undergoing RLOF,  is independent of metallicity, they calculated the number ratio of the total number of WR stars to O stars
  as a function of metallicity for various galaxies (see fig. 11 of Maeder & Meynet 1994). The observational value of ϕ, for each galaxy, was then found by first determining the value of WR/O from the curve for
  at the value of Z corresponding to each galaxy. The differences between these ϕ = 0 values and those for the galaxies then allowed an estimate for ϕ for each galaxy (assuming linear interpolation between the curves for
  and 0.05). By taking the mean of these galactic ϕ-values, a universal ϕ is found to be
From a plot of these WR/O values as a function of metallicity, along with theoretically calculated curves of WC/O versus Z for various values of ϕ (cf. fig. 2 of Maeder & Meynet 1994), we estimate a mean, universal, observational value for ϕ to be  An estimate of the fraction of WR stars that were created by RLOF
 may then be found with the data in fig. 2 of Maeder & Meynet (1994). The results for the SMC, the LMC and the Milky Way are listed in Table 1. The high fraction of WR stars expected to have been formed through RLOF in the Magellanic Clouds means that the binary frequency should be at least 52 per cent (additional WR binaries may occur without RLOF) in the LMC and virtually all WR stars in the SMC should be RLOF binaries, as a result of their low metallicity.
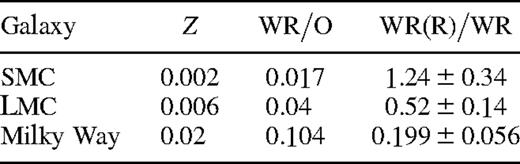
Expected fraction of WR stars formed via the channel of RLOF for the SMC, LMC and Milky Way. A mean value of  is assumed.
Given the relatively low metallicity of the LMC, it is unlikely that many single WR stars would exist at any given time, in view of the negative slope of the initial mass function [reading from fig. 1 of Maeder & Conti (1994), the predicted minimum mass to form a single WR star in the LMC is ∼40 M⊙, and in the SMC is ∼50 M⊙]. With over 100 WR stars in the LMC, however, there is a quandary. The low ambient metallicity in the LMC means that approximately 50 per cent of WR stars need to be binary in order to be able to exist according to the RLOF binary evolutionary scenario. Does the LMC really contain this many RLOF-produced WR binaries?
One way to shed light on the situation is to study the binary frequency of a complete sub-sample of WR stars in a given environment. The 23 known WC/WO subclass stars in the LMC, listed in the catalogue of Breysacher (1981), provide such a tractable sub-sample1 (see Appendix A). (Of course, it is impossible to state definitely that any astronomical sample is complete. However, given their very strong emission lines, it is very unlikely that many more WC/WO stars remain to be detected in the LMC.) All have evolved in a low-metallicity environment under the same conditions. They are nearly all of the same spectral sub-type (WC4 or WO3: cf. Section 3.3), representing an extreme (and, perhaps, the final pre-collapse) stage of evolution for massive stars. Under Maeder's theory, attainment of this class by a single star requires that its progenitor be very massive, highly metal-rich, or both.
The goal of this first paper of a pair on the WC/WO stars of the Magellanic Clouds is to describe the determination of the binary frequency of this sub-class of stars in the LMC. The sole WC/WO star in the SMC (Azzopardi & Breysacher 1979) and the two earliest known binaries in the Galaxy are added for comparison. The main method of research is observation by repeated single-slit spectroscopy in the blue–yellow range. Photometric imaging in the V band supplements the spectroscopic work, in order to supply reliable brightnesses and eliminate at least some apparent visual binaries. All of these data are used to determine the binary frequency of the sample in order to confirm or refute the binary model for WR formation. A companion paper (Bartzakos, Moffat & Niemela 2001, hereafter Paper II) contains a discussion on the study of wind–wind collisions in those binaries found.
2 Observations and data reduction
2.1 Spectroscopy
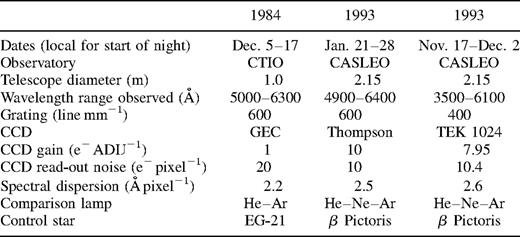
Spectroscopic data of the Magellanic Cloud WC/WO-class stars listed in Table 3 of Section 3 (see later) were collected during three observing runs. All three runs were undertaken using charge-coupled device (CCD) detectors and diffraction grating spectrometers. The technical specifications of each mission are listed in Table 2. The first order of the grating was used in each case and, for the wavelength ranges observed, no order-separating filter was necessary.
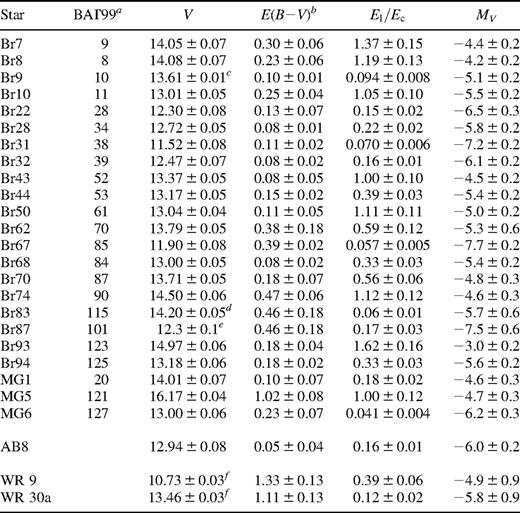
Magnitudes, reddenings and line-to-continuum strength ratios of observed stars. Note that V is the observed broadband visual magnitude, while  and MV are corrected for emission lines.
Observing run specifications.
Each stellar spectrum was accompanied by the spectrum of a comparison lamp of noble gases for wavelength calibration, the calibration spectrum being taken with the telescope at the same position as required for the observation of the star. One such comparison image was taken directly before and after the stellar observation, and the average was taken of the two (except for the 1984 December run, when only one calibration exposure was taken after observing the star).
On each night, CCD zero-exposure frames were taken to determine the electronic bias of the detector. For the first run, flat-field exposures on a white screen in the dome were made to correct for pixel-to-pixel response variations of the CCD. For the second run an internal lamp was used for the flat-fields. No flat-field frames were made during the third mission; the spectra of a control star were used, in that case, for flat-fielding of the reduced and calibrated spectra each night. Control stars known to possess few spectral lines in the observed wavelength range were selected for each run. This star allowed a test for and correction of any artefacts arising from the method of observation or from the equipment.
Reduction of the spectra to wavelength-calibrated, one-dimensional rectified arrays was performed by computer using the National Optical Astronomical Observatory (NOAO) programs of the Image Reduction and Analysis Facility (iraf). The velocity components of the Earth's motion were removed to produce a heliocentric wavelength scale.
2.2 Photometry
Photometric broad-band V images were taken of all programme stars (those Magellanic Cloud stars listed in Table 3), with the exception of MG5, during 1994 January at the University of Toronto Southern Observatory (UTSO) 60-cm telescope. MG5 was observed on 1995 November 22. The observing run was performed through service observing by staff at UTSO. The detector was a PM512 CCD with a field of
 It had a gain of
 and a read-out noise of 10.6 e− per
 Reduction of these data was performed with iraf. The bias was removed from the images and a normalized dome flat-field was divided through them to remove pixel-to-pixel variations.
Instrumental magnitudes were found by analysing the images with the daophot package of iraf. Crowded stars were separated by fitting a point-spread function, modelled by a Penny function, to the stars.
Results of the images, photometry and average spectra of all Magellanic Cloud programme stars are displayed in Appendix A (spectra only are shown for the two Galactic stars).
3 Analysis and results
The data were analysed to find various quantities that are relevant to determining which stars are binary. (Additional quantities are also specified.) As binary stars can be expected to be brighter than single stars, the absolute continuum magnitude was sought. This is fairly straightforward in galaxies like the LMC and the SMC. Owing to dilution by a companion, a binary star should have emission lines of lower equivalent width than those of an equivalent single star. As a result of orbital motion, radial velocity variability should be highest for stars that show binarity with short periods. Of course, a single star in a crowded region might also show some of these effects.
3.1 Continuum magnitudes
To calibrate the V magnitudes of the programme stars, standard stars of the fields RU149 and RU152 (Landolt 1992) were observed, since they contain a good spread in colour index. Their images were reduced in the same manner as those of the programme stars. The RU fields were used to calibrate a secondary standard, the LMC WC star Br 50, which was of the same basic type as the others and is located in the same region of the sky. With the V magnitude of this star determined, the magnitudes of the other programme stars could be found by adding the difference between the instrumental magnitudes of Br 50 and the star in question to the V magnitude of Br 50 (at the airmass of the programme star in question).
 and the reddening,
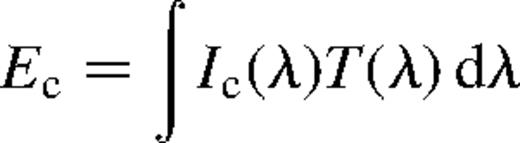
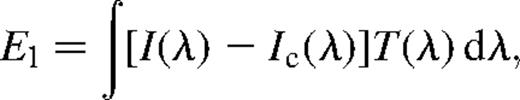
 The contribution of the intense emission lines must be removed first. This was performed using the method of Pyper (1966), by deriving the difference between the magnitude of the continuum and the contaminated magnitude measured by the observer, which is
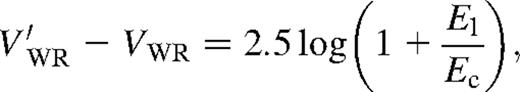
[The results here were compared with the medium-band ubv measurements by Smith (1968) and Torres-Dodgen & Massey (1988) (converted to the UVB system). It was found that the difference between the two methods was mag for
 stars for Smith, and
 for
for stars for Torres-Dodgen & Massey (1988). The results of the present work lie between those of these previous researchers, and are compatible with them.]
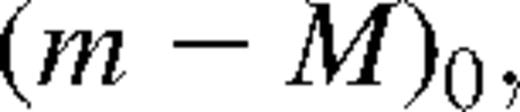
The distance moduli determined by Westerlund (1990) are ( for the LMC and
 for the SMC. No uncertainty is given for the value for the SMC, but it should be at least as high as that for the LMC. These values are consistent with the new values of the moduli very recently determined, by the merging of many results, of
 for the LMC and
 for the SMC (Westerlund 1997, pp. 6–20, and references therein).
The Galactic stars WR 9 and 30a were not studied photometrically. Their continuum absolute magnitudes were estimated from the data compiled by van der Hucht et al. (1988). In their table 4, the visual continuum magnitudes v and reddenings
 [using the medium-band ubv system of Smith (1968)] are listed. Estimates of the distance moduli of the two stars are also provided. The ubv values can be converted to the UBV system using the relations of Turner (1982), which require the colour index
 also given in van der Hucht et al.’s table.

Table 3 summarizes the photometric results for each star. Note that the V data for three severely crowded stars are taken from sources with results that were based on better spatial resolution.
3.2 Radial velocities
The heliocentric velocities of the stars were found by evaluating the Doppler shift of the wavelength of the C iv 5808-Å emission line. Detailed radial velocity lists can be found in Bartzakos (1998). This line was chosen since it is present in all of the spectrograms available, and because it is much more intense than the other lines, even though it is a doublet (5802 and 5812 Å) and is blended with He i 5876 Å on its red flank. For the calculations, the line was defined to be bounded by those points where it became indistinguishable from the continuum. [In binaries, the line profiles are distorted by excess emission arising from wind–wind collision (see the discussion in Paper II). This was ignored since the effect is very small for C iv 5808 Å.] The rest wavelength was taken somewhat arbitrarily to be 5808.0 Å (the line is a doublet of two C iv emission lines); since radial velocity searches were done mainly to determine temporal radial velocity changes and comparisons between stars, the precise choice of rest wavelength does not affect the validity of the study as long as the same rest wavelength is used for each spectrum.
The averages of the velocities determined for each star at each epoch were then found (v̄obs). They are given in Table 4, along with standard deviations (which were simply the standard deviations about the mean of measured radial velocities of a given star as a function of time) and number of data points.
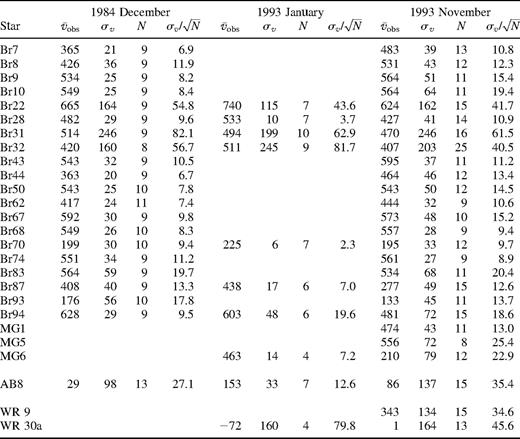
Heliocentric radial velocity data, for each observing run, of the observed stars, where  and sv are in units of km s−1. The velocities are based on the C iv 5808-Å emission line.
The standard deviation of the radial velocities can only effectively reveal variations over intervals of up to weeks. Variations over a longer duration (e.g. binary orbits with periods in the range of years) would be unlikely to be detected this way, since the variations would be so small as to be comparable to those found for single stars. This is illustrated in Fig. 1, where the amplitude K of a binary WR star is plotted as a function of the binary period and compared with the velocity standard deviation of single stars. The mass of the WR star is assumed to be half of that of the companion, while the combined mass of both components of the binary system is 50 M⊙. Precise masses are not essential here, since A circular orbit is assumed, since the real interest here is to check for RLOF systems, which will have their orbits virtually circularized (Zahn 1975) if the original orbit was elliptical.2 A typical inclination of
 is assumed, as well. From this figure it is apparent that binaries with periods of up to a few months have amplitudes that are much higher than the standard deviation of radial velocity inherent in the spectroscopic measurements. However, a period of years will yield velocity variations that are masked by instrumental scatter (estimated from single stars). Strongly elliptical orbits in some cases will complicate the interpretation of Fig. 1.
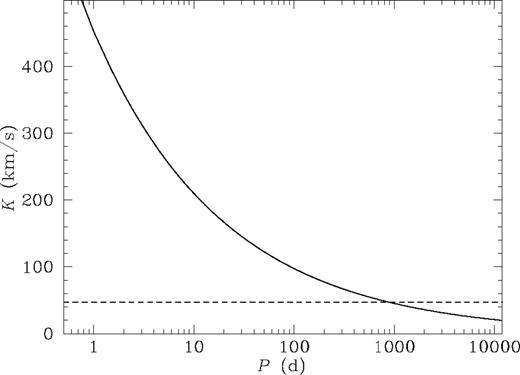
Spectroscopic velocity amplitude as a function of period for a hypothetical circular orbit binary WR star with a combined mass of both components of 50 M⊙ and The WR star mass is half that of its companion. The solid curve is the amplitude function and the dashed line represents the level of the standard deviation for the 1993 November mission.
For the detection of long-period binaries, it should be considered that such stars (with periods of several months or years) are likely to be at different orbital phases at each epoch of observation. The average velocity (a better measure of the typical velocity of the star at a given orbital phase than an individual velocity for a long-period system) at any epoch should be significantly different from mean velocities at other epochs. With a short-period binary, however, the star will complete several orbital cycles in a given epoch and so the average velocities between epochs will be similar, although noisy.
It is conceivable that the presence of a companion could lead to an increase of the WR wind speed (by reducing the gravitational potential of the star as discussed in the Introduction). Therefore it is useful to look for an increase of the FWHM in binaries.
There is no reason to believe that the systemic velocity of the WR star would be affected by a companion.
The radial velocity data of all three observing missions were combined directly to produce global values for each star. In Table 5 are listed the averages of the observed heliocentric radial velocities for each star, v̄°obs, except for the detected spectroscopic binaries, where the mean systemic velocity is given. The heliocentric velocities of the stellar milieu, vmil, in the case of the single LMC stars, are included [these were calculated by interpolation from H i velocities in fig. 6 of Feitzinger (1980)]. They are followed by Δvr, the difference between v̄obs and vmil. In the case of AB8 and the two Galactic WC binaries, vmil is not available. For these three stars, true systemic radial velocities based on the O-companion orbit, γ(OB), were used to obtain (The standard deviation of the average velocities, σvr, the total number of observations, N, and the average equivalent width and full width at half-maximum of the C iv 5808-Å line, We and FWHM, respectively, are also included in Table 5.)
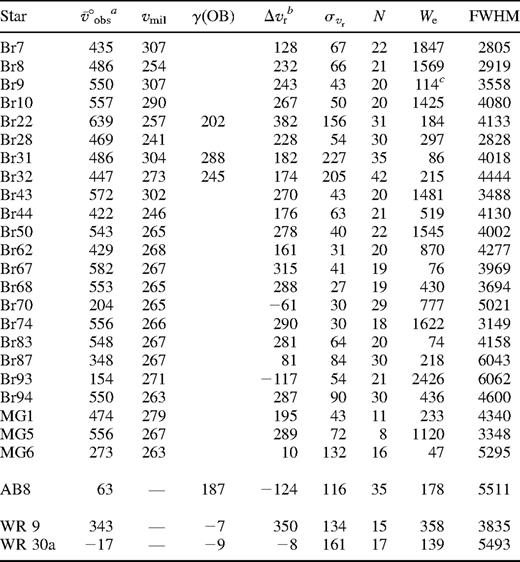
Spectral data for C iv 5808 Å of the observed stars, observing runs combined. The quantities  and FWHM are in units of km s−1; We is in Å.
3.3 Correlations among the data
The above quantities that might be sensitive to binaries can be plotted to indentify correlations in which binary stars stand out. In Figs 2–7, σvr, MV, Δvr and FWHM are plotted as a function of equivalent width, We, while the absolute value of the velocity change between two epochs, is plotted as a function of σvr for two pairs of epochs. The choice of abscissa is somewhat arbitrary; the emphasis is on a parameter (such as We) that is most likely to be affected by the presence of a companion. In all figures, small square symbols designate those stars that are certain to be binary (based on an ensemble of criteria), while small circles show the rest. Filled small symbols refer to stars without apparent companions diluting their light; open small symbols designate stars that are optical doubles that could not be separated. Some stars were also assigned an additional larger concentric open symbol, designating stars with OB lines in their spectra. Concentric squares show such stars with magnitudes that have been corrected for the OB light photometrically, while concentric circles mean that the magnitudes could not be so corrected.
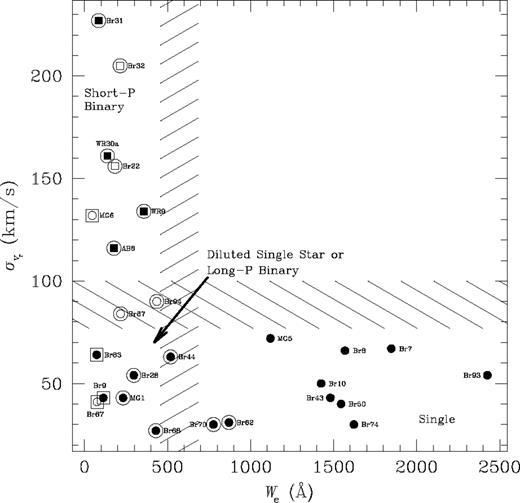
Radial velocity dispersion (σvr) correlation with C iv equivalent width (We). In Figs 2–7, the symbols are as follows: small squares – definite binaries; small circles – the rest; small filled symbols – light not diluted by companions; small open symbols – unseparated optical doubles; concentric (larger) symbols – OB lines in spectra; concentric squares – magnitudes corrected for OB light; concentric circles – magnitudes not corrected for OB light. Hatched bands are used to attempt to separate binary stars from single stars for a given parameter.
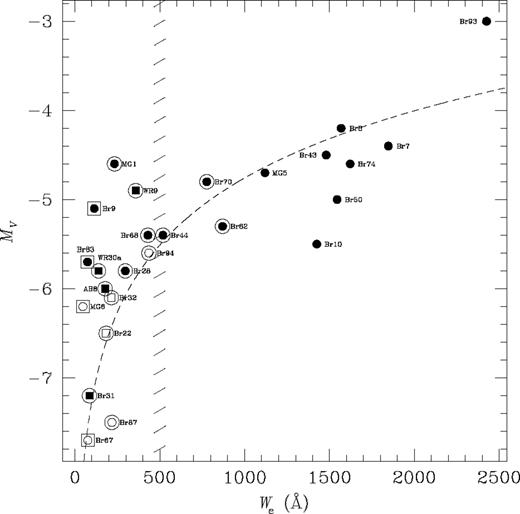
Absolute magnitude correlation with C iv equivalent width (We). The dashed line illustrates the apparent correlation between MV and We.
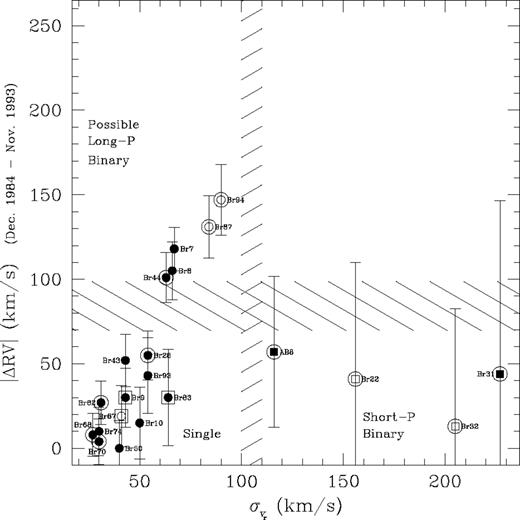
Radial velocity difference (absolute value) versus standard deviation between the 1984 December and the 1993 November observing runs. Error bars indicate the combined normalized standard deviation.
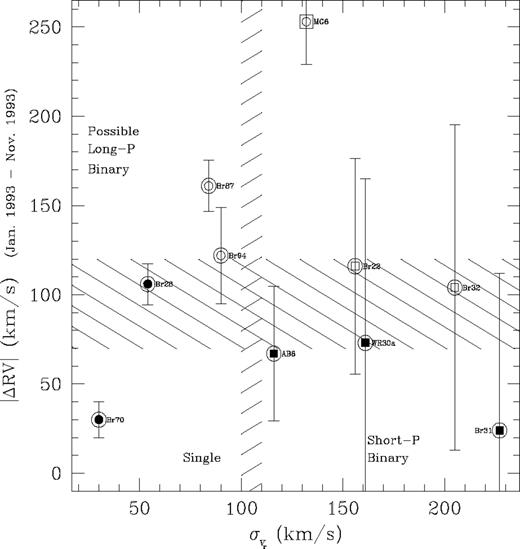
Radial velocity difference (absolute value) versus standard deviation between the 1993 January and November observing runs. Error bars indicate combined normalized standard deviation.
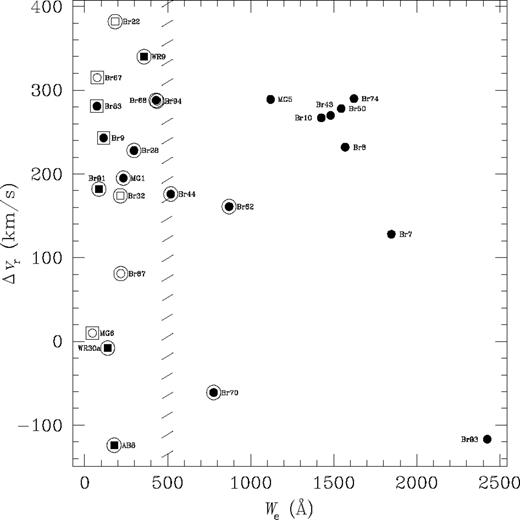
Excess radial velocity (Δvr) correlation with C iv equivalent width (We).
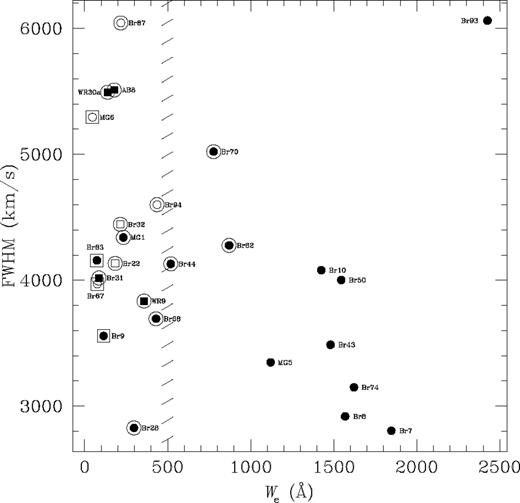
FWHM correlation with C iv equivalent width (We).
A strong correlation with binarity appears in Fig. 2, where σvr is plotted against equivalent width. All known short-period binaries appear in the upper left-hand corner (cordoned off by the horizontal and vertical hatched bands, which are an estimate of borders that might help to separate binary stars from single ones for a given parameter), a result of their high radial velocity variations and diluted light. MG6 also appears near the known binaries. Its spectrum, however, is greatly diluted by nearby stars and is thus noisy. Inadvertently varying the slit placement over the complex of stars from night to night will affect the radial velocity. Such a star could therefore appear to have spuriously enhanced brightness and increased σvr, but still be single. Several other stars with OB lines are diluted in We but have little variation in σvr. These are unlikely to be binaries unless they are of long period or of very low inclination. The stars in the lower right-hand corner are very probably single.
 is approximately constant for WC/WO stars of the LMC, while what is varying from star to star is mainly the continuum emission. Since
 for
for then
then 
This function is plotted in Fig. 3 as the dashed line for (in arbitrary units since flux information is lost during rectification of the spectra). This curve is not an exact fit and is only illustrative. The relatively large scatter about the curve suggests some degree of breakdown of the above assumptions. In fact, it may be that all stars with
 have approximately the same MV, with the exception of the LMC WO3 star Br93.
 was calculated in each case. Given this quantity for epoch 1 and epoch 2,
 and
and respectively, the combined normalized standard deviation was found from
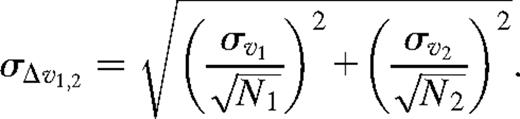
The known short-period binaries AB8, Br22, Br31 and Br32 all fall in the lower right-hand corner of the plot of Figs 4 and 5. This is to be expected with their large combined normalized standard deviation and an average velocity that is observed to be relatively unchanged between epochs.
The stars Br7, Br8, Br44, Br87 and Br94 appear in the upper left-hand part of Fig. 4. They have relatively small combined normalized standard deviations. Stars that appear in this part of the plot could be long-period binaries, since they would be expected to show changes in velocity over well-separated epochs but have low standard deviations within an epoch, as discussed above in Section 3.2. Niemela (1995) claimed radial velocity variations over several years for Br44 and suggested that it might be a long-period binary. Perhaps the other four stars might be long-period binaries as well, although Br7 and Br8 have no OB absorption lines in their spectra, as expected for such faint WR stars.
In Fig. 5, MG6 (and, to a lesser extent, Br28, Br87 and Br94) has a large radial velocity difference but relatively small combined normalized standard deviation. This could indicate that it is a long-period binary. However, the accuracy of the velocity measurements is to be doubted, and its apparently large velocity difference might be due to measurement errors stemming from its noisy emission profile and systemic differences in centring the multiple stellar image on the slit.
As expected, the plot of radial velocity in excess of the milieu velocity as a function of We shows no sensitivity to binarity (Fig. 6). Although all of the known binaries are in the left-hand section of the plot, so are many other stars.
Finally, the FWHM of the C iv line does not appear to be dependent on whether or not a star is a binary (Fig. 7). Apparently, a companion does not affect the stellar wind speed significantly.
In the plots involving We, the position of Br93 tends to stand out from the rest with an extremely large equivalent width. This is to be expected, as it is a WO star. WO stars are very hot and produce very strong winds, hence strong emission lines relative to the continuum.
Interestingly, Δvr and FWHM tend to be negatively correlated with each other (Fig. 8). Although not relevant to binary status, this could have a bearing on wind structure as follows. stars with narrower lines (i.e. slower winds) tend to show larger velocity excess (Δvr). This anti-correlation cannot be due to the superposition of He i 5876-Å emission in the red flank of C iv 5808 Å for larger FWHM, since this would give rise to a positive correlation, contrary to what is seen. A likely origin is in enhanced P Cygni absorption effects in slower winds. For a constant mass-loss rate
 where r is the stellar radius where the line is formed, ρ is the density of absorbing gas and v is the wind speed, ρ will be larger for slower winds. This means that the radius from the star at which the continuum opacity τc (measured from the observer towards the star) is unity will be larger for a slower wind, making a wider cross-section in the C iv shell that can absorb photons. Consequently, the ratio of the volume of the absorbing region (‘A’ in Fig. 8) to the volume of the emitting region (‘E’ in Fig. 8) (within the region of the wind containing C iv ions) will be larger for slower winds. The emission line of a slower wind will have more of its blue component reduced than will one of a faster wind, making the line more redshifted and yielding a larger Δvr (see schematic profiles in Fig. 8).
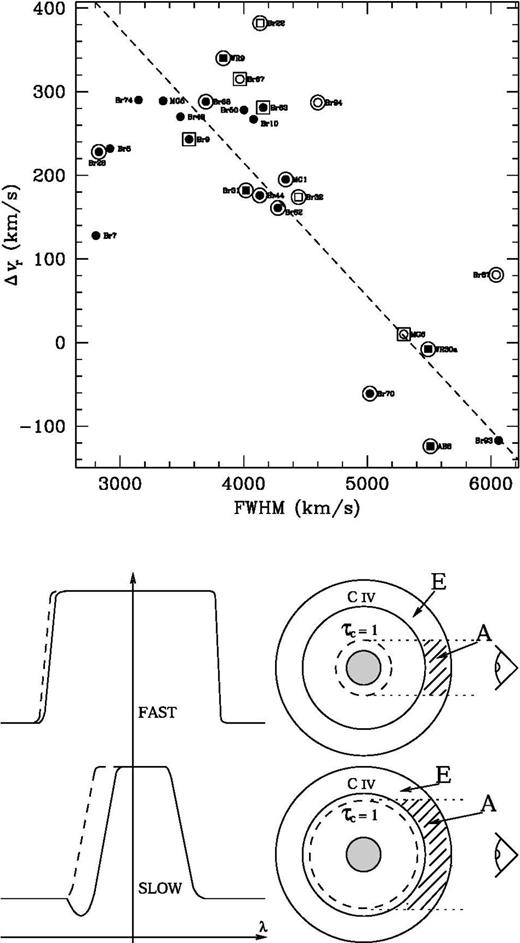
Correlation of radial velocity deviation with FWHM (top) and cartoon showing opacity radii with their effect on the size of the P Cygni absorbing region (bottom). The symbols in the top plot are as in Fig. 2 with the dashed line indicating an apparent correlation (the Spearman rank-order coefficient its t-statistic
 and the statistical significance level of the correlation
 calculated using the Student's distribution probability function). The bottom right diagrams show stars with different opacity radii for fast and slow winds (dashed circles), the resulting absorption regions of the Civ line-forming region (hatched areas labelled A) and the remaining viewed emission area (E). To their left are the corresponding expected line profiles (solid lines). The dashed profile is the part of the spectral line removed by P Cygni absorption.
The binary status and classification criteria of the stars are summarized in Table 6. The previously denoted spectral type of each star is given, along with the reference from which it is obtained. This is followed by the spectral type assigned in this work. The presence of visual companions that could affect the spectrum is indicated. This was determined by inspection of the photometric results in Appendix A. Finally, the estimated binary status of each star is indicated (see below for an explanation of the choices made). The line strength ratio is included in this table as it is useful for stellar classification. It is interesting to note that this line strength ratio is below 0.7 for all stars (after correction for wind–wind interaction, the ratio falls well below 0.7 in Br22 and WR 9), consistent with all WC/WO stars being of sub-class WC4 or WO [fig. 3 of Smith, Shara & Moffat (1990b)].
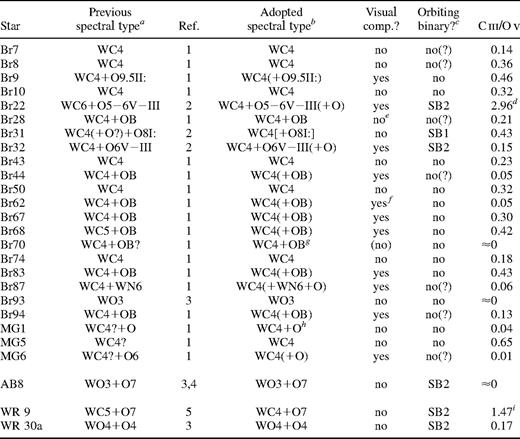
Spectral type and binarity of observed stars. The last column lists the equivalent width ratio between the C iii 5696-Å and the O v 5592-Å lines.
4 Discussion
4.1 Binary frequency
Using the above results, the estimated binary status of the Magellanic WC/WO stars may be summarized as follows. (Spectroscopic binary is designated by SB.)
Definitely SB: Br22, Br31, Br32, AB8.
Potentially SB: Br28, Br44, Br87, Br94, MG6.
Probably single: Br7, Br8.
Almost certainly single: Br9, Br10, Br43, Br50, Br62, Br67, Br68, Br70, Br74, Br83, Br93, MG1, MG5.
With their high velocity dispersions (cf. Fig. 2), the stars Br22, Br31, Br32 and AB8 are clearly binary. They have all been noted as such by previous investigators.
MG6 is a potential binary star owing to its high radial velocity dispersion shown in Fig. 2. In performing an F-test using the radial velocity variance of MG6 in the 1993 December epoch compared with the mean rms variance of the overall LMC sample (without the inferior quality MG star data), one may conclude, with 99 per cent confidence, that MG6 is not binary. It is interesting that the above F-value of MG6 was found to be comparable to that calculated in the same manner for Br74, the star with the lowest radial velocity variance and almost certainly single. In any case, the F-values, deduced similarly, for the three certain LMC binaries are very high.
MG6 also appears to have radial velocity variations between epochs (Fig. 5). All of this, however, could very well be due to the very noisy spectral data obtained for this star, as well as systematic epoch-dependent differences in centring the star on the slit, no doubt as a result of crowding (see Appendix A), yielding poor radial velocity results. This appears to be unique to MG6 and is not related to sparsity of data for this star.
The stars Br87 and Br94 have moderately high σvr, appearing on a region borderline to the known binaries (Fig. 2). They also show large changes in average radial velocity between epochs (see Figs 4 and 5). Both stars, however, have unresolved companions and the spectrum of Br87 is contaminated by the light of a binary WN star (Moffat et al. 1987). The radial velocities of neither star reveal periodicities.
Br28 and Br44 are listed as potentially SB as well because of their radial velocity changes between epochs (Fig. 4 for Br44 and Fig. 5 for Br28). These are very marginal, however, and the stars fail the binary test in other ways.
The stars Br7 and Br8 are listed as probably single since the only evidence that they might be binary is the radial velocity difference between epochs (Fig. 4), which is marginal in any case. These stars have the large equivalent widths and lower brightnesses of single stars (cf. Fig. 3) and even lack the presence of OB absorption lines.
In fact, all of the potential binary stars would require periods of many months. Any star with a period of up to a few months would produce radial velocity variations, σvr, that would be easily noticeable (unless the inclination of the system were fortuitously very close to zero). In any case, none of the seven LMC stars noted ‘potentially SB’ or ‘probably single’ gives compelling evidence of being a binary.
Without more spectroscopic data, the only Magellanic WC/WO stars that may be seriously considered to show binarity are the four classified as definitely SB. One of these is in the SMC, leaving three definite binaries out of 23 WC/WO stars studied in the LMC. Allowing for the new WC4 star, TSWR4, discovered recently (Testor et al. 1993), which is very faint and hence most likely to be single, one would have three definite binaries out of 24 WC/WO stars in the LMC.
4.2 Implications for evolutionary scenarios
Maeder's theory predicted that the RLOF binary frequency of the LMC WR stars is at least 52 per cent, with an error of 14 per cent (Section 1). This prediction must be viewed as a minimum binary frequency when considering the overall binary population, since long-period binaries [initially (Vanbeveren 1998)] would not evolve, via RLOF, into
 systems.
However, only three of the 23 LMC stars in the present study are definitely binary. This is only just over 13 per cent. Is the observed binary frequency still compatible with the theory? The studied stars only constitute a relatively small sample and do not necessarily comprise the entire population of WC/WO stars of the LMC. There might be other stars that have yet to be discovered in this galaxy (single or otherwise), as well as those that existed in the past and others to evolve in the future. Other galaxies might have WC/WO stars in environments of similar metallicity. The sample could simply be an aberration.
To test whether or not the observed binary frequency is compatible with theory, the cumulative binomial probability that three or fewer binaries would be detected amongst 23 observed stars was examined, assuming with a probability of per cent that any given star would show binarity. The probabilities are displayed in Fig. 9. The results of observation disprove the hypothesis at the 1 per cent significance level, even at the lower limit of the predicted binary frequency of
 [Fig. 9 does not allow for systems that might escape detection as binaries owing to low orbital inclination. However, the number of systems missed because of this and with periods less than 200 d (i.e. where RLOF has taken place) is expected to be significantly less than unity. The main reason for this is the rarity of low-inclination systems as compared with intermediate- and high-inclination binaries. For a random distribution in i, the probability of a binary with inclination i′, occurring within a given interval between i and
 is
is and is drastically reduced for small i.]

Cumulative binomial probabilities for an expected binary frequency of The dotted lines show significance levels at 1 and 5 per cent.
What of the five LMC WC/WO stars judged to be potential binaries? Inclusion of these stars as binaries would provide compatibility with the predicted minimum binary frequency, except at its upper limit. However, such stars, if binary at all, would probably have long periods (more than many months). On the other hand, any progenitor binary system that becomes via RLOF is expected to lose angular momentum in the process, leading to final systems of relatively short period (Vanbeveren et al. 1998). In fact, the quantitative simulations of Wellstein & Langer (1999) show that
 binaries with periods in the range ≈
 will pass through a common-envelope stage, leading to a dramatic decrease in the period and hence a fall in the number of WR binaries in this period range. Our lack of sensitivity to radial velocity variations for
 (peak-to-peak radial velocity amplitude much less than 200 km s−1) may thus not be of significant importance in the context of RLOF-produced WR binaries. None of these five stars has shown clear binarity in this study.
Even neglecting the possibility of common-envelope evolution, the lack of radial velocity sensitivity to binaries in the range will not significantly alter the results. Assuming a flat distribution of binary frequency with log P [as found for B stars by Abt & Cardona (1984), and possibly amongst O stars by Mason et al. (1998)] for WR stars, one would expect to find only 1.5 additional binaries in the range
 compared with the observed number of binaries (3) in the
 range.
Perhaps some of the stars deemed single were once part of binary systems but are now runaways (former binaries whose companions exploded as supernovae). These could be candidates for short-period binaries that could render the sample compatible with Maeder's theory. This, however, is unlikely since not only is such a process very rare, but also the stars presumed to be single, in this investigation, tend to have normal radial velocities (Fig. 6). The velocities of runaways should be randomly distributed as there is no reason for the stars to be ejected from a disrupted binary system in a preferential direction. In any case, most massive stars that become WR stars will collapse to black holes without a supernova explosion (Vanbeveren et al. 1998).
With only one WC/WO star in the SMC, no conclusion can be drawn for that galaxy. The fact that AB8 is a binary does not prove or disprove the theory.
5 Conclusions
From this first comprehensive study for binaries among a viable, uniform sub-sample of WR stars, only 13 per cent of the LMC WC/WO stars were found to be binary with any certainty. This is significantly lower than the minimum prediction derived from models of RLOF. [It is possible that binaries might have been missed in the sample in isolated cases owing to very low orbital inclination, very long orbital period (which is irrelevant to evolution through RLOF) or presence in tight multiple systems.]
In the extreme case of 13 per cent of the stars being binaries, we conclude that WR stars can evolve without the need for a binary companion, even in a low-metallicity environment. Maeder's proposed evolutionary mechanism would then not appear to explain the large number of WR stars in the LMC. It seems that the wind mass-loss rates of O stars, Of stars, supergiants and/or luminous blue variables might be higher (and/or their masses might be lower) than previously thought. Perhaps the strong winds of massive stars dominate any gravitational influence by even a close companion (as suggested by Fig. 7). Evidence for enhanced emission line strengths, however, can be seen in WC/WO binaries via wind–wind collisions (see Paper II).
On the other hand, in the unlikely event that all five of the potential SBs are actually close binaries, the observed binary frequency of 35 per cent would then be compatible with the evolutionary mechanism to explain the large number of WR stars in the LMC.
A more recent study of WR and O populations in young starbursts by Schaerer & Vacca (1998) suggests that WC/WO stars might be less sensitive than WN stars, and especially WNE stars, to metallicity, originating from stars of initial mass >40 M⊙. It may be better, then, to look at the binary frequency among WNE stars (with lower-mass progenitors on average), which are more sensitive to metallicity. Such a programme has been initiated (Foellmi & Moffat, in preparation).
Acknowledgments
PB is grateful to the staff of Complejo Astronómico El Leoncito for their technical assistance and hospitality during his two observing runs there. CASLEO is operated under agreement between CONICET, SeCyT and the National Universities of La Plata, Cordoba and San Juan, Argentina. The photometric data were obtained by staff of UTSO. PB gratefully acknowledges financial aid provided by the Physics Department Astronomy Group of the Université de Montréal from its FCAR/équipe grant, as well as from a ‘Bourse de production de mémoire et de thèse’ from the FICSUM of the Fédération des associations étudiantes du campus de l'Université de Montréal. AFJM acknowledges financial support from NSERC (Canada), FCAR (Québec) and the Canada Council of the Arts. AFJM and VSN are grateful to the director and staff of the Cerro Tololo Interamerican Observatory for the use of their facilities. The Cerro Tololo Interamerican Observatory (NOAO) is operated by AURA Inc. for the National Science Foundation. We acknowledge the use, at Complejo Astronómico El Leoncito, of the CCD and data acquisition system supported through US NSF grant AST-90-15827 to R. M. Rich.
References
Appendix
Appendix A: Atlas of programme stars
In this appendix, a spectral atlas of the programme stars is presented. It consists of the mean spectrum of each object, found by taking the average of reduced spectra from the 1993 November mission at CASLEO. Two vertical scales are used for clarity. For Br22, important absorption lines of the OB companion star are labelled. The two crosses designate poorly subtracted interstellar absorption lines that do not arise in the OB star.


Spectral atlas of the programme stars.
A twenty-fourth WC4 star, not listed in the Breysacher (1981) catalogue, was reported after the observations were obtained (Testor, Schild & Lortet 1993). It is very faint (V = 17.7) and, for this reason, was probably missed in preparation of the catalogue. It is No. BAT 69 in the new catalogue of LMC WR stars of Breysacher, Azzopardi & Testor (1999)
The fact that many WR binaries with periods P ≳ 30d have elliptical orbits may already cast some doubt on the RLOF process.
Author notes
Killam Fellow of the Canada Council for the Arts.
Visiting Astronomer, Cerro Tololo Interamerican Observatory, National Optical Astronomy Observatories.
Member of Carrera del Investigador, CIC, Prov. Buenos Aires, Argentina.
