


Abstract
Quasars are widely believed to be powered by accretion on to supermassive black holes and there is now considerable evidence for a link between mergers, the activity of quasars and the formation of spheroids. Cattaneo, Haehnelt & Rees have demonstrated that a very simple model in which supermassive black holes form and accrete most of their mass in mergers of galaxies of comparable masses can reproduce the observed relation of black hole mass to bulge luminosity if black holes accrete a fraction of the mass in the merging remnant that varies with redshift. Here we investigate whether this simple model can account for the luminosity function of quasars and for the redshift evolution of the quasar population. We simulate hierarchical galaxy formation through the extended Press–Schechter formalism and assume that, when two galaxies of comparable masses merge, their central black holes coalesce and a fraction of the gas in the merger remnant is accreted by the supermassive black hole. We find that the decrease in the merging rate with cosmic time and the depletion in the amount of cold gas available due to star formation are not sufficient to explain the strong decline in the space density of bright quasars since z∼2, if the fraction of accreted gas does not decrease at low redshift, as larger and larger structures form, which can potentially host brighter and brighter quasars. Moreover, we need another mechanism besides major mergers to explain the emission from the brightest quasars, and we speculate that fuelling from hot gas may be this mechanism.
1. Introduction
Considerable evidence points towards a connection between the activity of quasars and the formation of spheroids.
High-resolution imaging reveals the presence of host galaxies around a number of quasars (see e.g. McLure et al. 1999). McLeod (1997) finds a correlation between the luminosities of quasars and those of the host galaxies (see also Percival et al. 2001, who argue against the presence of a correlation). Franceschini et al. (1999) find a striking similarity between the light history of quasars and the star formation history of elliptical and S0 galaxies.
Since Lynden-Bell (1969), it has become widely accepted that quasars are powered by accretion on to supermassive black holes (see Rees 1984 and references therein). The detection of supermassive black holes in the nuclei of a number of nearby galaxies has confirmed this paradigm and strengthened the evidence for a connection between galaxies and quasars. It is now a common belief that most galaxies have passed through a quasar phase and contain relic black holes. The estimated masses of central black holes are correlated with the luminosity of the host bulge (see e.g. Kormendy & Richstone 1995; Ford et al. 1998; Ho 1998; Magorrian et al. 1998; Richstone et al. 1998; van der Marel 1998). Supermassive black holes harboured by spiral galaxies are not so massive (Salucci et al. 2000).
The connection between quasars and spheroids suggests a unifying mechanism for fuelling supermassive black holes and forming spheroids. A mechanism with these characteristics is known to exist and is provided by mergers. N-body simulations have shown that mergers of galaxies of comparable masses (major mergers) result in the formation of elliptical galaxies (see e.g. Barnes 1988; Hernquist 1992, 1993; Hernquist, Spergel & Heyl 1993; Heyl, Hernquist & Spergel 1994). Kauffmann & Charlot (1998) have demonstrated that the merger scenario for the formation of elliptical galaxies is consistent with the colour–magnitude relation and its redshift evolution. Hydrodynamic simulations have found that shocks due to mergers can cause gas in the interacting galaxies to fall rapidly to the centre of the merged system and to fuel a burst of central activity (Negroponte & White 1983; Barnes & Hernquist 1991, 1996; Mihos & Hernquist 1994, 1996). These computational results have their observational counterparts, since a significant fraction (although not the whole) of the imaged quasar population is known to reside in interacting systems (see e.g. Bahcall et al. 1997; McLure et al. 1999).
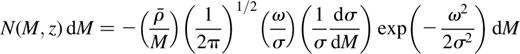
The most striking observed property of the quasar population is the redshift evolution of the comoving number density which has a peak at z ∼ 2-3 Scenarios for the formation of structures through hierarchical clustering in a cold dark matter (CDM)-dominated universe explain the decline at z ≳ 3 assuming that quasars are linked to the collapse of the first dark matter haloes of galactic mass (see e.g. Efstathiou & Rees 1988; Haehnelt & Rees 1993). The standard approach for modelling the evolution of the quasar population in cosmological scenarios is to combine the mass function of dark matter haloes (approximated by the Press–Schechter formula) with a prescription for associating a galactic luminosity and a quasar light curve with each dark matter halo in order to reproduce the luminosity functions of high-redshift galaxies and high-redshift quasars (see e.g. Carlberg 1990; Haiman & Loeb 1998; Haehnelt, Natarajan & Rees 1998; Haiman & Menou 2000; Monaco, Salucci & Danese 2000). Despite these successes, the approximation of a one-to-one relation between quasar hosts and dark matter haloes is very crude and breaks down at low redshifts. This justifies the need for a treatment in which quasars are directly linked to host bulges rather than to dark matter haloes.
Cattaneo, Haehnelt & Rees (1999) have shown that a very simple model in which, after each major merger, the central black holes in the progenitors coalesce and a fraction of the cold gas in the merger remnant is accreted by the merged black hole can reproduce the observed relation of black hole mass to bulge luminosity. Here we investigate whether this very simple model, in which both quasars and spheroids form through major merger, can account for: (i) the shape of the luminosity function of quasars (Section 5), and (ii) the redshift evolution of the quasar population (Section 6). The predictions of the model depend on the merging rate, on the mass function of the merging remnants, and on the prescription used to associate a light curve with a merger (fraction of accreted gas, time distribution of the accretion, radiative efficiency).
Merging rates are computed through Monte Carlo simulations of galaxy formation in the extended Press–Schechter formalism. The galaxy formation scheme is described in Section 2 and is tested for agreement with the following observational data: the total luminosity function of galaxies, the luminosity function of early-type galaxies, the redshift dependence of the total star formation rate and the redshift dependence of the abundance of neutral hydrogen in damped Lyα clouds.
A similar analysis at a more sophisticated level for the modelling of galaxy formation has been presented by Kauffmann & Haehnelt (2000). Kauffmann & Haehnelt have used an explicit treatment of stellar population synthesis enabling them to compute self-consistently galactic luminosities, colours and metal abundances. Moreover, they have also addressed the issues of the evolution of starbursting galaxies and of the implications of mergers for the structural properties of ellipticals. The emphasis of this article is, instead, on the mechanism that determines black hole masses and on the effects of different light curves on the luminosity function of quasars. Moreover, it includes a discussion of the effects of different regimes of accretion, of the spin of the black hole and of a possible feedback mechanism of the central black hole on the host galaxy (see e.g. Silk & Rees 1998). However, the results of this work and that of Kauffmann & Haehnelt agree on two fundamental points: the importance of the consumption of gas by star formation to explain the low-redshift evolution of the quasar population and the failure of the merger model to account for the bright end of the quasar luminosity function at high redshift.
2. Monte Carlo simulations of the formation and evolution of galaxies
2.1. Merging histories of dark matter haloes
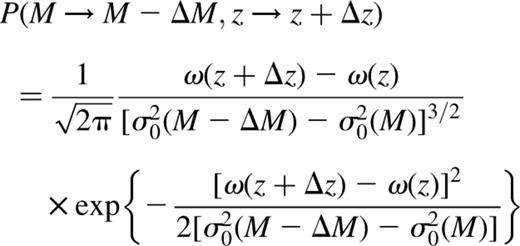
The density of a virialized dark matter halo is a function of the redshift of collapse only and is equal to the product of the turn-around density and the cube of the radial contraction between turn-around and virialization, the precise value of which depends on the cosmological constant (Lahav et al. 1991).
2.2. The galaxy formation scheme
The modelling of galaxies within hierarchal cosmogonies has reached a considerable level of complexity. Here we concentrate on the effects of major mergers on the growth of supermassive black holes. Therefore, we adopt a rather simple scheme for galaxy formation similar to that proposed by White & Rees (1978), which captures the essential features of the hierarchical merging of galaxies.
Following Kauffmann, White & Guiderdoni (1993), we assume that cooling only forms discs, and that bulges and elliptical galaxies form through mergers of galaxies of comparable masses.
The ability of the gas to cool depends on the temperature and the density of the gas. For cooling through emission of atomic lines these dependences conspire to give an upper limit for the mass of the gas that can cool of ƒbM ∼ 3 × 10¹³ƒmƒb2M⊙, where ƒb ≡ Ωb/ΩM is the fraction of the mass of the halo in baryons and ƒm is the metal content compared with solar abundances (Silk 1977; Rees & Ostriker 1977). The cut-off to the cooling in high-mass haloes is modelled assuming that the fraction which can cool scales as 1/(1 + Mhalo/Mlim). Gas for which tcool <, tdyn is assumed to cool and settle into a disc on the dynamical time-scale (tcool and tdyn are the cooling and the dynamical time). Given that we expect at least some enrichment rather early in the progress of the hierarchy, we keep things simple by using for ƒm the present mean metal abundance of the Universe, which we assume to be given by the metallicity of the Sun (see e.g. Pei & Fall 1995). In this treatment we have assumed a single cooling time for the whole halo; this is a gross approximation. In the Navarro, Frenk & White (1996, 1997) density profile, the local cooling time and the local dynamical time at a radius r from the halo centre are tcool(r) = tcool(r/rvir)2 and tdyn(r) = tdyn(r/rvir), where tcool and tdyn are the global cooling time and global dynamical time, while rvir is the virial radius. Thus, cooling starts from the centre and extends to the whole virialized region. However, the approximation that all the gas cools simultaneously is unlikely to affect our results in any significant way, particularly in haloes where tcool < tdyn, and since, in any case, we shall assume a very long star formation time-scale (5-10 Gyr). The fact that is more worrying is that gas at r > rvir can still cool and flow to the centre (this is precisely what happens in cooling flows), so that the real value of Mgal/Mhalo decreases less rapidly than 1/(1 + Mhalo/Mlim). However, if we allow this gas to cool, we quickly end up with an excess of bright galaxies. A solution to this problem is to introduce a circular velocity threshold above which gas is unable to cool (e.g. Kauffmann et al. 1993). This solution gives us too many bright galaxies (see Cattaneo et al. 1999), although it improves the fit to the quasar luminosity function (see Section 7). Our opinion is that cooling has a different nature and requires a different treatment at Mhalo > Mlim We do not want to take a shortcut which hides this complexity. However, as a treatment of this problem would unduly complicate the model, we prefer to use equation (3), which we know to be inaccurate, and see whether there is a need to consider cooling in haloes with Mhalo > Mlim to explain the properties of the quasar population. [See also how the problem of cooling is treated in Cole et al. (2000).]
Feedback from star formation is more important in haloes with shallower potential wells and therefore smaller escape velocities (see e.g. Dekel & Silk 1986; Kauffmann et al. 1993). Natarajan (1999) derived an estimate of the fraction of gas mass ejected through supernova explosions by dividing the total effective energy output from supernovae by the specific kinetic energy required to escape from the dark matter halo (∼2vc2 where vc is the halo circular velocity). This argument gives a scaling of the fraction of baryonic mass lost through supernova feedback ƒej of the form ƒej = (vc/vSN)−2 at vc > vSN, where vSN is a critical circular velocity below which very little gas is retained by the halo. In principle, we could compute the value of vSN from assumptions on the star formation rate, the initial mass function, the energetics of supernova explosions and the fraction of the energy output that goes into the reheating of the interstellar medium, but that would end up introducing more parameters than we aim to fix. Here we adopt the more phenomenological approach of considering vSN as a free parameter of the simulations.
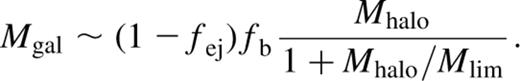
Here we take this upper limit as the mass of the disc that cooling forms at the centre of the dark matter halo. Expression (3) ensures that Mhalo ≤ ƒbMhalo.
Notice that in this simple model the mass of the galaxy depends only on the mass and the redshift of collapse of the dark matter halo. Similarly the rate of accretion of mass on to the disc depends only on the redshift evolution of the mass of the halo due to its merging into a larger structure in the hierarchy. Feedback is directly related to the depth of the potential well and is not an additional independent element in determining the rate of mass deposition on to the disc of the galaxy at the centre of the halo.
As in Kauffmann et al. (1993), we introduce a critical mass ratio ƒe above which a merger produces an elliptical galaxy. For mass ratios below the threshold, the smaller galaxy is assumed to be tidally disrupted and its mass is added to the disc of the larger one. The value of ƒe is determined by requiring the Monte Carlo simulations to reproduce the observed bulge luminosity function, once the other free parameters have been fixed.
We model star formation by assuming that the conversion of cold gas into stars is described by an exponential decay with time of the mass in cold gas. The initial reservoir of cold gas available to form stars consists of the total amount of gas cooled on to the galaxy since the last major merger for a spiral galaxy, and of the total amount of cold gas present in the discs of the parent galaxies for an elliptical galaxy. Notice that our model implies a scenario in which the cooling rate is much faster than the star formation rate, so that the latter depends only on the former through its integral with respect to time. Figs 1 and 2 show the redshift dependence of the total mean density of star formation and of the mean cosmological mass density in cold gas as they result from our Monte Carlo simulations. The results of the simulations are consistent with the observations if the star formation time-scale is constant (≲5 Gyr) or mildly decreasing with redshift [∞ (1 + z)−0.5]. Here we restrict our attention to the simple case of a constant star formation time-scale. The total mean star formation density is dominated by star formation in discs, even if about half of the galactic mass ends up in spheroids, because mergers convert disc stars into bulge stars.
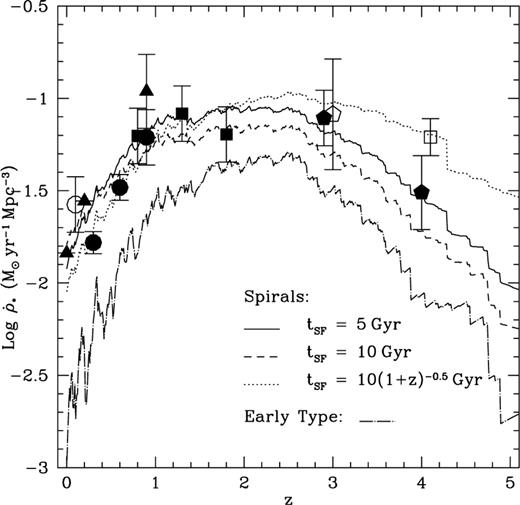
Mean comoving density of star formation as a function of redshift. The three upper lines show the total density of star formation from our simulations for a baryonic density parameter of Ωb =0.026 and a disc star formation time-scale of: (i) 5 Gyr (solid line); (ii) 10 Gyr (dashed line); (iii) 10(1 + z)−0.5 Gyr (dotted line). The dashed-dotted line shows the contribution of star formation in elliptical galaxies (the mean cosmological density of star formation in spheroids is controlled by the merging rate and does not depend on the star formation time-scale as long as this is much shorter than the Hubble time). The data points for the mean total comoving density of star formation are inferred by Madau, Pozzetti & Dickinson (1998) from the UV-continuum measurements by Lilly et al. (1996; filled dots), Connolly et al. (1997; filled squares), Madau et al. (1998; filled pentagons), Treyer et al. (1998; empty circle) and Steidel et al. (1999; empty square). The filled triangles show the Hα determinations by Gallego et al. (1995), Tresse & Maddox (1998) and Glazebrook et al. (1999). The empty pentagon gives the SCUBA lower limit (Hughes et al. 1998). Comoving densities of star forming galaxies are converted into comoving densities of star formation assuming a Salpeter initial mass function with a low-mass cut-off at ∼0.1 M⊙ (data from Madau et al. 1998; Franceschini et al. 1999). All data have been rescaled for a cosmological model with H 65 kms−1 Mpc−1, ΩM = 0.35 and ΩA = 0.65
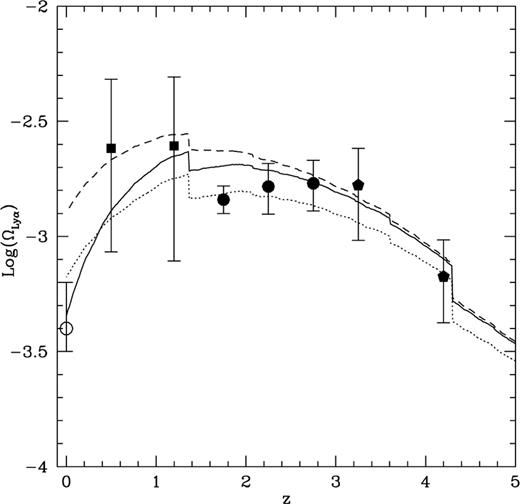
Cosmological density parameter of neutral hydrogen in potential wells of vc > 70 kms−1 for a star formation time-scale in discs of (i) 5 Gyr (solid lines); (ii) 10 Gyr (dashed lines); (iii) 10(1 + z)−0.5 Gyr (dotted lines). The data points give the determinations of the cosmological density parameter for neutral hydrogen in damped Lyα absorbers in Wolfe et al. (1995; filled circles), Rao & Turnshek (1999; filled squares) and Storrie-Lombardi & Wolfe (in preparation; filled pentagons). Dust absorption can affect these determinations by a factor of ∼2. The open circle at z ∼ 0 is the local density in neutral gas as measured by Rao & Briggs (1993). Data from Rao & Turnshek (2000) are rescaled for H = 65 kms−1 Mpc−1, ΩM =0.35 and ΩA =0.35. Assuming that most of the cold gas at z ≲ 4 is in clouds of very high column density because dissipation is very effective in concentrating baryons at the centre of dark matter haloes, we find a reasonable agreement with the data on damped Lyα absorbers for Ωb ∼ 0.026.
We fit the dust-corrected mean cosmological density of neutral hydrogen in damped Lyα absorbers for Ω ≳ 0.026. The equality holds if dissipation is very effective in concentrating baryons at the centre of dark matter haloes and most of the mass in neutral hydrogen at z ≲ 4 is in clouds of very high column density. A baryonic density significantly larger than Ωb ∽ 0.026 implies that only a fraction of the gas that is able to cool goes into the formation of visible stars. The remainder must be either reheated and ejected or end up in a population of sub-stellar objects, which can account for the dark matter in discs and baryonic haloes. This value is consistent with that of Ωb in Fukugita, Hogan & Peebles (1998), who estimated the global budget of baryons in all states in the range 0.008 ≲ Ωbh652 ≲ 0.048 (here h65 ≡ H/65 kms−1 Mpc1). This value is consistent with that from primordial nucleosynthesis [Copi, Schramm & Turner 1995, 0.017 ≲ Ωbh652 ≲ 0.057 Schramm & Turner 1998, Ωb ∼ (0.047 ± 0.09)h65-2; Burles & Tytler 1998a,b Ωb(0.045 ± 0.02)h65-2] within observational uncertainties. A discrepancy of a factor of 2 is justifiable with the crudity of the model. If we trust this result to be physical, almost half of the gas that can cool must either go into a population of sub-stellar objects or remain in the halo, where it is kept in a re-ionized warm phase by the energy input due to feedback from star formation. This is an interesting problem, but it has few consequences on our conclusions, which are not very sensitive to the baryonic fraction.
The simulated mass functions of galaxies and spheroids at z = 0 are consistent with the observed B-band luminosity functions for a mean mass-to-light ratio in solar units of M/LB ∼ 2.5 for discs and M/LB ∼ 7 for spheroids (Fig. 3; values for Ωb = 0.026). Notice, however, that these are just mean mass-to-light ratios to convert mass functions into luminosity functions and are decoupled from the star formation history of the galaxies, since our code does not contain any scheme for the synthesis of stellar populations. For comparison, Fukugita et al. (1998) find a mean stellar mass-to-light ratio of M/LB = 1.5 ± 0.4 for discs and M/LB = 6.5 ± 2.0 for spheroids.
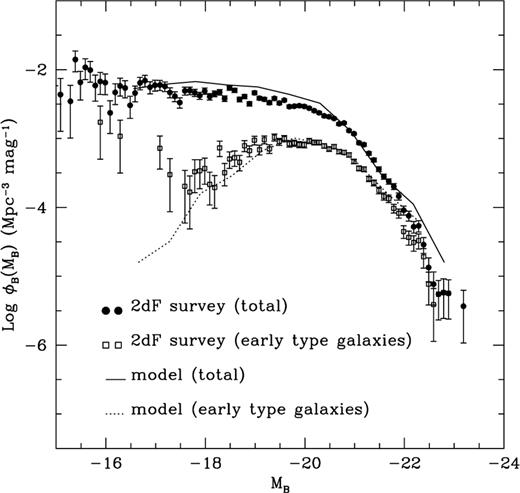
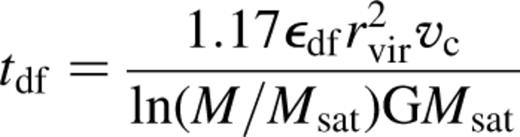
Observed and simulated B-band galactic luminosity functions. Early type galaxies are classified as Type 1 galaxies in the 2dF redshift survey (Folkes et al. 1999; Ronen 1999). An acceptable fit to the data is found for Ωb ∼ 0.026, vSN ∼ 100 kms−1, ƒ ∼ 1 and mean mass-to-light ratios in solar units of M/LB = 2.5 for discs and M/LB = 7 for spheroids. Major mergers result in the formation of a bulge for mass ratios above ƒ ∼ 0.2. The total luminosity function and the luminosity function of early-type galaxies are both strongly dependent on the dynamical friction parameter εdf (equation 4). An acceptable fit of the data is obtained for 2 < εdf < 3 and this figure has been plotted for εdf = 2.6. Larger values of εdf make mergers less frequent, reduce the fraction of elliptical galaxies, decrease the number of bright galaxies and cause the faint end of the total luminosity function to rise. The observed luminosity function of early-type galaxies at MB ≳ - 18 is dominated by diffuse dwarf ellipticals which are morphologically distinct from elliptical galaxies (Sandage & Binggeli 1984; Wirth & Gallagher 1984) and are thought to have no connection with supermassive black holes.
At this point we have set all the free parameters of the model: the density parameter of baryons, Ωb, the minimum circular velocity below which practically all the gas is expelled by supernova explosions, vSN, the mean metal abundance of the universe setting an upper limit to the masses of galaxies, ƒm, the factor by which the dynamical friction time-scale increases because of tidal stripping, εdf, the critical mass ratio to form elliptical galaxies in mergers, ƒe, the star formation time-scales and the mass-to-light ratios for discs and spheroids.
3. The model for the growth of supermassive black holes
Supermassive black holes grow through mergers with other supermassive black holes and through accretion of gas. They may also grow through tidal disruption and accretion of stars in a very dense nuclear cluster, but we are not discussing this possibility here.
After a galactic merger has taken place, the supermassive black holes contained in the merging galaxies sink to the centre of the new galaxy owing to dynamical friction, form a binary system and eventually coalesce. The time-scale for this process is uncertain, and its final outcome can also be quite different, if another galactic merger intervenes before the supermassive black holes have time to merge (Begelman, Blandford & Rees 1980), but here we assume that this time-scale is much shorter than the Hubble time, so that the supermassive black holes contained in the merging galaxies always merge. This assumption has a limited impact on the results of the simulations because the accreted mass is much larger than the initial mass in the vast majority of mergers.
Gas-dynamical simulations have demonstrated that mergers of galaxies of comparable masses can drive substantial gaseous inflows and trigger starburst activity (Negroponte & White 1983; Barnes & Hernquist 1991, 1996; Mihos & Hernquist 1994, 1996). The tidal field of a galaxy perturbs the potential of the disc of the companion. Galactic discs are unstable in the bar mode and a bar drives most of the gas in its reach to the centre. Mihos & Hernquist (1996) find that ∼80 per cent of the material that ultimately ends up in the remnant core has already collapsed into the central region (r < 350pc) of its host galaxy when the galaxies are still widely separated. The fraction of gas that collapses into the central region does not depend significantly on the ratio of gaseous to stellar mass as long as this is large enough to influence directly the structure of the bar (Barnes, private communication). Dense bulges can prevent the growth of bar instabilities until the galaxies are very close. The strongest inflows are for galaxies with dense bulges in the final stages of merging, while inflows in galaxies without bulges are weaker and occur earlier in the interaction. The final stage of the process is the formation of a Lindlbad resonance which stops any further inflow.
It is unclear how gas concentrates gas from a scale of ∼100 pc down to ∼1 pc. Here we accept as a matter of fact that large concentrations of mass in galactic nuclei do exist and assume that this stage of collapse must have occurred somehow. Surely, only a very small fraction of the material in the host system has such low angular momentum as to fall head-on on to the hole. Gas tends to radiate its thermal energy and settle into a cold, rotationally supported disc if star formation or reheating from the central source does not prevent it from doing so. Further collapse beyond this point has to be driven by viscous dissipation, although we still lack a detailed physical model in which viscous forces are computed from the structure, kinematics, equation of state and electromagnetic field of the accretion disc. A mass element loses most of its energy in this final stage of collapse, in which the inflow can be described as a progressive shrinking of circular orbits as the energy of particles is dissipated (the potential well becomes suddenly deeper and deeper towards the centre). The process of dissipation and contraction continues until the gas reaches the innermost stable circular orbit, at which point it collapses into the black hole through post-Newtonian instability even if there is no further viscous dissipation. Gas is assumed to contribute to the gravitational mass and spin of the black hole with the energy and angular momentum at the innermost stable circular orbit (Bardeen 1970), although this need not be the case if significant dissipation does happen inside the innermost stable circular orbit.
 The choice of the functional form of ƒ(t/taccr) is a delicate point, the implications of which have not yet received the necessary attention (Sections 4 and 6). An exponential decay is one possible assumption for the dependence on time of the accretion rate but there are no reasons to exclude other possibilities.
The final black hole mass is simply  where εrad is the fraction of mass–energy lost through viscous dissipation. If gas contributes to the gravitational mass of the black hole with its specific energy at the innermost stable circular orbit, then 0.057 < εrad < 0.432 (the lower and the upper limits correspond, respectively to a Schwarzschild and an extreme Kerr black hole), and
Here we raise question of what determines the values and the basic scaling properties of εaccr and taccr. There are three possible scenarios.
A number of papers (Hasan & Norman 1990; Hasan, Pfenniger & Norman 1993; Norman, Sellwood & Hasan 1996; Hozumi & Hernquist 1999) have demonstrated that a sufficiently massive central black hole can destroy the bar that fuels the nuclear engine. Hozumi & Hernquist, in particular, have used N-body simulations to estimate a characteristic mass for the disruption of a bar of ∼0.5 per cent of the mass of the disc. Here the masses of black holes are determined by dynamical processes and the basic equations are εaccr ∼ 0.01, taccr ∞ tdtn.
Alternatively, black holes could stop growing when they run out of fuel because stars have consumed all the gas available for accretion. In this scenario gas flows to the centre on the dynamical time-scale, but it is the star formation time-scale that sets the quasar life-time. Consider, for example, that both the black holes and the star formation consume gas at a rate proportional to the mass in the reservoir, but on two different time-scales tinflow ∞ tdtn and  Then
Then  and
and  The main problem in obtaining a reliable implementation of this model is that we do not know the correct assumption for the star formation time t∗. This picture is not clear even at a qualitative level since we do not know whether t∗ or tdyn decreases faster at high redshift.

 and vc is the halo circular velocity. Since
  the mass estimates of supermassive black holes in nearby galaxies require that ƒ ≲ 10−5 and even a not very powerful wind can have far-reaching implications for galaxy formation. However, as Silk & Rees themselves pointed out, the effectiveness of the expulsion will actually depend on the geometry of the outflow and, realistically, outflows are more likely to be bipolar rather than spherically symmetric. Equation (6) leads to a ratio of black hole mass to bulge mass that increases at high luminosity. Fabian (1999) has shown that it is possible to conceive a different version of this scenario in which the speed of the outflow is a fixed fraction of the speed of light and does not scale as the velocity dispersion, and has found that for this version
  This leads to a black hole mass that is directly proportional to the mass of the bulge because of the Faber–Jackson relation.
Our simulations reproduce a ratio of black hole to bulge mass of ∼0.003 for εaccr ∼0.01 (not all the mass of the merging galaxies is in gas). This ratio contains some scatter even if the value of εaccr is the same for all mergers because the gas fraction is not the same in all galaxies. The scatter increases and matches that in the data for nearby galaxies if the fraction of accreted gas decreases at low redshift by a factor of ∼10 (Fig. 4).
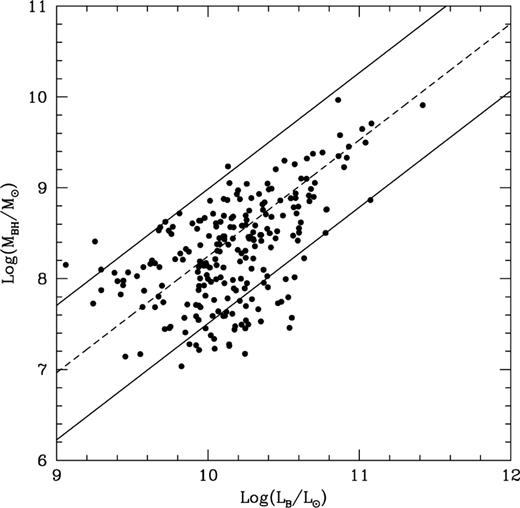
Black hole masses and bulge luminosities in a model where bulges and black holes form through major mergers. Monte Carlo simulations reproduce the slope and the scatter in the observed correlation if quasars accrete a fraction of the mass in cold gas ranging from ∼1 per cent at the peak of the quasar epoch to ∼0.1 per cent at low redshift. The solid lines enclose the region within  in the linear least-squares fit to the data on the masses of supermassive black holes in nearby galaxies as compiled by Ho (1998) and Magorrian et al. (1998). See also Cattaneo et al. (1999).
4. The radiative efficiency of quasars
Apart from the fossil evidence, from the discovery of supermassive black holes in the nuclei of nearby galaxies, all that is known about quasars derives from their electromagnetic emission. This section contains a discussion of the efficiency for converting accreted mass into radiation in its relation to the dependence of the accretion rate on time.
 corresponds to a B-band luminosity
 is the mean ratio of bolometric to B-band luminosity for quasars in the Palmer–Green sample (Sanders et al. 1989). The Eddington luminosity
 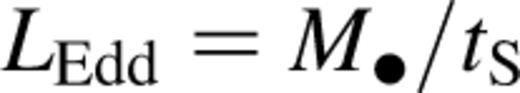 is the bolometric luminosity above which infalling material is blown away by radiation pressure. The Salpeter time
  in the expression for the Eddington luminosity is a time-scale which depends only on fundamental constants. Here σT is the Thomson cross-section, G is the gravitational constant, mp is the mass of the proton and c is the speed of light.
Equation (7) does not imply that all photons should be able to escape. As the accretion rate gets close to the Eddington limit  required to sustain emission at the Eddington luminosity, radiation pressure puffs up the accretion disc and the thin disc approximation breaks down (see e.g. Frank, King & Raine 1992). Moreover, the inflow speed becomes larger than the speed at which photons diffuse outwards in the thick disc so that photons remain trapped in the inflowing gas and are advected into the event horizon (Begelman 1978). The only detectable emission is that from the photosphere of the accretion disc. This emission is close to the Eddington limit
  if the dominant contribution to the pressure in the photosphere of the accretion disc is that of radiation pressure, but sub-Eddington if other sources of pressure are important. Consequently,
  is neither an upper nor a lower limit to the luminosity of a quasar, since photons can both come from inside the innermost stable circular orbit and be advected into the black hole. However, we may still take the minimum of this value and the Eddington limit as a reasonable indication of the luminosity of a quasar.
Now we briefly discuss the mean radiative efficiency inferred from observational data. A number of authors (see e.g. Haehnelt et al. 1998) have recognized that the mass-to-light ratio obtained following Chokshi & Turner (1992) and dividing the local density in supermassive black holes by the integral over the cosmic time of the luminosity output of quasars per unit comoving volume exceeds that for an optically thin disc (for which  by more than a factor of order 10. We confirm that we find the same problem in our simulations. The discrepancy is more severe in the absence of an efficient de-spinning mechanism, since a higher fraction of the accreted mass can go into radiation rather than contributing to the gravitational mass of the black hole. This provides motivation for the study of accretion histories that are inefficient at producing blue light. Alternative solutions are overestimated black hole masses (probable but not by more than one order of magnitude) or obscuration by dust.
The absence of reddening in observed quasars suggests that quasars are either completely obscured or very little obscured, and the assumption of quasars accreting most of their mass luminously can be reconciled with the data only if about nine quasars out of 10 are optically unseen (type 2 quasars), e.g. because they are obscured by nuclear starbursts and their presence appears only through their contribution to the X-ray background (Fabian et al. 1998). Obscuration by starbursts is a natural expectation for a scenario in which quasars form through major mergers, as central regions of merging galaxies are thought to be violently starbursting. This scenario receives some support from the fact that the present mean mass density in relic black holes inferred from the data on the X-ray background is consistent within a factor of ∼ with that derived from the mass estimates of supermassive black holes in the nuclei of nearby galaxies (Fabian & Iwasawa 1999).
An alternative to obscuration is provided by radiatively inefficient flows, which can be either low accretion rate flows, as in advection-dominated accretion flows (ADAFs; Narayan & Yi 1995), or super-Eddington flows, as those discussed at the beginning of this section, where most of the emission is imprisoned within a trapping surface (Begelman 1978). Di Matteo et al. (2000) have shown that the hard, power-law X-ray sources discovered in the spectra of six nearby elliptical galaxies can be explained as ADAFs and have inferred accretion rates of the order of 1 M⊙ yr−1 corresponding to an accretion time-scale of ∼2 Gyr. In another paper, Di Matteo & Allen (1999) have explored the implications of this result for the origin of the X-ray background, concluding that if sources with luminosities consistent with those observed in nearby ellipticals are present in most early-type galaxies, then their integrated emission may contribute significantly to the X-ray background.
Fig. 5 shows the relative importance of different regimes of accretion depending on the growth curve and the accretion time-scale. Luminous accretion dominates for  Accretion through ADAFs is minor in terms of accreted mass even for an accretion time as long as
  but significant in terms of duration of the ADAF phase and therefore of the relative probability of detecting a supermassive black hole while accreting through an ADAF. Fig. 6 shows growth curves of black holes accreting at the Eddington limit for different initial masses, where the initial mass includes any contribution from radiatively inefficient flows before the luminous phase. The discovery of bright quasars when the universe was very young
 could set a lower limit to the seed mass, but this does not currently appear as a realistic possibility.
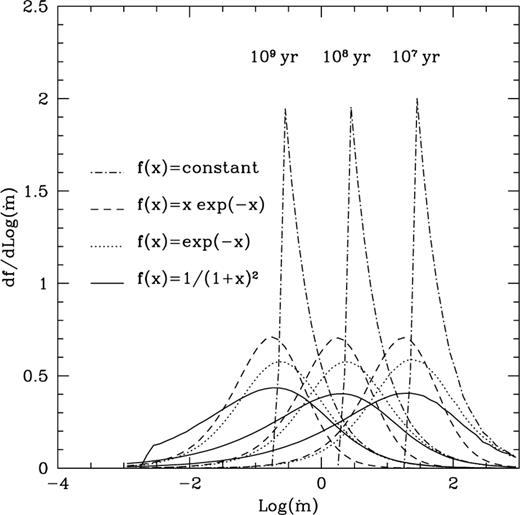
Fraction of accreted mass per logarithmic unit of  for an accretion time taccr of (from left to right) 107, 108 and 109 yr. Four different model growth curves have been considered: (i)
  (dash-dotted lines) (ii)
  (dashed lines), (iii)
  (dotted lines), and iv)
  (solid lines). A slowly decreasing growth curve spreads the accretion over a larger interval of ṁ than one with a sharp cut-off, while longer accretion times shift the peak ṁ to lower values.
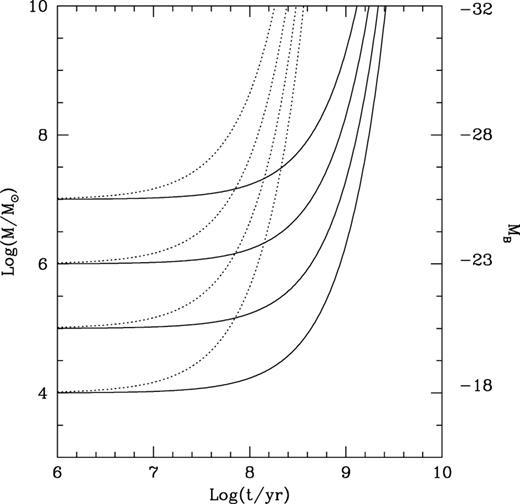
Growth curve in mass (solar units) and luminosity (B-band magnitude) for black holes growing through luminous accretion at the Eddington limit from an initial seed mass (the dotted and the solid lines show the case of the Schwarzschild and the extreme Kerr metric, respectively).
5. The luminosity function of quasars
The luminosity function of quasars is the sum of the contributions of quasars hosted by remnants belonging to different mass ranges each weighted according to the number density of hosts in that mass range. The mass function of merger remnants changes with redshift on a time-scale that is much longer than the lifetime of quasars and qualitatively it is not much different from the luminosity function of early-type galaxies in Fig. 3. At high masses it declines much faster than the halo mass function since there is a maximum value for the mass that can cool (equation 3). The decrease at low masses is because the dynamical time for small satellites is very long and very small galaxies are unable to merge. Dwarf ellipticals are not merger remnants and their morphology can be explained by considering that these systems have  so that a quick burst of star formation may have used part of the gas and ejected the remainder before gas could settle into a disc. This scenario is supported by the observation that elliptical galaxies are dense systems (suggesting further dissipation and contraction), while dwarf ellipticals are diffuse.
A quasar contributes to the luminosity function at different magnitudes in different stages of its evolution, proportional to the time spent in that luminosity range. The contribution per interval of magnitudes increases at high luminosities if  where MB(t) is the B-band magnitude at a time t after the merger. In particular, the contribution to the luminosity function is: (i) a Dirac function for
  (ii) a constant up to the highest luminosity for
  and (iii) rising at low luminosities for
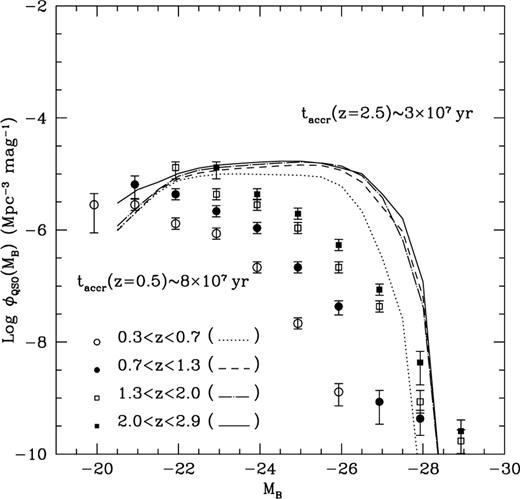
  If the accreted mass is proportional to the mass of the host and if the mass function of quasar hosts decreases at low masses, then we must assume that the luminosity function of quasars is a superposition of contributions that arise at low luminosities in order to obtain a luminosity function that arises at low luminosity. This result is confirmed by Monte Carlo simulations in which we find that the luminosity function is rising at low luminosities for a decay as a power law, but flat or declining for a decay as an exponential (Figs 7 and 8).
Observed (points with error bars) and simulated (lines) evolution of the B-band luminosity function of quasars between  and
and  The data points are from Boyle et al. (1991). The simulated luminosity function is for
  The fraction of accreted mass is chosen to reproduce a black hole to bulge mass ratio of ∼0.03. The bolometric luminosity is the minimum between
  (with
(with  and the Eddington luminosity. The assumed bolometric correction is
  (Sanders et al. 1989).
The same as in Fig. 7 apart from the fact that in this case 
The time distribution of the accretion can be altered by considering different values of taccr. A longer accretion time decreases the number of bright quasars and increases that of the faint ones (Fig. 9). Short lifetimes and high-ṁ radiatively inefficient flows have the opposite problem (Fig. 7).
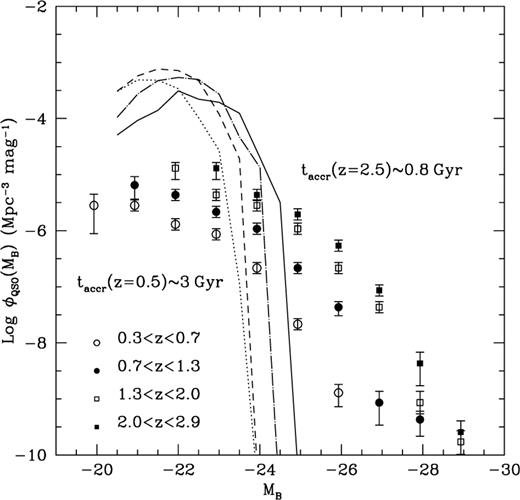
The same as in Fig. 7 except for the fact that the normalization of the accretion time is higher. The simulated luminosity function decreases at  if the emission of blue light is switched off for
  Switching off the emission of blue light at
  has no consequence for the luminosity function in Fig. 7, where most of the mass is accreted at
To understand how specific assumptions for converting the accretion rate into a blue luminosity affect the luminosity function, we have investigated the regime of accretion from which there is the largest contribution in different ranges of magnitudes. We have analysed trajectories in the MB–ṁ plane for a number of quasars extracted randomly from Monte Carlo simulations and we have found that the majority of quasars start as high accretion rate, low-luminosity objects, reach the peak luminosity while accreting at the Eddington limit and fade into darkness. This profile marks objects formed through primary accretion, while there is another class of objects that start their emission at low accretion rates, peak and decay. These are the results of refuelling by late mergers. By looking at the overall population, we have found that most of the light originates from primary accretion (there is normally one major merger in the life of a galaxy and refuelling through major mergers is rare) and comes from the decaying branch of the light curve (if quasars reach the peak luminosity very rapidly as in most of the considered models). The consequence is that faint quasars are mostly fading massive black holes accreting at low rates rather than low-mass black holes accreting at the Eddington limit. Assuming a transition to ADAFs at  suppresses the efficiency for producing blue light at low accretion rates and lowers the faint end of the luminosity function (decay at
  in Fig. 9).
Finally, we have simulated a situation where a large fraction of the gas in the merger remnant is, in principle, available for accretion but the growth stops when the central black hole reaches a critical mass at which the inflowing gas is pushed out by winds. The limit mass is specified by equation (6) in which we consider for ƒgas the fraction of the mass of the halo that is composed of cold gas. Realistically, even for an isotropical outflow most of the mechanical energy of the wind works on hot gas rather than on cold gas, and cold gas may not be blown out at all if its distribution has a sufficient degree of porosity with respect to the wind. However, this article is about a scenario in which quasars are fuelled by cold gas, and what happens to hot gas has no bearings on our results since our simulations do not include cooling flows. The only assumption which we have to make to investigate a scenario in which accretion is stopped by mechanical pressure is that a small fraction of the mechanical energy output goes into work on the cold gas distribution, even if the vast majority of the mechanical energy output will go into the ejection of hot gas. The fraction of the Eddington luminosity that goes into mechanical work on cold gas is parametrized by ƒw. A reasonable agreement with the observed luminosity function is found for the same value of  as in models without winds and for
  (Fig. 10). For a similar form of the growth curve, the model in Fig. 10 predicts more bright quasars and less faint objects than that in Fig. 7 because ejection is more efficient in small or gas-poor haloes. Fig. 10 appears much noisier than the other ones because quasar feedback reduces the number of active objects up to the point that their number is close to the resolution limit. The noise decreases as the simulated volume increases, but considering a much larger box is impractical because of the limited memory resources (unless a different technique for storing data is used).
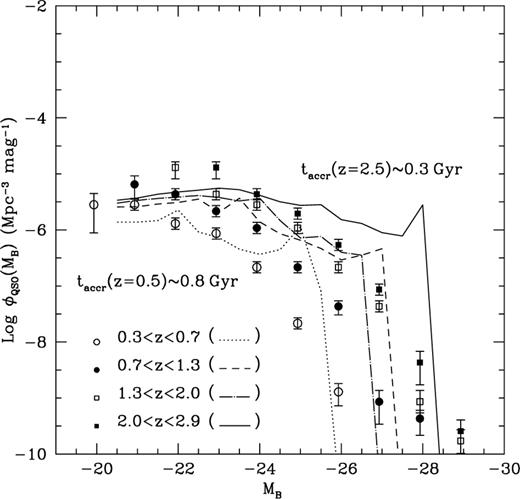
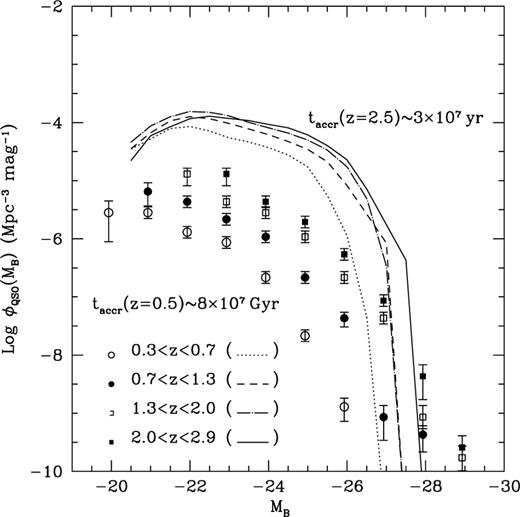
Observed and simulated evolution of the B-band luminosity function of quasars between  and
and  The simulated luminosity function is for black holes accreting at a rate of
  until they reach a mass of
  where vc is the halo circular velocity and
  Notice that in this model the real growth time is
  since winds become so powerful that the inflow is turned into an outflow before a time taccr has elapsed. This figure has been plotted for
6. The redshift evolution of the quasar population
The most striking property of the quasar population is the strong decline in the comoving density of bright objects after the peak of the quasar epoch. This observation is apparently at odds with the hierarchical scenario for structure formation, in which fluctuations on small scales are the first to collapse and small haloes virialize before large ones. Several hypotheses have been put forward to explain this. They include a decline in the merging rate (Carlberg 1990), an evolution of the spectral energy distribution (Caditz, Petrosian & Wandel 1991), a transition from a regime in which quasars grow at the Eddington limit to a regime of sub-Eddington intermittent accretion (Small & Blandford 1992), a transition to advection-dominated accretion flows (Yi 1996), an accretion rate decreasing with cosmic time (Haiman & Menou 2000), inefficient galaxy formation in low-redshift haloes (Monaco et al. 2000), and consumption of gas reservoirs by star formation (Kauffmann & Haehnelt 2000).
A possibility is that the evolution of the quasar luminosity function is related to a decrease in the fraction of accreted gas. Interestingly, the reduction in the fraction of accreted gas that gives the right decrease in the quasar luminosity function (Fig. 11) is also the one that gives the right scatter in the relation of black hole mass to bulge luminosity (Fig. 4). This consideration has to be taken with caution, given the possible systematic errors and selection effects in the mass estimates of supermassive black holes. Reassuringly, though, the prediction of this paper and Cattaneo et al. (1999) of a fraction of accreted mass that declines with redshift is confirmed by Merrifield, Forbes & Terlevich (2000), who obtained the age estimates for the stellar populations of 23 galaxies from the sample of Magorrian et al. (1998) and found a significant correlation between the fraction of the mass of a galaxy that lies in the central black hole and the age of the stellar population. Our interpretations of this observation are nevertheless not quite the same. Merrifield et al. (2000) suggest that black holes in older galaxies are more massive because they have had more time to grow and imply that black holes accrete mass steadily from their hosts. In our model all black holes grow on a time-scale that is much shorter than the Hubble time and black holes in older galaxies are more massive because at high-redshift conditions are more favourable for the growth of supermassive black holes.
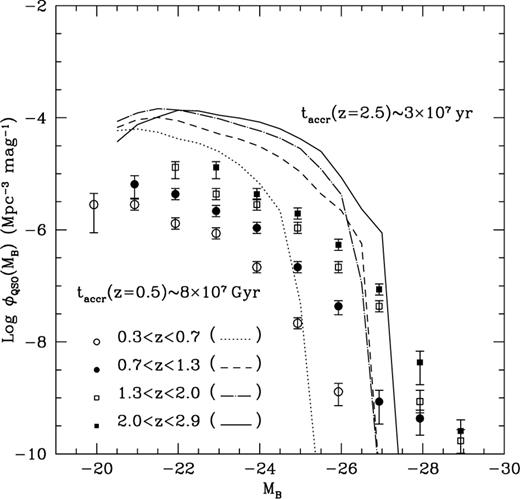
Instead, the simple idea that the low-redshift evolution is purely due to a decline in the merging rate, does not take into account that this decrement is compensated by the formation of larger and larger haloes, which can potentially host brighter and brighter quasars (Fig. 12, solid lines). The merging rate of gas-rich galaxies, which is more directly related to the rate of formation of quasars, declines more strongly than the overall one owing to consumption of cold gas by star formation (Fig. 12, dashed lines), yet still not enough to explain the low-redshift evolution, even for a scaling of the accretion time-scale as  (see e.g. Figs 7, 8 and 9). In other words, there is evidence that the decline in the frequency of gas-rich mergers is the major element in determining the fall in the number of low-redshift quasars, but alone this is not enough. One also needs to reduce the fraction of accreted gas at low redshift. We consider this conclusion to be in substantial agreement with the results of Kauffmann & Haehnelt (2000).
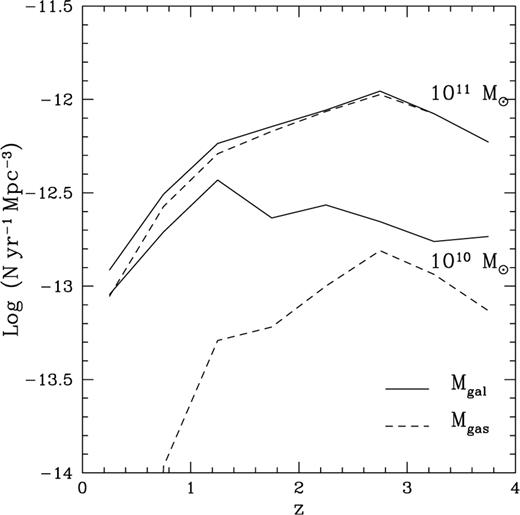
The redshift evolution of the merging rate for mergers of galaxies of comparable masses (mass ratio  containing more than 1010 M⊙ (above) and 1011 M⊙ (below) in cold gas (dotted lines) and cold gas plus stars (solid lines).
The question now is why should the fraction of available gas accreted by the black hole decrease at low redshift? The ejection scenario gives an explanation (Fig. 10): the consumption of cold gas by star formation and the upper limit on the mass that can cool conspire to reduce the ratio of cold gas to dark matter in low-redshift haloes and similarly reduce the weight of the column to expel in order to stop the accretion. Another possible answer is that low-redshift mergers are increasingly gas-poor not only in terms of absolute mass, but also in terms of gas fraction (Fig. 13). If most of the cooled mass is in stars, the gaseous disc is no longer self-gravitating and the inflow may be significantly reduced. Suppressing inflows in gas-poor mergers can cause a decline in counts of bright quasars in reasonable agreement with the observations (Fig. 11).
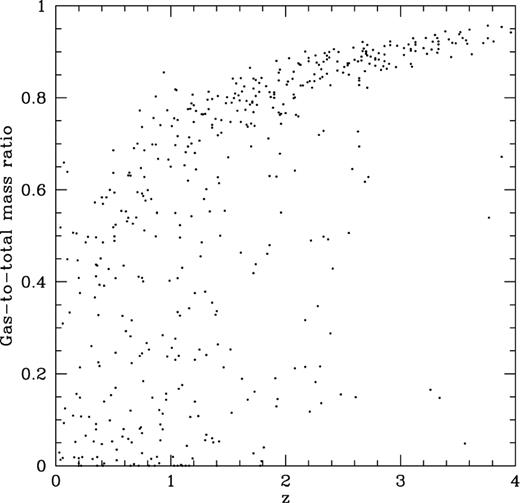
Gas-to-total mass ratios in major mergers as a function of redshift.
The same as in Fig. 7 but with  rather than
  Here Mgas is the mass in cold gas and Mgal the total mass of cold gas plus stars in the merger remnant.
A final way to achieve a reasonable fit to the observed evolution is to assume a fuelling time-scale proportional to the dynamical time and a constant star formation time-scale. The effect is to allow the growth of supermassive black holes at high redshift while pruning it at low redshift when the fuelling time-scale becomes longer than the star formation time-scale. We regard this as a contrived explanation since there is no astronomical basis to say that star formation in merger remnants works on the same time-scale at all redshifts.
7. Conclusion
We have investigated a very simple model in which both spheroids and quasars form through mergers of galaxies of comparable masses. We have assumed that cooling only forms disc galaxies and that, whenever two galaxies of comparable masses merge, the merging remnant is an elliptical galaxy, a burst of star formation takes place and a fraction of the gas in the merging remnant is accreted by a central supermassive black hole over a time-scale that scales as the dynamical time of the dark matter halo.
Our simulations portray a universe in which mergers become increasingly less frequent and gas-poor. The decline in the merging rate and the consumption of cold gas by star formation are, however, insufficient to explain the decline by more than two orders of magnitude in counts of bright quasars, and one has to appeal to additional assumptions concerning the dynamics of the fuelling mechanism or the connection between quasars and star formation in merging galaxies.
We can reproduce the low-redshift evolution of counts of bright quasars if the fraction of available gas accreted decreases at low redshift. This could be the case if gas was no longer self-gravitating, if inflows were so slow that gas forms stars before it reaches the nucleus, or because a lighter column of gas can be pushed outward more easily by winds.
Much of the uncertainty on the quasar luminosity function depends on the form of the light curve. A general result based on the assumption that the mass function of host galaxies declines at low masses is the following one: the luminosity function of quasars at low luminosities decreases if the light curve of a quasar [MB(t)] has positive second derivative and increases if the second derivative is negative.
Despite this freedom, models in which supermassive black holes accrete most of their mass through major mergers fail to reproduce the precise shape of the quasar luminosity function. All models produce an excess of quasars at  and a lack of quasars at
  (Figs 7–10). This conclusion has been established for four forms of the growth curve (see Fig. 5), accretion time-scales varying over more than two orders of magnitude and very different assumptions for what determines the final black hole mass. The deficit of observed quasars at
  can be artificial if a substantial fraction of the photons emitted at
  are trapped in the inflowing gas. This is a reasonable possibility since the accretion disc becomes thick as soon as the accretion rate approaches the Eddington limit (Section 4), but it would shift the luminosity function to the left, making it more and more difficult to explain counts at
  The tendency of black hole mass estimates to decrease with more accurate measurements is likely to reduce substantially, although not to eliminate, the need for dark accretion. This improves the agreement at intermediate magnitudes, but makes the problem at the bright end even more serious. This suggests a fundamental incompleteness of the merger scenario.
A couple of observational elements support this suspicion: (i) not all quasar hosts show disturbed isophotes, and (ii) many hosts of bright quasars have old stellar populations. The first set of observations implies that if a merger were the cause of activity, it must have happened long ago and the quasar is still active. The latter provides additional evidence for other fuelling mechanisms besides major mergers, for the quasar cannot have been active since the bulk of star formation or else its mass would be huge. Besides these observational elements, we find a better, although not completely satisfactory, fit to the data if we use a cut-off in the circular velocity rather than a cut-off of the form  for the mass of the gas that can cool.
We, therefore, advocate a scenario in which there are two stages in the life of a quasar. In the first one the quasar population builds up most of its mass through major mergers. This need not be the stage at which most of the optical emission is released because merging galaxies display enhanced star formation. This makes them dusty and primary accretion is more likely to appear as an infrared excess rather than as big blue bump. This could explain why we overpredict optical counts over a large range of magnitudes, since our modelling does not take account of dust. The final product of this first phase is an elliptical galaxy with very little cold gas because the gas that has not been consumed by stars has been almost certainly reheated by feedback from stellar evolution if not by the quasar itself.
In the second stage there is another mechanism different from major mergers that refuels quasars in gas-poor hosts through a series of short accretion events involving little mass but very high accretion rates and therefore a very high optical emission. A possibility suggested by Fabian & Crawford (1990) is that the brightest quasars may be fuelled by cooling flows (see also Kauffmann & Haehnelt 2000). Mechanisms for building the quasar population through fuelling from hot gas have been studied by Nulsen & Fabian (2000) and by Wilman, Fabian & Nulsen (in preparation) in the context of the X-ray background. Models for fuelling quasars with hot gas are interesting for mainly three reasons: (i) they are natural candidates for explaining accretion in ellipticals with plenty of hot gas but no evidence for recent mergers; (ii) the mass function of hot gas reservoirs tracks the halo mass function which declines less abruptly than the mass function of cold gas reservoirs (for which there is an upper limit at ∼ for
for 
 and
and  and (iii) getting rid of angular momentum is easier with hot gas.
Another element suggests that the bright end of the quasar luminosity function could be related to cooling flows. We have run simulations in which we have used a cut-off in the circular velocity rather than a cut-off of the form  for the mass of the gas that can cool. In these simulations we have found a better, if not satisfactory, fit to the data. This suggests that the bright tail of the quasar luminosity function may be connected with cooling in haloes with
Cooling flows may be associated with a stage of intermittent accretion through cycles of refuelling and reheating (Bailey 1982; Tabor & Binney 1993; Binney & Tabor 1995; Tucker & David 1997; Ciotti & Ostriker 1997, 1999) with the consequence of producing a higher luminosity for a shorter period of time. Feedback from quasars may work more effectively on secondary inflows either because ellipticals with old stellar populations contain a lighter column of cold gas to expel or, more likely, because cold gas may not be ejected at all. In this second possibility winds become important when there is a transition from fuelling with cold gas to fuelling with hot gas. Many details of how feedback and recurrent activity should work are not very clear. However, a point of attraction of this scenario is that it seems to provide an explanation for why there is a lot of hot gas but little cold gas in elliptical galaxies: as soon as hot gas starts cooling, some of it reaches the centre and a burst of nuclear activity reheats the whole galaxy.
Acknowledgments
AC thanks Martin Rees, John Magorrian, Pierluigi Monaco, Neil Trentham and Richard Wilman for useful conversation, and Andy Fabian, Piero Madau and Priyamvada Natarajan for comments on the manuscript. This research has been supported by an Isaac Newton and a PPARC Studentship.
References
