


Abstract
While traditionally associated with active galactic nuclei (AGN), the properties of the C ii] (λ = 2326 Å), C iii] (λ, λ = 1907, 1909 Å) and C iv (λ, λ = 1549, 1551 Å) emission lines are still uncertain as large, unbiased samples of sources are scarce. We present the first blind, statistical study of C ii], C iii] and C iv emitters at z ∼ 0.68, 1.05, 1.53, respectively, uniformly selected down to a flux limit of ∼4 × 10⁻¹⁷ erg s−1 cm−1 through a narrow-band survey covering an area of ∼1.4 deg2 over COSMOS and UDS. We detect 16 C ii], 35 C iii] and 17 C iv emitters, whose nature we investigate using optical colours as well as Hubble Space Telescope (HST), X-ray, radio and far-infrared data. We find that z ∼ 0.7 C ii] emitters are consistent with a mixture of blue (UV slope β = −2.0 ± 0.4) star-forming (SF) galaxies with discy HST structure and AGN with Seyfert-like morphologies. Bright C ii] emitters have individual X-ray detections as well as high average black hole accretion rates (BHARs) of ∼0.1 M⊙ yr−1. C iii] emitters at z ∼ 1.05 trace a general population of SF galaxies, with β = −0.8 ± 1.1, a variety of optical morphologies, including isolated and interacting galaxies and low BHAR (<0.02 M⊙ yr−1). Our C iv emitters at z ∼ 1.5 are consistent with young, blue quasars (β ∼ −1.9) with point-like optical morphologies, bright X-ray counterparts and large BHAR (0.8 M⊙ yr−1). We also find some surprising C ii], C iii] and C iv emitters with rest-frame equivalent widths (EWs) that could be as large as 50–100 Å. AGN or spatial offsets between the UV continuum stellar disc and the line-emitting regions may explain the large EW. These bright C ii], C iii] and C iv emitters are ideal candidates for spectroscopic follow-up to fully unveil their nature.
1 INTRODUCTION
Rest-frame ultraviolet (UV) emission lines are of great importance for extragalactic astrophysics as they can be used to infer gas metallicities, temperatures and the strength of the ionizing field (e.g. Shapley et al. 2003; Osterbrock & Ferland 2006). Observing these lines in the local Universe is challenging. However, for galaxies at large cosmic distances, the rest-frame UV emission lines are redshifted into the easily observable optical range. Historically, rest-frame UV spectra were mainly used to spectroscopically confirm UV-bright galaxies at z ≳ 3 selected through the Lyman break technique (Lyman break galaxies, LBGs; Steidel et al. 1996; Lowenthal et al. 1997). In the last 15 years, strong rest-frame UV lines have been discovered in a variety of galaxies at z > 1, which could be used to constrain the physics in high-redshift counterparts of local galaxies (Best, Röttgering & Longair 2000; Shapley et al. 2003; Erb et al. 2010; Rigby et al. 2015).
Intrinsically, the brightest rest-frame UV line is Ly α, which is produced in H ii regions as well as in galaxies with an active galactic nucleus (AGN; e.g. Ouchi et al. 2008; Nilsson et al. 2009; Cowie, Barger & Hu 2010; Hayes 2015; Matthee et al. 2016, 2017; Sobral et al. 2017). However, it is difficult to interpret observations of Ly α, as the line is scattered by neutral hydrogen and easily absorbed by dust (e.g. Dijkstra 2014; Hayes 2015). The amount of Ly α that escapes a galaxy therefore depends on the properties of the interstellar medium.
Other UV lines, such as C ii] (λ = 2326 Å), C iii] (λ, λ = 1907, 1909 Å) and C iv (λ, λ = 1549, 1551 Å) (Table 1) have recently been explored as they can be relatively bright compared to Ly α and can be used either individually or in combination to constrain the physics of the host galaxy. C iii] (ionization potential of 24.4 eV; Veilleux 2002), for example, was found to be the strongest UV line after Ly α in stacks of LBGs at z ∼ 3 (Shapley et al. 2003) and about 10 per cent of the observed strength of Ly α in faint, lensed galaxies at 1.5 < z < 3 (Stark et al. 2014). C iv (47.9 eV) is also a bright UV line. From photoionization modelling, the C iv-to-C iii] ratio ranges from 0.1 for low metallicity star-forming (SF; ≲ 0.3 Z⊙), up to 100 for high, supersolar metallicity (∼2–2.5 Z⊙). The typical C iv-to-C iii] ratio is ∼1 for SF galaxies of solar-type metallicity (e.g. Feltre, Charlot & Gutkin 2016; Gutkin, Charlot & Bruzual 2016).
Line emitters studied in this work, with rest-frame wavelength, ionization energy χ (Veilleux 2002), luminosity distance DL and redshift range traced by the NB392 filter, with central wavelength 3919 Å and FWHM of 52 Å. The sample is drawn from the emission line catalogue presented in Sobral et al. (2017), which focuses on selection and properties of Ly α emitters at z ∼ 2.2.
| Line | λline | χ | zline | DL | Comments |
|---|---|---|---|---|---|
| (Å) | (eV) | at FWHM | (103 Mpc) | ||
| C ii] | 2326 | 11.3 | 0.673–0.696 | 4.14 | likely traces shocks around AGN |
| C iii] | 1907, 1909 | 24.4 | 1.039–1.066 | 7.04 | produced in SF and BLR of AGN |
| C iv | 1549, 1551 | 47.9 | 1.513–1.546 | 11.47 | likely produced in BLR of AGN or in gas around very massive stars |
High-ionization rest-frame UV emission lines of carbon were originally thought to originate from close to the AGN engine as they require a strong radiation field and high temperatures. C iii] is a high-ionization, intercombination doublet (1907, 1909 Å) expected to be mostly produced in the outer parts of the broad-line region (BLR) of the AGN (Osterbrock & Ferland 2006). However, at z ∼ 2–3, C iii] emitters are also found in SF galaxies and trace a slightly sub-solar metallicity, a high ionization parameter and a hard radiation field (Bayliss et al. 2014; Rigby et al. 2015). Photoionization models presented in Jaskot & Ravindranath (2016) indicate that C iii] can be produced in starburst galaxies and is the strongest line (with λ < 2700 Å) after Ly α.
UV collisionally excited lines such as C ii] and C iv are stronger in very high temperature regions (2 × 10⁴–105 K) in the cooling region behind shocks around the AGN than in areas with lower temperature such as those that can be reached with photoionization (104 K; Allen, Dopita & Tsvetanov 1998; Osterbrock & Ferland 2006). C ii] and C iv are therefore expected to be more strongly produced in AGN hosting galaxies. Indeed, Baldwin (1977) found a correlation between the strength of the resonant C iv (1548, 1551 Å) line and the continuum luminosity, indicating that the line-emitting gas is located very close to the ionization source. While traditionally associated with BLR emission, C iv was found to be correlated with gas temperature and an intense radiation field (Osterbrock & Ferland 2006), such as the one caused by AGN or by massive stars after a recent SF episode (Stark et al. 2014; Mainali et al. 2017; Schmidt et al. 2017). In a study of radio galaxies, De Breuck et al. (2000) noted that C ii] is five times more sensitive to shock ionization than high-ionization UV lines, such as C iv. Therefore, there is compelling evidence that the semi-forbidden C ii] (11.3 eV; Veilleux 2002) line traces shocks and in combination with other lines is effective in determining the power source of ionization (Best et al. 2000, 2002).
While independently C ii], C iii] and C iv trace gas metallicity and electron density, in combination they can be used as estimators that are, to first order, independent of abundance, metallicity and dust extinction (Best et al. 2002). Therefore, C ii], C iii] and C iv line ratios are some of the best diagnostics to separate excitation by fast shocks and photoionization in a hard photon spectrum (Allen et al. 1998).
Given their relative strength to Ly α, C iii] and C iv have been proposed as a good avenue for spectroscopically confirming high-redshift galaxies (Stark et al. 2014, 2015a,b), particularly within the epoch of reionization, when Ly α scattering is expected to increase leading to a significant decrease of surface brightness. As a result, in recent years, targeted searches for C iii] and C iv emitters at high redshift have emerged. For example, Rigby et al. (2015) detect C iii] in 11 z ∼ 1.6–3 lensed galaxies, and Bayliss et al. (2014) find strong C iii] in a z ∼ 3.63 lensed starburst. Stark et al. (2015a) present tentative detections of C iii] in two galaxies at z > 6, while Ding et al. (2017) detect C iii] in one galaxy at z ∼ 5.7. By contrast, Zitrin et al. (2015) do not obtain a detection of C iii] in a sample of seven z ∼ 7–8 photometric candidates. Very recently, Du et al. (2017) presented a spectroscopic study of a sample of continuum selected C iii] emitters at z ∼ 1. With a detection rate of ∼20 per cent, their C iii] emitters have much lower equivalent width (EW, 1.3 Å) than higher redshift examples. Du et al. (2017) also found that the stronger EW sources appear in fainter, bluer and lower mass galaxies. Schmidt et al. (2017) and Mainali et al. (2017) obtain a detection of C iv in a multiply lensed z = 6.1, Ly α-emitting SF galaxy, but without a C iii] detection. Despite the growing number of detections, the samples of C iii] and C iv emitters suffer from selection biases (e.g. spectroscopically selected, lensed sources, redshift known from Ly α).
Despite the potential importance of C ii], C iii] and C iv for understanding AGN physics and the nature of stellar populations at high redshift, not much is known about these emitters in a statistical sense, as no blind studies have been performed. As such, the nature, number densities and EW distributions are largely unknown. We seek to improve our understanding of C ii], C iii] and C iv emitters by performing the first blind survey of these lines, without any pre-selection in terms of Ly α or UV properties. Our sample is uniformly selected down to a flux of ∼4 × 10⁻¹⁷ erg s−1 cm−2, in three redshift slices around z ∼ 0.7, ∼1.0, ∼1.5 for C ii], C iii] and C iv, respectively. The limiting observed EW is 16 Å and the limiting U magnitude is ∼26.5. The sources were discovered by exploring the ∼1.4 deg2 CAlibrating LYMan-α with H α NB survey (CALYMHA; Matthee et al. 2016; Sobral et al. 2017) over the COSMOS and UDS fields.
Our results are presented in two parts. In this paper (Paper I), we use the emission line data in combination with multiwavelength observations in the optical, radio, X-ray and far-infrared (FIR) to unveil the characteristics of individual C ii], C iii] and C iv emitters selected with the CALYMHA survey. We study the likely physical origin of the emission lines and how their properties compare with AGN and SF galaxies at similar redshifts. In the companion paper (Paper II; Stroe et al. 2017b), we investigate the statistical properties of the C ii], C iii] and C iv emitters through luminosity functions (LFs) and obtain the volume-average line ratios relative to e.g. Ly α and H α.
We organize the paper as follows: in Section 2, we present the CALYMHA parent sample, while in Section 3 we select the C ii], C iii] and C iv emitters. We discuss the colour and EW properties of the emitters as well as their Hubble Space Telescope (HST), radio, FIR and X-ray properties in Section 4. The interpretation of our results and the implication for the physics C ii], C iii] and C iv production can be found in Section 5, with conclusions and outlook in Section 6.
Throughout the paper, we use a flat Λ cold dark matter cosmology (H0 = 70 km s−1 Mpc−1, ΩM = 0.3, ΩΛ = 0.7), and perform calculations with the aid of the Wright (2006) cosmology calculator. All magnitudes are in the AB system, and we use a Chabrier (2003) initial mass function (IMF).
2 SURVEY DESCRIPTION
We use the CALYMHA sample of emission line galaxies to select C ii] (z ∼ 0.63), C iii] (z ∼ 1.05) and C iv (z ∼ 1.53) line emitters in the COSMOS and UDS fields. The CALYMHA survey design, observations and data reduction are presented in full in Sobral et al. (2017), and here we give a brief summary of the survey strategy and goals. The programme surveyed a combined area of ∼1.4 deg2 in the COSMOS and UDS fields using a narrow-band (NB) filter (NB392, central wavelength λC = 3918 Å and width Δλ = 52 Å) mounted on the Isaac Newton Telescope (INT).1 In combination with ancillary broad-band (BB) U data (λC = 3750 Å, Δλ = 720 Å), the NB filter was designed to select line emitters with a particular focus on Ly α emitters at z ∼ 2.23, and cross-match them with H α galaxies at the same redshift (Sobral et al. 2013). The main goal of the survey is to unveil the nature of Ly α emitter by studying the LFs and determining Ly α escape fractions as a function of galaxy properties both for H α and Ly α selected samples at z ∼ 2.2 (Matthee et al. 2016; Sobral et al. 2017).
The CALYMHA COSMOS+UDS survey selected a total of 440 line emitters down to a 3σ line flux limit of ∼4 × 10⁻¹⁷ erg s−1 cm−2, down to an observed EW limit of 16 Å. Based on spectroscopic and photometric redshifts, the emitter population contains a significant fraction of C ii], C iii] and C iv emitters (Sobral et al. 2017), thus rendering CALYMHA an ideal sample to study these emitters in a statistical, unbiased way with a clear selection function. Given the width of the NB filter and their rest-frame wavelength, the line emitters are traced over a narrow redshift range (see Table 1).
2.1 Ancillary data
In addition to the CALYMHA NB and U-band data, we use ancillary spectroscopic and photometric redshifts and photometry from the COSMOS and UDS surveys (Capak et al. 2007; Lawrence et al. 2007; Ilbert et al. 2009; Laigle et al. 2016). About 40 per cent of our sources are faint in the i and K bands or are located in masked regions and are thus not included in the publicly available COSMOS and UDS catalogues. There are 80 emitters with spectroscopic redshifts, most of which also have a photometric redshift (Fig. 1, data from Yamada et al. 2005; Simpson et al. 2006; van Breukelen et al. 2007; Geach et al. 2007; Ouchi et al. 2008; Smail et al. 2008; Lilly et al. 2009; Ono et al. 2010). However, in 10 cases, only a spectroscopic redshift is available. We also include the redshifts derived by Sobral et al. (2017) from dual, triple and quadruple detection of emission lines in NB filters. These very precise photometric redshifts have accuracies close to a spectroscopic measurement. The total tally for sources with redshifts (spectroscopic or photometric) is 269, or 61 per cent of the total number of emitters.
![Photometric versus spectroscopic redshift for our NB392 line emitters, using data from e.g. Ilbert et al. (2009), Cirasuolo et al. (2010) and Lilly et al. (2009), as well as our own X-SHOOTER Very Large Telescope follow-up. The grey shaded areas indicate the redshift ranges where the NB filter is sensitive to C ii], C iii] and C iv. The top panel shows the distribution of spectroscopic redshifts, where we also mark the main emission lines picked up by the NB filter.](https://oup.silverchair-cdn.com/oup/backfile/Content_public/Journal/mnras/471/3/10.1093_mnras_stx1712/3/m_stx1712fig1.jpeg?Expires=1750546047&Signature=htqaHT65Hax5nPJGEbFIEMmF0gHMHFS0zvvm5OrqnE7b1wL4np6n518C-7e-DeKDGR5WyI7-NuY6B8Lo916vEgd~8wYT39~Fx7MNhq9xnN0T8dYsY~aKQZpl36AZAVr0EkFv~K96rxRKaaS5LeimTYwnsKTC9klYAa-I2vKU0LsY5~1uGKo3nZD7r7yPB6p5FWQUL6PjxcryS1dZ1VVW9sSslcgKhE4MSgGQQNdsfPLdFGH5cn~XJLcHLuNWr-O6n6LCfbVTOLYai-5gX-hCDroVZm7IKLlgYMy4cf~xThFS5gdLsIyAdLelRAtcUkkpQCluS2-gNOuEbnls5HmZjA__&Key-Pair-Id=APKAIE5G5CRDK6RD3PGA)
Photometric versus spectroscopic redshift for our NB392 line emitters, using data from e.g. Ilbert et al. (2009), Cirasuolo et al. (2010) and Lilly et al. (2009), as well as our own X-SHOOTER Very Large Telescope follow-up. The grey shaded areas indicate the redshift ranges where the NB filter is sensitive to C ii], C iii] and C iv. The top panel shows the distribution of spectroscopic redshifts, where we also mark the main emission lines picked up by the NB filter.
We also explore the deep, publicly available HST data in the F814W filter (Koekemoer et al. 2007; Massey et al. 2010), Chandra space telescope X-ray observations (Elvis et al. 2009), FIR Herschel data (Oliver et al. 2012) and radio Very Large Array (VLA) images at 1.4 GHz (Schinnerer et al. 2004, 2010) in the COSMOS field to further investigate the nature of the line emitters. We employ direct detections as well as stacking techniques for this purpose. We note that the Chandra deep data are only available in a sub-area of the COSMOS field; hence, only a fraction of the sources will have counterparts and/or coverage. The UDS field is partly covered with HST data as part of the CANDELS survey (Koekemoer et al. 2011).
3 SELECTING C ii], C iii] AND C iv EMITTERS
In order to select C ii], C iii] and C iv emitters at the redshifts traced by the NB392 filter, we use a combination of spectroscopic and photometric redshifts.
3.1 Redshifts
For the COSMOS field, Ilbert et al. (2009) derived photometric redshifts using a range of templates, including star, galaxy and quasar templates for an i band selected sample. Blindly using the galaxy templates results in large discrepancies between the chosen photometric redshift and the true redshift, when spectroscopy is available. Keeping in mind that a fraction of C ii], C iii] and C iv emitters is possibly tracing AGN activity, we expect in many cases the quasar templates to perform better. Ilbert et al. (2009) also provide the χ2 for the best-fitting stellar, galaxy and quasar template. We found that simply choosing the template that provided the lowest χ2 fit worked well: for the sources with both zphot and zspec, the two estimates matched (see Fig. 1). When choosing the best zphot estimate based on χ2, 88 per cent of the photometric redshifts are within 0.1 of the spectroscopic ones. In the cases where neither template was a good fit (high χ2 > 100), all photometric redshift estimates were catastrophically off.
We also tested the new COSMOS zphot catalogue presented in Laigle et al. (2016) using the same method of selecting the best template (minimizing the χ2), but found that the Ilbert et al. (2009) photometric redshifts correlate better with the spectroscopic redshifts in our sample. Laigle et al. (2016) is selected in the near-infrared and Ilbert et al. (2009) in the optical. Since our sources are optically selected (in the very blue), it is unsurprising that Ilbert et al. (2009) zphot work better, given their weighting towards optical bands. In the case of UDS, a single photometric redshift estimate is available (Cirasuolo et al. 2010).
Overall, for the entire sample, 84 per cent of photometric redshifts are within 0.1 of the spectroscopic redshift (Fig. 1). The sample is however not spectroscopically complete, especially for fainter sources, so the photometric redshift accuracy derived here is not necessarily applicable for all the sources without a spectroscopic redshift (Fig. 2).
![Histogram of all photometric redshifts, focusing on C ii], C iii] and C iv. Note the narrow ranges chosen for selection of sources based on photometric redshifts, ensuring that low-redshift (z < 0.4) emitters such as [O ii], [Ne v], Mg i and Mg ii are rejected.](https://oup.silverchair-cdn.com/oup/backfile/Content_public/Journal/mnras/471/3/10.1093_mnras_stx1712/3/m_stx1712fig2.jpeg?Expires=1750546047&Signature=jAbe0Q4udyUasYhjm7S1h6MxP7C9nfyyx~MpG7XsV2vKLvrVrpLU4wvygKM-Z3fLRHs7CD3gPVl6KTGHdQb~Fpvp6p-Ihg7f7xJazHjSwx4j1H3ErpLZksoBollMnmYdtTFbgC9UqwEuUfpTbwYbljvzRofibxbsjixdKImzKPEgYI4jroVo1T3Z~qqvzp40iMknRyXlDM8cNwGBABvhxjqsS2Fvl2yV4wpm1djoV8GUiPaaq4juYvJu-bc2kEuMGw4Im2tICsE5BLjJObTfeAEhsSGjrWWMzgiLyIMkIFCEgzhTJjC-MNL~DzdDwNcexMrn~8LpgJMHozi2HyJrdA__&Key-Pair-Id=APKAIE5G5CRDK6RD3PGA)
Histogram of all photometric redshifts, focusing on C ii], C iii] and C iv. Note the narrow ranges chosen for selection of sources based on photometric redshifts, ensuring that low-redshift (z < 0.4) emitters such as [O ii], [Ne v], Mg i and Mg ii are rejected.
3.2 Final selection criteria
For a source to make the C ii], C iii] or C iv emitter selection, we first remove all sources selected as Ly α by Sobral et al. (2017). It then has to fulfil at least one of the criteria listed below. We summarize the criteria in Table 2 and describe them below.
A spectroscopic redshift within the range probed by the respective filter, within two full width at half-maximum (FWHM). We choose this wider range since the filter transmission drops slowly towards its wavelength edges, effectively being sensitive to emitters at twice the FWHM. This also accounts for broad lines.
If spectroscopy is not available, we select a source if it has a photometric redshift within ∼0.2 of the redshift range the NB filter is sensitive to. Note that our very conservative cuts are chosen to maximize the purity of the sample.
Criteria for selecting a source as a C ii], C iii] or C iv emitter. The zspec ranges used correspond to the full transmission range covered by the NB filter. Note that we are using conservative zphot cuts to minimize contamination. Sources selected as Ly α by Sobral et al. (2017) using colour–colour selections were removed from the sample. The number of sources of each type, selected based on zspec and additional zphot, are also listed.
| Line | zspec selection range | zspec sources | zphot selection range | zphot sources | All |
|---|---|---|---|---|---|
| (sources without zspec) | |||||
| C ii] | 0.661–0.707 | 3 | 0.63–0.75 | 13 | 16 |
| C iii] | 1.025–1.080 | 4 | 0.8–1.2 | 30 | 34 |
| C iv | 1.486–1.563 | 14 | 1.4–1.7 | 3 | 17 |
The redshift distribution of sources selected as C ii], C iii] and C iv is shown Fig. 2. The narrow photometric redshift ranges chosen for selection ensure that we do not include bright, low-redshift emitters such as [O ii] at z ∼ 0.05, [Ne v] at z ∼ 0.15 and Mg i and Mg ii at z ∼ 0.4 in our sample. Our photometric redshift selection is conservative as there could be sources with zphot in the 1.2–1.4 range that could be either C iii] or C iv (Fig. 2).
Sobral et al. (2017) used BzK colour selections to further improve the completeness of their Ly α sample and thus include some sources with lower photometric redshifts. If we did not remove the Ly α selected sources, we would select an extra 9 C iii] and 16 C iv sources. We remove sources selected as Ly α by Sobral et al. (2017) to ensure a high purity and obtain conservative, but secure samples. Note, however, the highly unusual colours of C iv emitters (see Section 4.1), which means that some real C iv emitters might have been selected as Ly α and thus were removed from our sample. Spectroscopic follow-up is required to further investigate this. See also discussion in Sobral et al. (2017) on the removal of the vast majority of C iii] and C iv contaminants in CALYMHA, which is usually not done in other Ly α surveys.
4 PROPERTIES OF THE C ii], C iii] AND C iv SAMPLES
Table 2 lists the final samples of C ii], C iii] and C iv emitters, which include spectroscopically confirmed sources and sources selected through their zphot. We have three spectroscopically confirmed C ii] emitters in addition to 13 zphot. In the case of C iii] emitters, we have four spectroscopically selected sources and 30 with zphot. We obtain 14 C iv sources with zspec and 3 with zphot. Note the particularly high spectroscopic completeness of the C iv sample, a likely result of the follow-up of Chandra COSMOS sources.
In this section, we study the colour–colour properties as well as the colour and EW distributions with the aim of investigating the nature of the C ii], C iii] and C iv emitters, as well as test the robustness of our sample. We also investigate the properties of the emitters using X-ray, radio and space telescope optical data. Tables 3 and 4 summarize the EW, UV, optical, X-ray and radio properties of the sample, while Tables B1–B3 describe individual C ii], C iii] and C iv emitters. We list their sky coordinates, line luminosity, rest-frame EWrest, observed (U − B)obs colours and describe their optical HST morphologies, and their X-ray and/or radio counterparts. Note that while most of the COSMOS part of the CALYMHA survey is covered by HST and VLA radio data, the deep Chandra data are only available for a sub-area. In the case of UDS, only HST data are available and for a small sub-area of the field.
Rest-frame EWrest, observed (U − B)obs and UV slope β of the emitters that have photometric or spectroscopic redshifts. We also list the observed filters used for tracing the rest-frame UV. Note that the rest-frame wavelength traced for calculating the β slopes varies slightly depending on the emitter type. See Section 4.3 for more details. The uncertainties reported represent the standard deviation of the sample.
| Line | zspec | Mean EWrest | Median EWrest | Mean (U − B)obs | Median (U − B)obs | Mean β | Median β | Filters for |
|---|---|---|---|---|---|---|---|---|
| (Å) | (Å) | (mag) | (mag) | β slope | ||||
| C ii] | 0.68 | 82 ± 56 | 74 ± 70 | 0.25 ± 0.20 | 0.26 ± 0.25 | −2.0 ± 0.4 | −1.9 ± 0.5 | NUV, U |
| C iii] | 1.05 | 93 ± 59 | 87 ± 74 | 0.25 ± 0.37 | 0.21 ± 0.46 | −0.8 ± 1.1 | −0.6 ± 1.4 | U, B |
| C iv | 1.53 | 51 ± 46 | 34 ± 58 | 0.15 ± 0.37 | 0.21 ± 0.46 | −1.9 ± 0.8 | −1.6 ± 1.0 | U, V |
| Ly α | 2.23 | 85 ± 57 | 77 ± 71 | 0.18 ± 0.25 | 0.23 ± 0.31 | −1.6 ± 0.6 | −1.7 ± 0.7 | g, R |
| H α | 2.23 | −1.0 ± 0.6 | −1.0 ± 0.7 | g, R |
| Line | HST | Chandra | Radio 1.4 GHz | ||||||
|---|---|---|---|---|---|---|---|---|---|
| coverage | morphology | coverage | counterpart | coverage | counterpart | ||||
| C ii] | 12/16 | Four bright-core+disc, seven discy, | 5/16 | 2/5 | 13/16 | 0/13 | |||
| one interacting | |||||||||
| C iii] | 19/34 | Two bright-core+disc, eight disturbed/interacting, | 9/34 | 1/9 | 22/34 | 1/22 | |||
| seven diffuse/spiral, two compact | |||||||||
| C iv | 10/17 | 10 point sources | 4/17 | 4/4 | 12/17 | 3/14 | |||
4.1 Colour–colour properties
In SF galaxies, the R − z versus the J − Ks colour space probes the 4000 Å break, which moves from between the R and z filters for sources at z ∼ 0.7–1.2, to between J and Ks for sources at z > 2.1. In Fig. 3, this is illustrated by the population of SF H α emitters from Sobral et al. (2013) that move from the lower-right side at z ∼ 0.8 (large R − z, small J − Ks) of the plot towards the upper-right side (small R − z, larger J − Ks) at z ∼ 2.2. For comparison, we also overplot the CALYMHA Ly α emitters at z ∼ 2.2.
![R − z versus J − Ks colour–colour plot for the emitters. Ly α emitters at z ∼ 2.23 from the CALYMHA survey (Sobral et al. 2017) and H α emitters from the HiZELS project (Sobral et al. 2013) are also plotted. C ii] and C iii] emitters are located in the z ∼ 0.8–1.5 SF galaxy regime. However, the C iv emitters have unusual colours, following the distribution of SF at z ∼ 2.23, rather than 1.5.](https://oup.silverchair-cdn.com/oup/backfile/Content_public/Journal/mnras/471/3/10.1093_mnras_stx1712/3/m_stx1712fig3.jpeg?Expires=1750546047&Signature=aG-1hQWRgUsHkJadmgaazaD4ar47B~iXHhWB~-KEddjSEwpK1Kkiot9fXyVaTA96bqEyTjvxBoqn4Js9hG2VR-Lj5oqp-XzK3jVeyRFU46cpup-Q8abt08HcaqxuTkxfu50WyfzNAeDxIL9IJcsM07SaI-LABLol4GeOv5dvc8YaPtY6tUCUAd5mXC6BBNuSfRTfpivSJEKJwdUI7GAJsI6oOnEd~8ruvNSk9BYF7CQmLY4tuq0MW2ipHONiCJveDdTrmADBqmJvISq2YBS9-r3gJjbrXvueiipfqf8LLJrAXhqi1ba43ILkCK4X84TBe2ohV1JTkl7aWE-ChMPPJQ__&Key-Pair-Id=APKAIE5G5CRDK6RD3PGA)
R − z versus J − Ks colour–colour plot for the emitters. Ly α emitters at z ∼ 2.23 from the CALYMHA survey (Sobral et al. 2017) and H α emitters from the HiZELS project (Sobral et al. 2013) are also plotted. C ii] and C iii] emitters are located in the z ∼ 0.8–1.5 SF galaxy regime. However, the C iv emitters have unusual colours, following the distribution of SF at z ∼ 2.23, rather than 1.5.
Some C ii] emitters at z ∼ 0.7 are located in the colour space of SF galaxies at z ∼ 1.5, so they have atypical colours for their redshift, indicating that while some may trace SF galaxies, some, as expected, probably result from ionization in AGN through shocks.
C iii] sources mostly lie in the region of z ∼ 0.8–1.0 SF galaxies, possibly indicating an SF, rather than AGN nature of these emitters. Note that the most extreme C iii] emitter, with a very low R − z colour, is an AGN (see Section 4.6) and the most luminous in the emission line (∼1042.4 erg s−1).
Given the large ionization energy necessary to produce C iv, it is expected that C iv requires either an AGN or very hot stars. It is therefore perhaps not surprising that most C iv emitters at z ∼ 1.5 do not have colours consistent with SF galaxies at that redshift, but lie in the region of z ∼ 2.2 Ly α emitters. Note that all C iv sources with all the two colours required for Fig. 3 are spectroscopically confirmed, so the unusual colours cannot be attributed to a wrong selection. It is therefore crucial to consider the contamination by C iv emitters to samples of NB selected Ly α emitters: without redshifts, when using colours, many lower redshift C iv sources will be confused with higher redshift Ly α emitters, as noted by Sobral et al. (2017). C iv have unusual spectral shapes in other bands as well. For example, the criteria Konno et al. (2016) used for selecting Ly α emitters at z ∼ 2.2 [(U − NB) > 0.5 and (B − NB) > 0.2] would select seven spectroscopically confirmed C iv emitters as Ly α emitters. Note that this corresponds to half the sample of confirmed C iv emitters. Even when using the criteria defined by Konno et al. (2016) to select ‘secure’ Ly α emitters [(U − NB) > 0.9 and (B − NB) > 0.2], we would still select five spectroscopically confirmed C iv into a Ly α sample. These C iv emitters are typically luminous, so they result in contamination of the bright end of the Ly α distribution (Matthee et al. 2017; Sobral et al. 2017). Because this contamination is mostly at bright fluxes, it is less important in deep but small-area NB surveys (e.g. Trainor et al. 2015).
4.2 Observed and rest-frame U − B colours
C ii]: rest-frame 1380 and 2275 Å;
C iii]: rest-frame 1865 and 2175 Å;
C iv: rest-frame 1510 and 2165 Å.
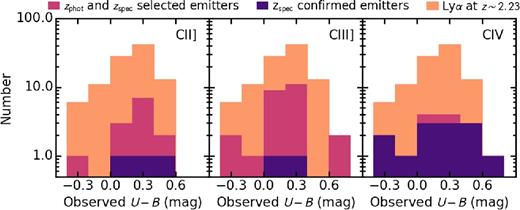
Distribution of observed (U − B)obs colours of the emitters. The distribution of the Ly α emitters at z ∼ 2.23 (Sobral et al. 2017) is given for reference. The (U − B)obs average for the C emitters at 0.7 ≲ z ≲ 1.5 is indicated in blue colours, consistent with Ly α emitters at z ∼ 2.23.
All three types of emitters studied in this paper have relatively blue colours with mean (U − B)obs colours in the 0.15–0.25 range. Our emitters are consistent in colour with Ly α emitters selected at z ∼ 2.23 in the CALYMHA survey, which stand at a mean of 0.18. For the C iii] and C ii] source with discy morphology as discussed in the previous section, the blue UV colours indicate a relatively dust-free environment.
For comparison, we also present a rest-frame (U − B)rest colour, derived from the observed i − z colour (Fig. 5). Our C iii] emitters are on average slightly bluer ((U − B)rest = 0.38) than the spectroscopic sample of C iii] emitters at z ∼ 1 from Du et al. (2017), which characterize their emitters as being blue and low mass with little dust extinction. Note however that the two distributions are perfectly compatible within the full distribution of values.
![Distribution of rest-frame (U − B)rest colours (observed i − z colours) of the C iii] emitters. The rest-frame (U − B)obs from Du et al. (2017) averages are only slightly larger, but consistent with our results. This shows that our C iii] emitters are a relatively blue population of sources, but that our blind selection may also be recovering a few sources that are even bluer than the average.](https://oup.silverchair-cdn.com/oup/backfile/Content_public/Journal/mnras/471/3/10.1093_mnras_stx1712/3/m_stx1712fig5.jpeg?Expires=1750546047&Signature=Xz2IengQkq7k1YOdnz4uTehdNG06TL05oiqHVWjvUk6R822HxxtyGnCWVbIuvOa0dzoKYOQp6yNB79Hs6hcV2VXFrtJMZOCBMdwdKUh6T8YHgvIuQWgZ9DSxnBvLukelF1k9Ct5BUvYtM~nWLCwJJPmQDUJKeMCjWuCHZelFTW1Zd7F6-MTv0i-s4yEG3KlZVB98rfuU5aCFG2k7V6eC6SEOCFdl-8liyiGvnziYxG7e8GG06cQ9Wtv6WtQ~H-EIT-0l5qROp6OOrl2PvQDszWTu5AhER3Yu~DBurDCMS4~XWEyd~bmhpXg5VMWQSLE1Ixhap1hFeOZ8DNw-nHQ0VA__&Key-Pair-Id=APKAIE5G5CRDK6RD3PGA)
Distribution of rest-frame (U − B)rest colours (observed i − z colours) of the C iii] emitters. The rest-frame (U − B)obs from Du et al. (2017) averages are only slightly larger, but consistent with our results. This shows that our C iii] emitters are a relatively blue population of sources, but that our blind selection may also be recovering a few sources that are even bluer than the average.
4.3 UV slope β
Given that our emitters are at three different redshifts, it is not simple to have filters that trace exactly the same rest-frame wavelengths. The best choices of filters to trace the rest-frame UV included the U filter, which can be contaminated by the emission lines. We chose filters to match the convention used in other studies and ease comparisons:
C ii]: NUV, U;
C iii]: U, B;
C iv: U, V.
Note that for C iii] emitters, the U filter traces a slightly redder rest-frame wavelength compared to other studies and C ii] and C iv, which may bias β to slightly redder values.
We list the averages of the β slope in Table 3. The β slopes of our emitters indicate a steep UV continuum with potential low dust attenuation, within the same ranges as Ly α emitters at z ∼ 2.23, but with C iii] being slightly redder.
We show the average β slope compared to the average absolute UV magnitude MUV in Fig. 6. The relation between the UV slope and absolute UV magnitude has been shown to not depend significantly on redshift for LBGs, thus making it a good probe for studying galaxies at all cosmic epochs (Bouwens et al. 2009; Smit et al. 2012).
![Distribution of rest-frame UV slope β as a function of UV magnitude for our sample of emitters and Ly α (Sobral et al. 2017) and H α at z ∼ 2.23 (Sobral et al. 2013). Only sources with both rest-frame UV bands detected are plotted. Values for individual C ii], C iii] and C iv emitters are plotted as the smaller symbols, while averages are shown as the larger symbols with error bars. For comparison, we plot the values for z ∼ 2.5 and z ∼ 4 Lyman break, UV selected galaxies from Bouwens et al. (2009). C ii] and C iv emitters have colours consistent with the population of UV selected galaxies. C iii] emitters are redder, consistent with more general populations of SF galaxies such as those selected through H α.](https://oup.silverchair-cdn.com/oup/backfile/Content_public/Journal/mnras/471/3/10.1093_mnras_stx1712/3/m_stx1712fig6.jpeg?Expires=1750546047&Signature=zWqEriucGxDxPxQfoxHzR8pa7JStHVVmlfO1DccX8-r0~6ZuFrz42S0bVfWNtZn-sN0OK5vELvGwQy5Bve-wpMmSFrumHm0AWw-IadP6LEDruvbkhw34pJ2IyTXD00eN2823hJ58qapDIE2k7TiZqsGVHJEzrBy96EFL2cupJdmZdewxgs0rYeI4AGczn45oNj6Stphw9dd4WgZArYas2DDxmzdznHAtH-Xz2pioLn50l0yZShBsaF3~0cOUSSByzJMtqX3Mmb7i47AGlJmtAqRFTb5EbGvBrOPO6sq95yaE8fqWWhBW~UYAWsF4Y6eDOfWnONwDJa~qx61tBDQs0Q__&Key-Pair-Id=APKAIE5G5CRDK6RD3PGA)
Distribution of rest-frame UV slope β as a function of UV magnitude for our sample of emitters and Ly α (Sobral et al. 2017) and H α at z ∼ 2.23 (Sobral et al. 2013). Only sources with both rest-frame UV bands detected are plotted. Values for individual C ii], C iii] and C iv emitters are plotted as the smaller symbols, while averages are shown as the larger symbols with error bars. For comparison, we plot the values for z ∼ 2.5 and z ∼ 4 Lyman break, UV selected galaxies from Bouwens et al. (2009). C ii] and C iv emitters have colours consistent with the population of UV selected galaxies. C iii] emitters are redder, consistent with more general populations of SF galaxies such as those selected through H α.
Fig. 6 shows that the C ii] and C iv emitters are consistent in UV properties with other Lyman break selected SF galaxies at higher redshift (z ∼ 2.5–4; Bouwens et al. 2009) and with Ly α selected galaxies at z ∼ 2.2. It is important to note that Ly α and LBG selected samples are generally biased towards blue, less massive, metal-poor SF galaxies (Oteo et al. 2015). Note that Ly α can also probe extremely dusty galaxies unlike the LBG technique (Oteo et al. 2015; Matthee et al. 2016). The average β slope is consistent with the results obtained from the observed and intrinsic colours, indicating that C ii] and C iv emitters are relatively blue objects with little dust extinction. At first glance, this is quite surprising, because, as was discussed in previous sections, a large fraction of C ii] emitters and the bulk of C iv emitters have properties consistent with AGN. However, young, dust-free, quasar-like AGN will have steep UV continua, similar to those measured for C iv and C ii] emitters.
C iii] emitters have relatively flat slopes, indicating a redder UV continuum. This means C iii] emitters have β slopes consistent with more general populations of SF galaxies such as those selected from H α (Oteo et al. 2015). The C iii] emission line may therefore be a good, unbiased tracer of SF galaxies with a range of properties.
4.4 EWrest distribution
We also investigate the distribution of rest-frame EWrest in the sample of emitters. We find that the average EWs are high. This could be caused by Ly α interlopers, which can have large observed EWs.
The distributions of the resulting samples with very high purity are given in Fig. 7. Averages are listed in Table 3, while individual values are given in Tables B1, B2 and B3.
![Rest-frame EW distribution for highly secure C ii], C iii], C iv, classified as such by spectroscopic or photometric redshifts. We removed any potential high-redshift sources that were classified as C species based on zphot, but as z > 2 sources by colour–colour selections from Sobral et al. (2017) or by Lyman break colour cuts. Note the large average EW for all three emitter types. For comparison, we also show the EW distribution of the Ly α emitters at z ∼ 2.23 selected in Sobral et al. (2017, scaled by 0.2).](https://oup.silverchair-cdn.com/oup/backfile/Content_public/Journal/mnras/471/3/10.1093_mnras_stx1712/3/m_stx1712fig7.jpeg?Expires=1750546047&Signature=Pu-qWr6b2oVAUOy00tRHGSiPggdEp0iaWzDgMxY4nkRATt32q~hffZUduNGuXmOGUBoQZ0MeZBy62eOVwnwBTYoUPvOGf6XNxxtXguPtbM18CEaZsvpyKYSQuyOrYBqFozLlepNtE~2ZKLkg2JCswLCdr99Be23UBlxjv9fiaUXmBao7Mi~pBNjDxuXxRzDL95Y-Tcl6BAI58VO0uAREOviltyGEk5Hhd2YBHADPzzE4bIj5lxF0awlJtIOfurs2n6Ww2R-ermzf2KYPjtB2Uc7PCni7q7Z8v178kS1qXCACeW5~lhrcJMHdeljTK8cuZfc~3lxxPLiLOfsV4p~NQw__&Key-Pair-Id=APKAIE5G5CRDK6RD3PGA)
Rest-frame EW distribution for highly secure C ii], C iii], C iv, classified as such by spectroscopic or photometric redshifts. We removed any potential high-redshift sources that were classified as C species based on zphot, but as z > 2 sources by colour–colour selections from Sobral et al. (2017) or by Lyman break colour cuts. Note the large average EW for all three emitter types. For comparison, we also show the EW distribution of the Ly α emitters at z ∼ 2.23 selected in Sobral et al. (2017, scaled by 0.2).
We find a significant population with large rest-frame EWs for all three emitter species, potentially extending up to 200 Å. The distributions of the three populations drop in numbers towards high EWs. The small bump in the distribution of C iii] emitters in the largest EW bin is not statistically significant. On average, C iv emitters have lower EWs compared to C ii] and C iii], which correlates with the brighter average magnitudes of these C iv sources (see, for example, Fig. 6). This is caused by the prevalence of quasars among C iv sources. Overall, there are relatively few sources with very low EWs close to our selection limit of 16 Å. Because of the way the selection of emitters is performed (see for details Sobral et al. 2017), sources will be classified as emitters if they pass the EW limit cut of 16 Å and a signal-to-noise (S/N) cut. For low-S/N sources, the EW needs to be higher for a source to pass the selection compared to a source that is bright in the BB. This explains the proportionally larger number of C iv emitters with low EW compared to C ii] and C iii] sources. We would like to note that while EWs can be biased high because of a number of geometrical reasons (see discussion below, e.g. offset of line-emitting regions with respect to underlying UV radiation), the line fluxes given our apertures will be reliable, as all the emission should be captured, more so when compared to, for example, slit observations.
Another explanation for the larger EWs would be that EWs measured from the NB are not accurate with respect to EWs from spectroscopy. However, we do not believe this could be the case as NB EWs have been found to be reliable when compared to spectroscopic observations (e.g. for lines such as H α, Ly α; Sobral et al. 2015a,b, 2016), specifically for CALYMHA survey follow-up of Ly α emitters (Sobral et al., in preparation). Some C ii] and C iv sources, including those with large EWs, are confirmed spectroscopically; however, none of the large EW C iii] emitters has a zspec. The available spectroscopy is biased towards continuum-bright sources, which do not have large EW. Despite potentially strong emission lines with large EW, many continuum-faint C ii], C iii] and C iv emitters in our sample, with NB magnitudes below 22–23, were never spectroscopically followed up precisely because they were not bright enough. While we removed sources of systematic errors and potential interlopers to the best of our abilities, without targeted spectroscopy it is not possible to fully confirm the large EW measurements.
A word of warning is that the errors on the rest-frame EW can be large, with an average of ∼60 per cent of the EW value. Hence, some of the values can be 60 per cent lower or higher than estimated here. Furthermore, as we will discuss in Section 4.5, our morphological results show that we may be tracing specific regions within galaxies with little to no UV continuum, which may bias the EW towards higher values.
Spectroscopic observations are necessary to pose tighter constraints on the EW values, reduce the error bars and further investigate the validity of NB observations for measuring the EW of C ii], C iii] and C iv emitters. EW could also be overestimated due to variable sources, which we discuss in detail in Appendix A. While variability could explain part of the population, the entire population of large EW sources cannot be explained this way.
Another possibility to explain the large EW is offsets between the main line emission region and the galaxy stellar light (see Figs 8–11). Such offsets could be caused by systematic astrometric errors, but can also be caused by a real physical separation in the peaks of the underlying continuum and the line emission. While investigating this avenue with the INT NB data alone is not possible because of the large point spread function (PSF, ∼2 arcsec), we discuss this in more detail using high-resolution HST data in Section 4.5. As will be shown in Section 4.5, astrometric errors are likely not the cause of the large EW.
![HST cutouts of z ∼ 0.7 C ii] emitters selected based on zspec or zphot. Images are on the same colour scale, from 0 to 20 × σrms, with a size of 4 arcsec × 4 arcsec. At the redshift of C ii] emitters, the images have a size of 28.3 kpc on each side. The large circle represents the 3 arcsec aperture used to extract photometry for the CALYMHA sources. The small circle represents three times the HST point spread function (PSF ∼1 arcsec), encompassing 98 per cent of the flux. We also indicate whether the source has an X-ray or radio counterpart. Note that some sources simply do not have X-ray or radio counterparts, while others are not covered with such data. While some C ii] emitters have discy morphologies, some have very bright nuclei, which in the case of source 275 correlates with an X-ray detection, indicating that these galaxies are Seyfert-like. We centre the HST thumbnails on the peak position of the emission line and find that, in some cases, there are offsets of ∼5 kpc from the peak UV rest-frame emission. This may explain the relatively large EW we measure.](https://oup.silverchair-cdn.com/oup/backfile/Content_public/Journal/mnras/471/3/10.1093_mnras_stx1712/3/m_stx1712fig8.jpeg?Expires=1750546047&Signature=3xcHzoPHZjFtQpqgDBZ6OC4QgyETsHoigd~AVvqJcTqZBIars83etD~9Y0yzl0DDA2OKEHkVkptqAAxqBAkqvI9cL3tmW-~RGMCRqmIJ3Fdupvsdno4n6J5xOPAU-xXq-ZRaBIAWyZxlcsCAwrRla0ZofcTnw~RqTcsgG89pcv6C-zBKFDibRGfLnYBWlgTr8GOBkj~xve7g44tRzaWTM0zO3Yq7~0xHbWZpX852A4hZWz~~ap3556WyYsOGKeuTjYIgFJBJYk4r7c5kTWlw5QqrCk3FzS9mHve3oOXs9CTL9KMcnGRMe41buDQNAHC~mEZ3~c3jcSEXNf-9K-CAyQ__&Key-Pair-Id=APKAIE5G5CRDK6RD3PGA)
HST cutouts of z ∼ 0.7 C ii] emitters selected based on zspec or zphot. Images are on the same colour scale, from 0 to 20 × σrms, with a size of 4 arcsec × 4 arcsec. At the redshift of C ii] emitters, the images have a size of 28.3 kpc on each side. The large circle represents the 3 arcsec aperture used to extract photometry for the CALYMHA sources. The small circle represents three times the HST point spread function (PSF ∼1 arcsec), encompassing 98 per cent of the flux. We also indicate whether the source has an X-ray or radio counterpart. Note that some sources simply do not have X-ray or radio counterparts, while others are not covered with such data. While some C ii] emitters have discy morphologies, some have very bright nuclei, which in the case of source 275 correlates with an X-ray detection, indicating that these galaxies are Seyfert-like. We centre the HST thumbnails on the peak position of the emission line and find that, in some cases, there are offsets of ∼5 kpc from the peak UV rest-frame emission. This may explain the relatively large EW we measure.
![Same as Fig. 8, but for C iii] emitters. The images are 32.4 kpc in size at the redshift z ∼ 1.05 of the C iii] emitters. The large circle is the 3 arcsec aperture used to extract photometry, while the small circle is 3 ×PSF of HST, which captures 98 per cent of the flux for a point source. C iii] emitters have a range of optical morphologies, including discs, many interacting or merging sources and messy, complicated, disturbed galaxies. Source 212 has a Seyfert-like morphology with a bright optical core and a radio and X-ray counterpart. Note that in many cases the rest-frame continuum is offset from the CALYMHA emission line detection, which may explain the large EW we find. This is likely caused by physical offsets between the stellar continuum and the brightest emission line regions. A small fraction of sources with coverage have either X-ray or radio detections, indicative of an AGN.](https://oup.silverchair-cdn.com/oup/backfile/Content_public/Journal/mnras/471/3/10.1093_mnras_stx1712/3/m_stx1712fig9.jpeg?Expires=1750546047&Signature=sSIYcMLIIg16ozQexHxp8-7JthB4rLYGhQyhPHn8vqrW9i3BzA55cDY0f9sjwHDZ9sTjqOiJg7~FLRZZqO~HUtiIhjlJQVFOC48vNY7-zJDkwXyCJdRRUYt8LoQS4tClP1XSnawuUjyd7KFZN8caU1SWerRK79yvgLGamTLTrqnh0as-tPrWIy6TwSZg45zuHwrk4p2QwZpEFc~NL13c77leGRQplAaOjMfgwPV371KvNLLKlWsVAbHk9EWgyCSBOYC96KyzZxwvJs3sbYLQ0L8L9goDicbDYlPzzo4pB-TifnMSMzTitdNFICQyhB-WGD-CvqfdvyIh81HxEavcxg__&Key-Pair-Id=APKAIE5G5CRDK6RD3PGA)
Same as Fig. 8, but for C iii] emitters. The images are 32.4 kpc in size at the redshift z ∼ 1.05 of the C iii] emitters. The large circle is the 3 arcsec aperture used to extract photometry, while the small circle is 3 ×PSF of HST, which captures 98 per cent of the flux for a point source. C iii] emitters have a range of optical morphologies, including discs, many interacting or merging sources and messy, complicated, disturbed galaxies. Source 212 has a Seyfert-like morphology with a bright optical core and a radio and X-ray counterpart. Note that in many cases the rest-frame continuum is offset from the CALYMHA emission line detection, which may explain the large EW we find. This is likely caused by physical offsets between the stellar continuum and the brightest emission line regions. A small fraction of sources with coverage have either X-ray or radio detections, indicative of an AGN.
![Same as Fig. 8, but for C iv emitters. The cutouts trace 33.9 kpc on each side, at the redshift of C iv (z ∼ 1.53). The large circle represents the 3 arcsec CALYMHA aperture and the small circle is three times the HST PSF. All the sources are consistent with being point sources, with their flux contained within the PSF of HST. Six out of 10 sources with HST coverage have either radio or X-ray counterpart, further supporting a scenario where C iv sources are powered almost exclusively by AGN. Note that all sources with X-ray coverage do have a counterpart. Unlike, C ii] or C iii] emitters, the C iv line detections are well centred with respect to the HST and thus more consistent with astrometric errors rather than physical offsets. An AGN powering source for C iv can readily explain the large EW.](https://oup.silverchair-cdn.com/oup/backfile/Content_public/Journal/mnras/471/3/10.1093_mnras_stx1712/3/m_stx1712fig10.jpeg?Expires=1750546047&Signature=tI0EjoUV2VZTqZ8xMA5pfFTAc0ak5EwNsCTflTkzdzzwot5iFGqkouuM6wUHDvz6kP9GEW8L6PvHtBnCPdDt3-MQEigNDdQWb2irI2Vo-OJisKr7bhnYTSURyf1mXx~3lNLcp6k4QZBsRy5hmb0O4j52Bn6saxlk6Tzfy8T3sPgd5kkbnYwpfVwX9NlMy23Ao1xiEedQz8HhoaedtZp76UZGaYm-ACFFs3JAIQIVev8I7MEF3DvL0hLGqBXHKJGVJhNMl8iqvNkbEaaJjbVuWJao3ij2O-WG9DqoE08Q3r7EHYPJErX0rElDgjjKCAryMBGJCd6qRfSS85NTLRmhLg__&Key-Pair-Id=APKAIE5G5CRDK6RD3PGA)
Same as Fig. 8, but for C iv emitters. The cutouts trace 33.9 kpc on each side, at the redshift of C iv (z ∼ 1.53). The large circle represents the 3 arcsec CALYMHA aperture and the small circle is three times the HST PSF. All the sources are consistent with being point sources, with their flux contained within the PSF of HST. Six out of 10 sources with HST coverage have either radio or X-ray counterpart, further supporting a scenario where C iv sources are powered almost exclusively by AGN. Note that all sources with X-ray coverage do have a counterpart. Unlike, C ii] or C iii] emitters, the C iv line detections are well centred with respect to the HST and thus more consistent with astrometric errors rather than physical offsets. An AGN powering source for C iv can readily explain the large EW.
![Rest-frame EW distribution with respect to offset between the emission line region and the underlying UV continuum. On average, the EW increases with spatial offset, indicating that part of the reason for the high EW is that strong emission line regions are offset from the stellar disc. The EW distribution for C ii] and C iii] emitters peaks at larger spatial offsets, while for C iv which we find are mainly AGN, the offsets are not as large.](https://oup.silverchair-cdn.com/oup/backfile/Content_public/Journal/mnras/471/3/10.1093_mnras_stx1712/3/m_stx1712fig11.jpeg?Expires=1750546047&Signature=IluYtOlpr0vGWY~iB6~oZsgHkeIqJxdzVf9GCHMLua4GDUA3ZUHu7e8eDs5RUuutNWUPua3~-SFb5lTrujAqVYFXRQ0Tdj0cFbu1sZzoU9ovFbFae0NScmIpZ6eDLlkQgE32b1k1B6mNdJsy-tT37ULP3bpFttDvDfS8P3IzcXs9e3B72hlKeGIl~0JuwlT4seihyjtIEtzcwLxUiKiDhS7JCtFMi~BCA1gKJZMcQm5~OsLV05HG7GQPjCLdRDd181Zi8~p5x5vLu6b~iFtKN~6Adtv2DA-TTzT0ReX53ik2-ja77Dtc1x0g~H5b5h6D1FFt~Aw8HqPMv7Poj6WXpA__&Key-Pair-Id=APKAIE5G5CRDK6RD3PGA)
Rest-frame EW distribution with respect to offset between the emission line region and the underlying UV continuum. On average, the EW increases with spatial offset, indicating that part of the reason for the high EW is that strong emission line regions are offset from the stellar disc. The EW distribution for C ii] and C iii] emitters peaks at larger spatial offsets, while for C iv which we find are mainly AGN, the offsets are not as large.
The distribution of rest-frame EW for the C ii] emitters extends up to 200 Å (as shown in Fig. 7). The chances of all of these high-EW sources being interlopers or variable sources is small as explained above. We have also been extremely conservative in our selection, and one source with a large EWrest of 84 Å as measured from our NB data has a spectroscopic redshift confirming it to be a C ii] emitter at z ∼ 0.68 (although this specific source could still be variable).
The rest-frame EW distribution of C iii] emitters extends up to large values, with an average of ∼100 Å (Fig. 7). These values place our C iii] sample in a different regime than other samples from the literature. Very recently, Du et al. (2017) published a spectroscopically selected C iii] sample at z ∼ 1 with a median EWrest of 1.3 Å. They also compared with results from the literature at redshifts up to ∼6 and found that, on average, the C iii] emitters discovered till now have EW of at most ∼25 Å and are hosted by young, low-mass, SF galaxies. The average EW of our C iii] emitters is also higher than what was found by Shapley et al. (2003) in stacks of LBGs, where their strongest Ly α emitters have mean rest-frame C iii] EW of about 10 per cent of Ly α, or ∼5.4 Å. The spectroscopically confirmed sources in our C iii] sample have lower EWs than our average (14 ± 1, 21 ± 9, 26 ± 3 and 39 ± 5 Å versus the average of 93 ± 59 Å). Note that both our zspec confirmed C iii] sources and the literature samples were chosen for spectroscopic follow-up because of their relatively bright nature. Since sources with spectra are continuum selected, this will bias samples towards lower EWs, while our samples are line emission selected, thus finding higher EWs. Hence, it is not surprising that the high-EW C iii] sources have not been confirmed with spectroscopy, in the absence of a dedicated, targeted spectroscopic follow-up programme. In addition, as mentioned earlier, any offset between the line-emitting region and the stellar light could also explain the large EW we are measuring. Therefore, for continuum selected sources, placing the spectroscopic slit or fibre on the main continuum-emitting region does not guarantee that the line emission will be captured. Spectroscopy focusing on the line-emitting regions is however crucial to unveil the nature of these emitters and understand the source of the high-EW emission.
The C iv emitters have average rest-frame EWs of 52 Å. It is important to note that a significant fraction of these are also spectroscopically confirmed, including a source with an EW of ∼100 Å measured using the NB and BB data (see Fig. 7). The values are consistent within the ranges measured from a large sample of ∼150 Type II quasars at z ∼ 2–4.3 by Alexandroff et al. (2013). They measure rest-frame EW ranging from 10 to 100 Å for their most secure Type II sample, with an average of about 40 Å. Note that the average C iv line fluxes in Alexandroff et al. (2013) are about (1–1.2) × 10−16 erg s−1, which is smaller than our average of 7.7 × 10⁻¹⁶ erg s−1, but consistent within the spread of the values. Without spectroscopic information, many of our C iv sources would have been likely Ly α candidates at higher redshifts. While traditionally it has been assumed that large EW emitters are Ly α, without clear, secure redshift information the emitter can be misidentified. It thus becomes apparent that C iv emitters can represent an important contaminating population, as was concluded in Sobral et al. (2017) and in Stroe et al. (2017b).
4.5 HST morphologies
Ancillary high-resolution space-based optical data are crucial in unveiling the nature of our emitters, especially in understanding their colour properties from Sections 4.1–4.3 and their high EWs (Section 4.4). For the sources with coverage in HST, we show their morphologies in Figs 8–10. The optical properties of the emitters are listed in Tables B1–B3.
12 out of the 16 C ii] sources have HST coverage, revealing a mix of morphology types. Seven C ii] emitters have a discy or spiral morphology, while four have a very bright nucleus and a spiral structure, indicative of a Seyfert nature. These Seyfert-like sources are also the most luminous in the emission line and have the lower EW (see Section 4.4). The possible mixed nature of C ii] emitters, some being powered by SF and some by AGN, is therefore not only supported by the optical and UV colours of the emitters (Sections 4.1–4.3), but also by the morphologies.
Out of our 24 C iii] sources, there are 19 with HST coverage, presenting a wide variety of morphologies. Some C iii] emitters have a spiral structure, others a disturbed morphology and multiple nuclei, others consisting of two or more interacting components. There are also two sources with a UV-bright core, indicative of a Seyfert nature, which are also among the brightest in the C iii] emission line.
10 out of 17 C iv sources have space telescope coverage and they are all point sources even at HST resolution. The HST data support a scenario where C iv emitters are predominantly quasars: all four sources with Chandra coverage have a direct X-ray detection, with an additional three sources with a radio detection. We note that the line luminosities of these sources span the LCIV ∼ 1042.6–1042.9 erg s−1 range.
We find that many line emitters, especially C ii] and C iii], are offset from the HST detection. This is illustrated in Fig. 11 where we plot the absolute offset between the emission line regions and the UV continuum against the rest-frame EW. As the distribution of offsets shows, larger offsets are more prevalent for C iii] emitters, while few large offsets are detected in the C iv emitter sample. There is also a trend of increasing EW with spatial offset when looking at the population as a whole. It is important to note that sources where the galaxy disc is most offset from the emission line detection in CALYMHA are also among the sources with the largest EW (see discussion of the large EW in Section 4.4). While there are a few C ii] and C iii] emitters with large EW at small offsets, the bulk of these emitters present offsets larger than 0.2 arcsec. At least for part of the C ii] and C iii] sample, a reason for large EWrest could be the offset between the main line emission region and the location of the bulk stellar light. Therefore, we have tentative evidence that some of the emission line regions can be offset by 1 arcsec from the brightest UV continuum component, which would result in large EW (see Figs 8 and 10). While the offset can be caused by a physical displacement, a caveat to note is the large PSF of the NB and BB INT observations used to calculate the EW, which can be prone to larger astrometric uncertainties and thus contribute towards the offsets we are measuring. We investigate the offset between CALYMHA sources and the HST counterparts and found that astrometric errors are in the 0.2–0.3 arcsec range, which is the expected value for INT observations (Sobral et al. 2017). Therefore, the large offsets found here are most likely of a physical origin, either by the presence of an AGN, and in the case of SF sources, by an offset between the stellar light and the line-emitting region. Another option, at least for some of the sources that are not spectroscopically confirmed, would be that they are in fact higher redshift, lensed Ly α emitters. This may explain the offsets as well as the large EW.
4.6 Chandra X-ray and VLA radio counterparts
While no emitters have direct FIR detections (and thus none can be extremely star-forming at the 1000 M⊙ yr−1 level), some sources do have an X-ray or radio counterpart, which we discuss here and summarize in Table 4. Five C ii] have Chandra coverage and 13 are covered by radio data. Nine C iii] sources are covered with Chandra and 22 with radio coverage, while four C iv are covered with X-ray and 13 with radio.
In the case of C ii], the results from the optical morphologies and colours are supported by the X-ray data: the disc galaxies with Chandra coverage do not have an X-ray counterpart, while the Seyferts have counterparts. None of the C ii] sources is active in the radio (out of 13 with coverage). The HST data reveal that some of the C ii] emitters have a spiral-like morphology. In that case, any radio emission will be powered by SF, which is low compared to AGN-powered radio emission. Additionally, only 5 per cent of Seyferts are radio loud. Therefore, the lack of radio detection for C ii] emitters is not surprising given the depth of the radio observations.
As mentioned in Section 4.5, the C iii] sources have a range of morphologies. One of the two sources with a UV-bright core, indicative of a Seyfert nature, has coverage in Chandra and VLA and possesses an X-ray and radio detection. As expected for normal SF galaxies, none of the other C iii] sources have radio or X-ray counterparts. A detection would imply very large star formation rate (SFRs) of ∼1000 M⊙ yr−1.
The radio and Chandra data for C iv, in agreement with HST, support a scenario where C iv emitters are predominantly quasars: all four sources with Chandra coverage have a direct X-ray detection, with an additional three sources with a radio detection.
In conclusion, the X-ray and radio data suggest that C iii] is mostly powered by SF. C iv and some C ii] emitters are active in the X-ray, indicating that they are young, actively accreting in the radiatively driven, quasar mode. Only a few C iv and no C ii] have radio detections, which would be indicative of a more evolved AGN in the mechanical, radio-loud phase.
4.7 Average SFRs and BHARs
4.7.1 Chandra stacking
To evaluate the level of activity of the central supermassive black hole (BH) in our emitters, we can estimate the black hole accretion rate (BHAR) that can be derived from X-ray data. We follow the method described in Calhau et al. (2017) to measure the average BHAR for the C ii], C iii] and C iv emitters by stacking sources with Chandra coverage.
4.7.2 FIR and radio stacking
We use FIR and radio data to obtain an average SFR in our sources.
Note that in the case of radio, unlike FIR, a direct detection is caused by an AGN rather than SF. We find that if we remove all detections, our radio stacks all provide non-detections in the same range as the FIR ones.
4.7.3 Stacking results
The results of our X-ray, FIR and radio stacking analysis are listed in Table 5. The stacked X-ray image can be found in Fig. 12, which shows clear detections for C ii] and C iv and a very faint/non-detection for C iii]. We plot our BHAR results and compare with similar measurements obtained for H α and FIR selected SF galaxies, Ly α emitters and AGN (Delvecchio et al. 2015; Stanley et al. 2015; Calhau et al. 2017; Calhau et al., in preparation) in Fig. 13. Note however the low-number statistics, driven by the small area of the publicly available Chandra images.
![The X-ray stack for sources with coverage in COSMOS with Chandra. The C ii] and C iv detections are consistent with AGN activity with large X-ray luminosities of 1043.5 and 1044.4 erg s−1, respectively. The much fainter C iii], with an average X-ray luminosity of 1042.8 erg s−1, is likely dominated by SF galaxies with a very minor AGN contamination, consistent with our results. The images are on the same colour scale.](https://oup.silverchair-cdn.com/oup/backfile/Content_public/Journal/mnras/471/3/10.1093_mnras_stx1712/3/m_stx1712fig12.jpeg?Expires=1750546047&Signature=NU7E03CNsh7ZXWUXdpcffomWpukA1K6zxyUc6Lh2ICQc7h0XbiojH-Yf1-CJiDEl603iEXWD0ff3wEFmiEWMbPfso7g4TV0u9qtqe2Ih14RRVjoNOcUc2KSW0COTUTOjTB2HHHHj8h7Vq3wMq-CzLXla-12WBqIH5guaj~7Mn7I3aPBKOfowcQItWlh9~IbBRpyKvV4FrqPk5~tdlA~Llgl2wHg3ho3AbY0Un8CWusneQ~ncmubnb-x54~OOB3gVoud4BLCeQHWzps3hcl41PuRxz8fAv5IaOOsEox3pzCJRnn3wZfOu8zWoH~cgJMJazJhlXFPhqu84LoEdiPWc5A__&Key-Pair-Id=APKAIE5G5CRDK6RD3PGA)
The X-ray stack for sources with coverage in COSMOS with Chandra. The C ii] and C iv detections are consistent with AGN activity with large X-ray luminosities of 1043.5 and 1044.4 erg s−1, respectively. The much fainter C iii], with an average X-ray luminosity of 1042.8 erg s−1, is likely dominated by SF galaxies with a very minor AGN contamination, consistent with our results. The images are on the same colour scale.
![The BHAR for the stacked C ii], C iii] and C iv sources, obtained by converting their average X-ray luminosities into accretion rates. All C iv sources are directly detected in the X-ray. Upper limits for C ii] and C iii] stacks are given with direct detections removed. C ii] emitters have a high average BHAR, similar to AGN. C iii] emitters have BHAR similar to H α selected, main-sequence SF galaxies. C iv emitters have extremely high accretion rates, consistent with bright quasars. We also plot the BHAR for H α selected, SF galaxies (Calhau et al. 2017). Overplotted in dark grey are main-sequence, FIR selected SF galaxies from Delvecchio et al. (2015). The different values are stacks for galaxies of different masses and SFRs. The light grey points represent AGN from Stanley et al. (2015) stacked in different luminosity bins. We also plot the result for Ly α emitters at z ∼ 2.23 from Calhau et al. (in preparation), with and without the direct X-ray detections included in the stacks.](https://oup.silverchair-cdn.com/oup/backfile/Content_public/Journal/mnras/471/3/10.1093_mnras_stx1712/3/m_stx1712fig13.jpeg?Expires=1750546047&Signature=oRwc~2QKi-lGdqQIPxKHfRVDrJyjE-~CTxrSmyml6098jnlE~btq~ua5HMO~F5GOMNlPoiDBc9QcWPAb3mEpfCJGhKpAFkdMxyZN07KWSSFcqHiQ4wfUmZS6zoicCoVjba2NNtQQTERJF4wajy-xLA~8idMWifsTcLOEI9rUEoK-PLbLOaOduERrop81xszEFsW4cQxOda7F8T8XxXcxsVzqqyHBHw4X8mD-yHYacvLwMIJD0CY3GX2zkARnVIg-btp-OtnEkgIp98~U19iLGMBPvRXIlkJFlPLJHXx4z9uIbn3x~3CUNX-prOBXgDZRYl1~PYJbKp59EbilfukmMQ__&Key-Pair-Id=APKAIE5G5CRDK6RD3PGA)
The BHAR for the stacked C ii], C iii] and C iv sources, obtained by converting their average X-ray luminosities into accretion rates. All C iv sources are directly detected in the X-ray. Upper limits for C ii] and C iii] stacks are given with direct detections removed. C ii] emitters have a high average BHAR, similar to AGN. C iii] emitters have BHAR similar to H α selected, main-sequence SF galaxies. C iv emitters have extremely high accretion rates, consistent with bright quasars. We also plot the BHAR for H α selected, SF galaxies (Calhau et al. 2017). Overplotted in dark grey are main-sequence, FIR selected SF galaxies from Delvecchio et al. (2015). The different values are stacks for galaxies of different masses and SFRs. The light grey points represent AGN from Stanley et al. (2015) stacked in different luminosity bins. We also plot the result for Ly α emitters at z ∼ 2.23 from Calhau et al. (in preparation), with and without the direct X-ray detections included in the stacks.
Average X-ray luminosity and BHAR, as resulting from a stacking analysis of the C ii], C iii] and C iv emitters (with zspec or zphot), including direct detections. While C ii] and C iv emitters are consistent with AGN activity, C iii] values fall in the SF galaxy regime. Note that removing the direct X-ray detections results in non-detections in the stacks because of the very low numbers of sources left. We also present SFR upper limits obtained from FIR and radio data. Note that individual detections are removed from the radio stack as a direct radio detection will be caused by an AGN rather than SF (which is the purpose of our radio stacks). We also report SFR measurements from the UV, assuming that all UV radiation is coming from SF. We removed sources where ancillary data strongly indicated the presence of an AGN. Therefore, we report no average UV SFR for C iv emitters.
| Line | log LX | BHAR | No sources | SFRFIR 3σ upper limit | SFRradio 3σ upper limit | Mean SFRUV | Median SFRUV |
|---|---|---|---|---|---|---|---|
| (erg s−1) | (M⊙ yr−1) | (M⊙ yr−1) | (M⊙ yr−1) | (M⊙ yr−1) | (M⊙ yr−1) | ||
| C ii] | 43.46 ± 0.56 | 0.10 ± 0.06 | 5 | <15 | <17 | 7 ± 10 | 2 ± 13 |
| C iii] | 42.80 ± 0.37 | 0.02 ± 0.01 | 9 | <75 | <35 | 120 ± 345 | 24 ± 430 |
| C iv | 44.37 ± 0.08 | 0.83 ± 0.12 | 4 | <141 | <115 | – | – |
The stacking analysis indicates that C ii] emitters are bright in the X-rays and are consistent with AGN activity (BHAR = 0.10 ± 0.06 M⊙ yr−1), as revealed by Fig. 13. C ii] emitters accrete matter on to their BH at a much higher rate than SF galaxies. The C ii] emission, as suggested, for example, by Best et al. (2002), could then be in part powered by shocks near the BH.
Once the only source with an X-ray detection is removed, C iii] emitters have an upper limit X-ray luminosity consistent with SF activity and a low BHAR (0.02 ± 0.01 M⊙ yr−1), similar to what is measured from H α and FIR selected SF galaxies (Delvecchio et al. 2015; Calhau et al. 2017).
The average X-ray luminosity of the C iv sources is very high, ∼1044.4 erg s−1, supporting an active nucleus that accretes matter at a rate of ∼0.83 M⊙ yr−1. This value is well above the rate expected for main-sequence SF galaxies, lying in the AGN region of Fig. 13. This is consistent with the optical properties of the C iv emitters discussed in previous sections.
There are no detections in the FIR bands, so we are only able to provide 3σ SFR upper limits of 15, 75, 141 M⊙ yr−1 for C ii], C iii], C iv, respectively. Note that the different values are mostly driven by the different redshifts of the three types of emitters. The FIR non-detections are mostly caused by the relatively low number of sources in each stack compared to the detections from Calhau et al. (2017), who stacked about 10 times more sources than included in this analysis. In order to further test this, we stack the H α emitters at z ∼ 0.84 in the FIR, using the same number of sources as our C iii] emitters and find no detection. We therefore conclude that C iii] emitters are fully consistent with being similar to H α selected samples at a similar redshift, including the fact that, as seen before, they are slightly redder than LBGs.
Similarly, we do not have a detection in the radio stacks after removing direct detections (which are caused by AGN, not SF). These upper limits, as for the FIR, are not very stringent (∼17, 35, 115 M⊙ yr−1 for C ii], C iii] and C iv, respectively). The range of typical SFR from H α emission at z ∼ 0.8–1.5 is in the range 8–16 M⊙ yr−1 (Sobral et al. 2013), well below our FIR and radio depths.
4.7.4 UV SFRs
We also attempt to estimate the SFRs of C ii], C iii] and C iv emission from the rest-frame UV emission. While UV emission is produced by young, massive stars, thus indicating recent SF episodes, this SFR estimator can be heavily affected by the dust content of the host galaxy. As well, in the cases of galaxies hosting an AGN, accretion can also produce significant UV, making it harder to disentangle the contribution from SF.
We list the average and median SFRs for C ii] and C iii] in Table 5. We would like to point out that these values depend on a number of assumptions and can be affected by uncertainties. The β slope is not measured exactly at the wavelengths defined in Calzetti et al. (2000). A large unknown is the proportion of UV emission that can actually be attributed to SF, and how much to other support such as AGN activity. To alleviate this as much as possible, we remove sources that we were able to classify as AGN from our ancillary data. In the case of C iv emitters, which we classified predominantly as quasars, we do not report a UV-based SFR. As discussed in the paper, the properties of C iv emitters are consistent with a population of AGN/quasars, especially for bright sources (MUV ∼ −22). Therefore, most of the UV for C iv sources comes from accretion processes on to the central BH.
We note that for both C ii] and C iii], the mean SFR is much larger than the median value, indicating that a few outliers with very large SFR bias the measurements.
The SFRUV values for C ii] emitters are typically lower than those of C iii] emitters, with averages a factor of 25 lower and medians a factor of 10 lower. This supports the scenario discussed in previous sections of the paper, where C ii] emitters are most likely hosted in SF galaxies and/or AGN. The average SFR for C iii] emitters is consistent with values obtained in stacks of typical, H α selected SF galaxies, using FIR as SF tracer. Calhau et al. (2017) find values of 13 M⊙ yr−1 at z ∼ 0.85 and 32 M⊙ yr−1 at z ∼ 1.5. Nevertheless, this comparison should be made with caution given the difficulty in comparing different SFR estimators.
5 DISCUSSION
We investigate the nature of C ii], C iii] and C iv line emitters by jointly interpreting their emission line properties with BB optical colours as well as ancillary space-based optical and X-ray data.
5.1 C ii] emitters z ∼ 0.68
C ii] emitters at z ∼ 0.68 have optical colours spanning across the colour space of SF galaxies at their redshift into a regime more typical of SF sources at higher cosmic distances. Such unusual optical colours may indicate that while part of the C ii] emitter population is powered by SF, at least some sources host an AGN, in agreement with LF and cosmic ratio results from Stroe et al. (2017b). This is also supported by the HST morphology of C ii] sources: while some sources have spiral-like morphologies, part of the population, particularly the sources with atypical colours, have a bright nucleus accompanied by a disc. While the bright nucleus could be indicative of a nuclear starburst surrounded by a stellar disc, this scenario is not supported by the X-ray data that reveal that these C ii] emitters have BHARs consistent with an AGN at their core. C ii] emitters have relatively steep β slopes, which indicate a relatively blue UV continuum. This is also supported by the lack of a detection in the FIR stacks of these sources. C ii] emitters also have high rest-frame EWs, which could be caused by either the offset we observe between the main stellar disc and the line-emitting region, or by AGN activity.
Traditionally, it was thought that C ii] emission is mostly triggered in shocks around AGN (Best et al. 2000, 2002; De Breuck et al. 2000); however, this resulted from studies of this line being done almost exclusively in bright, active galaxies. Overall, our results indicate that C ii] emitters may actually be powered in part by blue, SF galaxies at lower luminosities and in part by Seyfert-like sources with young, actively accreting AGN at brighter line luminosities.
5.2 C iii] emitters at z ∼ 1.05
Most C iii] emitters at z ∼ 1.05 have optical colours consistent with SF galaxies at their redshift. Furthermore, their low average BHAR is also consistent with SF galaxies. The β UV slopes of C iii] emitters are consistent with H α selected galaxies, indicating that C iii] emission might be suitable avenue for selecting a wide range of SF galaxies. C iii] sources are also mostly X-ray and radio quiet, as expected for SF galaxies. Most emitters have discy, clumpy or disturbed optical morphologies, indicative of either single or interacting SF galaxies. The offset optical disc or the clumpy/disturbed morphologies might explain the large EW we find for some C iii] emitters. The few direct X-ray and radio detections (<10 per cent) correlate with a bright nucleus plus a disc optical morphology, which indicates that the brightest C iii] emitters host an AGN at their core.
Traditionally, C iii] emission was thought to originate from AGN. More recent results focusing on SF galaxies find that ∼20 per cent of local galaxies have the C iii] feature and the strongest C iii] emission is fostered at low metallicities (Rigby et al. 2015). Part of their sample are Wolf–Rayet galaxies, indicating recent (few Myr), short-lived (<1 Myr) strong starbursts. At higher redshifts (1.5–3), Stark et al. (2014) find that almost all of their C iii] emitters also possess strong Ly α. Stanway et al. (2016), in agreement with Jaskot & Ravindranath (2016), showed that the presence of binary stars can increase the ionizing flux by up to 60 per cent in low-metallicity (<0.3 Z⊙) environments, which could also lead to a boost in C iii] production.
While these works indicate that strong C iii] is produced in relatively low metallicity SF galaxies, our results strongly support a scenario where C iii] emitters trace a more general population of SF galaxies at z ∼ 1, with very few bright emitters being powered by AGN. This is similar to what is found in studies of Ly α and H α emitters at z > 2 (Matthee et al. 2015, 2017; Konno et al. 2016; Sobral et al. 2017). However, as shown in Stroe et al. (2017b), at fixed UV magnitude of line flux, the number density of C iii] emitters is substantially lower than H α or LBG SF galaxy populations, indicating that only a fraction of galaxies have strong C iii]. The average line ratios imply that C iii] is ∼20 times fainter than H α and ∼4 times fainter than observed Ly α (Stroe et al. 2017b).
An open question relates to the large EWrest we measure for bulk of the C iii] population. According to photoionization modelling, the largest EWs that can be reached with star formation are of the order of 25 Å (Jaskot & Ravindranath 2016). As discussed earlier in the paper, the large EW cannot be solely attributed to systematic errors in the EW estimation or effects such as variability. Whether the discrepancies between our observations and the modelling can be attributed to spatial offsets between emission line regions, we cannot ascertain for sure with the current data. Spectroscopic follow-up will reveal the detailed physics of the C iii] emitters, as well as confirm or dismiss the large EW measured here.
5.3 C iv emitters z ∼ 1.53
The direct detections in the X-ray, the high accretion rates characteristic for bright AGN, the universal optical quasar morphologies, the unusual optical colours and blue UV slopes and large rest-frame EW, all reveal that C iv is produced in intense radiation fields characteristic to young, virtually dust-free actively accreting quasars. The number distribution of C iv emitters as a function of line luminosity also indicates that they are primarily a quasar population, being well described by a power law (Stroe et al. 2017b).
In a sample of lensed, low-mass galaxies at z ∼ 1.5–3, Stark et al. (2014) find ubiquitous joint detections of C iv and C iii], which require young stellar populations, increased electron temperatures and an enhanced ionizing output from metal-poor gas and stars. While the modelling is still uncertain, their work therefore indicates that the C iv emission is mainly driven by young stars, without particular need for an AGN contribution.
Our results, however, seem to support a scenario where the bulk of the C iv is produced in galaxies hosting powerful AGN at least at z ∼ 1.5. One important aspect to note is that the rest-frame UV magnitudes of the sources from Stark et al. (2014) are similar to ours, so a comparison is appropriate from this point of view. However, the galaxies in the Stark et al. (2014) sample are at a higher redshift and also span on average lower EW values (<15 Å for the Stark sample versus 34 ± 58 Å for our sample).
6 CONCLUSIONS
We characterize the properties of C ii], C iii] and C iv emitters at z ∼ 0.68, 1.05, 1.53. These sources were selected from the first blind, statistical study of carbon emitters, uniformly selected in the COSMOS and UDS field as part of the CALYMHA survey. In this paper, we focus on the UV, optical, X-ray, FIR and radio properties of these emitters. Our main results are as follows.
C ii] emitters at z ∼ 0.68 have discy structure or bright nucleus with a disc morphology (Fig. 8) and blue UV colours (Figs 4 and 6). Some of the brightest line emitters are strong X-ray sources (Fig. 12), with BHARs (Fig. 13) characteristic of AGN. Our results therefore indicate that C ii] traces a mixed population of SF galaxies and AGN, especially at the brightest line luminosities. For the brighter emitters, our results are in accordance with the theoretical expectation that C ii] emission is triggered by shocks around AGN.
C iii] emitters at z ∼ 1.05 in our study have typical optical colours for SF galaxies (Fig. 3) and morphologies indicative of either isolated or interacting galaxies (Fig. 9). Their relatively blue rest-frame UV and optical colours (Figs 5 and 6) and low BHARs (Fig. 13) are consistent with general populations of SF galaxies.
The point-like HST morphologies (Fig. 10), the strong X-ray detections implying high accretion rates (Figs 12 and 13) and the blue optical and UV colours (Figs 4 and 6) indicate that C iv emitters are almost universally blue/non-dusty quasars.
We discover a large, previously undetected population of C ii], C iii] and C iv emitters with large rest-frame EW, of above 50 Å, potentially up to 200 Å (Fig. 7). In stark contrast, the typical EW of continuum selected C iii] samples from the local Universe up to z ∼ 6 is ≲ 25 Å. This large EW might be caused by emission line regions offset from the stellar disc or because of the AGN nature of some of the sources.
While historically thought to originate in AGN, our study revealed some interesting properties of C ii], C iii] and C iv emitters at z ∼ 0.7–1.5. While C iv emitters are almost universally quasars, C iii] emission is consistent with being produced in a wide variety of SF galaxies and C ii] emission may trace either an AGN or SF. Further spectroscopy is crucial however to unveil their powering source and the physics of the large EW we measure in a fraction of the population. In the companion paper, Stroe et al. (2017b), we further explore the samples and derive LFs and cosmic average line ratios.
Acknowledgements
We would like to thank the anonymous referee for her/his valuable input that helped improve the clarity and interpretation of our results. DS acknowledges financial support from the Netherlands Organisation for Scientific research (NWO), through a Veni fellowship. IO acknowledges support from the European Research Council in the form of the Advanced Investigator Programme, 321302, COSMICISM. CALYMHA data are based on observations made with the Isaac Newton Telescope (proposals 13AN002, I14AN002, 088-INT7/14A, I14BN006, 118-INT13/14B, I15AN008) operated on the island of La Palma by the Isaac Newton Group in the Spanish Observatorio del Roque de los Muchachos of the Instituto de Astrofísica de Canarias. Also based on data products from observations made with ESO Telescopes at the La Silla Paranal Observatory under ESO programme IDs 098.A-0819 and 179.A-2005. We are grateful to E. L. Wright and J. Schombert for their cosmology calculator. We would like to thank the authors of numpy (van der Walt et al. 2011), scipy (Jones et al. 2001), matplotlib (Hunter 2007) and astropy (Astropy Collaboration et al. 2013) for making these packages publicly available. This research has made use of the NASA/IPAC Extragalactic Database (NED), which is operated by the Jet Propulsion Laboratory, California Institute of Technology, under contract with the National Aeronautics and Space Administration. This research has made use of NASA’s Astrophysics Data System. This research has made use of the VizieR catalogue access tool, CDS, Strasbourg, France. The original description of the VizieR service was published in Ochsenbein, Bauer & Marcout (2000). This research has made use of ‘Aladin sky atlas’ developed at CDS, Strasbourg Observatory, France (Bonnarel et al. 2000; Boch & Fernique 2014). The CALYMHA catalogue used for this study is publicly available from Sobral et al. (2017).
REFERENCES
SUPPORTING INFORMATION
Supplementary data are available at MNRAS online.
Table B1. Properties of the z ∼ 0.7 C ii] emitters: coordinates, spectroscopic redshift information availability, HST optical morphologies and possible X-ray and radio counterparts.
Table B2. Same as Table B2, but for C iii] emitters at z ∼ 1.05.
Table B3. Same as Table B1, for C iv emitters at z ∼ 1.53.
Please note: Oxford University Press is not responsible for the content or functionality of any supporting materials supplied by the authors. Any queries (other than missing material) should be directed to the corresponding author for the article.
APPENDIX A: EFFECT OF VARIABILITY ON THE MEASURED EW
Since the NB and BB observations were taken in different years, it is possible that any variable source (such as an AGN) is falsely selected as a line emitter or has an over- or underestimated EW. This is because, on such time-scales, the continuum UV magnitudes of AGN may change by ∼1 mag (e.g. Ulrich, Maraschi & Urry 1997; de Vries, Becker & White 2003; Favre, Courvoisier & Paltani 2005; Sarajedini et al. 2011; Micheva, Iwata & Inoue 2017). Thus, there is the possibility that some of the large-EW sources are not line emitters, but variable sources caught in a high state in the NB, but in a low state in the BB, thus mimicking a colour excess. Another possibility is that some of the EWs are overestimated because of variability.
We empirically estimate the number of variable sources that may contaminate our sample as follows. If such variable sources exist, we expect not only to find them in the sample of line emitters, but also in samples of absorbers (with negative excess). Therefore, we select galaxies with statistically significant negative excess (from Sobral et al. 2017). Among these, we focus on X-ray AGN by matching negative excess sources with the catalogue of X-ray detected sources from Civano et al. (2012), resulting in 13 matches (all with available spectroscopic redshifts). We remove four sources for which the absorption feature corresponds to Ly α forest between 912and1216 Å, as well as two sources for which the absorption feature can be explained by C iv absorption. The remaining seven AGN are at redshifts 0.9 < z < 2.0, and no obvious absorption feature is present at the wavelength traced by the NB. Thus, we assume that these seven AGN are in fact variable sources that mimic an absorption feature. These AGN have randomly distributed excesses between −0.4 and −1.1. If we would assume that such variable sources with such excess exist, we would expect seven line emitters to be variable sources with EWobs ≈ 30–110 Å. Therefore, while a few of the large-EW sources might be variable AGN, variability cannot fully explain the distribution of EW. One possibility we cannot rule out is variability with a smaller magnitude ranges (−0.2 to 0.2 mag), because of photometric errors. Therefore, while some EW may be boosted, in some cases, the measured EWs will be lower than in reality. Spectroscopic follow-up is required to completely verify some of the highest EWs.
APPENDIX B: PROPERTIES OF INDIVIDUAL C ii], C iii] AND C iv EMITTERS
In Tables B1–B3, we list the individual properties of C ii], C iii] and C iv emitters, respectively. We give the coordinates of the sources, their optical HST morphology, possible X-ray and radio counterparts, as well as line luminosity, rest-frame EW (EWrest) and the observed (U − B)obs colour.
Properties of the z ∼ 0.7 C ii] emitters: coordinates, spectroscopic redshift information availability, HST optical morphologies and possible X-ray and radio counterparts. We also list the emitters’ line luminosity, rest-frame EWrest and observed (U − B)obs colour. The error on the (U − B)obs colour was calculated assuming the maximal magnitude errors of 0.05. A fits version of this table can be found online.
| CALYMHA ID | RA | Dec. | zspec | HST | Chandra | Radio 1.4 GHz | log LCII] | EWrest | (U − B)obs |
|---|---|---|---|---|---|---|---|---|---|
| (hh: mm: ss) | ( ° : ΄ : ″ ) | confirmed | morphology | counterpart | counterpart | (erg s−1) | (Å) | (mag) | |
| CALYMHA-S16-5 | 10: 02: 37.01 | 02: 40: 28.9 | NO | face-on spiral | –a | NO | 41.44 | 56±22 | 0.27±0.07 |
| CALYMHA-S16-53 | 10: 01: 54.84 | 02: 16: 20.3 | NO | face-on spiral | NO | NO | 41.47 | 239±137 | 0.55 |
| CALYMHA-S16-61 | 10: 01: 44.50 | 02: 12: 34.2 | NO | face-on spiral | NO | NO | 41.42 | 216±130 | 0.26 |
| CALYMHA-S16-74 | 10: 01: 31.30 | 02: 54: 42.8 | NO | – | – | NO | 41.26 | 277±105 | 0.30 |
| CALYMHA-S16-100 | 10: 00: 58.73 | 02: 25: 56.3 | YES | bright core & disc | YES | NO | 41.88 | 18±1 | 0.54 |
| CALYMHA-S16-149 | 10: 00: 13.03 | 01: 51: 54.0 | NO | disc galaxy | NO | NO | 41.30 | 74±34 | 0.55 |
| CALYMHA-S16-178 | 09: 59: 36.48 | 01: 38: 45.6 | NO | bright core & disc | – | NO | 41.32 | 43±26 | 0.38 |
| CALYMHA-S16-181 | 09: 59: 35.45 | 01: 43: 01.6 | NO | disc galaxy | – | NO | 41.39 | 79±42 | 0.33 |
| CALYMHA-S16-256 | 09: 58: 34.68 | 02: 40: 37.2 | NO | face-on spiral | – | NO | 41.31 | 155±105 | 0.08 |
| CALYMHA-S16-258 | 09: 58: 33.86 | 02: 40: 34.7 | NO | face-on spiral | – | NO | 41.33 | 99±61 | 0.14 |
| CALYMHA-S16-265 | 09: 58: 26.66 | 02: 28: 17.8 | YES | bright core & disc | – | NO | 42.12 | 128±8 | 0.13 |
| CALYMHA-S16-275 | 09: 58: 13.34 | 02: 05: 36.6 | YES | bright core & disc | YES | NO | 42.04 | 27±7 | 0.26 |
| CALYMHA-S16-335 | 09: 57: 25.01 | 02: 31: 19.9 | NO | – | – | – | 41.18 | 107±46 | 0.24 |
| CALYMHA-S16-340 | 09: 57: 24.26 | 02: 38: 21.1 | NO | – | – | NO | 41.22 | 94±37 | 0.51 |
| CALYMHA-S16-358 | 09: 56: 59.33 | 01: 52: 35.8 | NO | – | – | – | 42.20 | 16±2 | 0.29 |
| CALYMHA-S16-388 | 02: 17: 17.33 | −05: 14: 24.7 | NO | interacting, three nuclei | – | – | 41.64 | 52±5 | −0.26 |
aNot applicable, there is no coverage in that respective band.
Same as Table B2, but for C iii] emitters at z ∼ 1.05. A fits version of this table is available online.
| CALYMHA ID | RA | Dec. | zspec | HST | Chandra | Radio 1.4 GHz | log LCIII] | EWrest | (U − B)obs |
|---|---|---|---|---|---|---|---|---|---|
| (hh: mm: ss) | ( ° : ΄ : ″ ) | confirmed | morphology | counterpart | counterpart | (erg s−1) | (Å) | (mag) | |
| CALYMHA-S16-29 | 10: 02: 14.28 | 02: 32: 57.8 | NO | merger | –a | NO | 41.87 | 111±51 | 0.30±0.07 |
| CALYMHA-S16-55 | 10: 01: 53.71 | 02: 18: 58.3 | NO | disturbed | NO | NO | 41.87 | 53±27 | 0.31 |
| CALYMHA-S16-73 | 10: 01: 31.97 | 02: 26: 47.4 | NO | spiral | NO | NO | 41.90 | 86±50 | 0.17 |
| CALYMHA-S16-114 | 10: 00: 50.83 | 01: 59: 55.3 | NO | disturbed | NO | NO | 41.65 | 61±13 | 0.19 |
| CALYMHA-S16-127 | 10: 00: 38.50 | 02: 00: 04.3 | NO | interacting | NO | NO | 41.69 | 90±20 | 0.15 |
| CALYMHA-S16-153 | 10: 00: 09.19 | 01: 54: 50.0 | NO | disturbed | NO | NO | 41.77 | 33±15 | 0.29 |
| CALYMHA-S16-162 | 09: 59: 54.29 | 01: 39: 42.1 | NO | faint/diffuse | – | NO | 41.80 | 179±124 | 0.33 |
| CALYMHA-S16-182 | 09: 59: 35.33 | 01: 48: 18.4 | NO | spiral | NO | NO | 41.76 | 194±111 | 0.18 |
| CALYMHA-S16-194 | 09: 59: 27.79 | 02: 53: 13.6 | NO | – | – | NO | 41.80 | 77±45 | 0.48 |
| CALYMHA-S16-205 | 09: 59: 18.79 | 01: 40: 32.2 | NO | diffuse spiral | – | NO | 41.78 | 37±22 | 0.28 |
| CALYMHA-S16-212 | 09: 59: 16.06 | 01: 50: 48.1 | YES | bright core & disc | YES | YES | 42.42 | 21±3 | 0.23 |
| CALYMHA-S16-218 | 09: 59: 12.84 | 01: 39: 09.4 | NO | interacting galaxies | – | NO | 41.78 | 96±60 | 0.68 |
| CALYMHA-S16-237 | 09: 59: 03.00 | 01: 38: 47.4 | NO | compact galaxy | – | NO | 42.36 | 73±16 | 0.07 |
| CALYMHA-S16-262 | 09: 58: 29.69 | 02: 48: 04.3 | NO | diffuse galaxy | – | NO | 41.80 | 92±54 | 0.21 |
| CALYMHA-S16-267 | 09: 58: 22.82 | 01: 54: 55.8 | NO | disturbed galaxy | NO | NO | 41.84 | 196±114 | 0.62 |
| CALYMHA-S16-268 | 09: 58: 22.30 | 01: 49: 13.8 | NO | diffuse spiral | – | NO | 41.85 | 144±76 | 0.26 |
| CALYMHA-S16-273 | 09: 58: 19.85 | 02: 05: 05.6 | NO | interacting | NO | NO | 42.02 | 96±65 | 0.36 |
| CALYMHA-S16-290 | 09: 57: 51.22 | 02: 35: 30.1 | NO | faint, compact | – | NO | 41.69 | 192±99 | 0.04 |
| CALYMHA-S16-291 | 09: 57: 51.07 | 02: 21: 33.8 | NO | – | – | NO | 41.68 | 141±66 | 0.39 |
| CALYMHA-S16-292 | 09: 57: 50.74 | 02: 21: 32.4 | NO | – | – | NO | 41.59 | 21±9 | 0.21 |
| CALYMHA-S16-293 | 09: 57: 50.45 | 02: 28: 35.0 | NO | diffuse spiral | – | NO | 41.59 | 87±41 | 0.32 |
| CALYMHA-S16-297 | 09: 57: 48.46 | 02: 24: 01.4 | NO | – | – | NO | 41.61 | 178±103 | 1.79 |
| CALYMHA-S16-314 | 09: 57: 35.57 | 02: 25: 50.9 | NO | – | – | – | 41.63 | 131±65 | 0.29 |
| CALYMHA-S16-317 | 09: 57: 33.48 | 02: 26: 58.6 | NO | – | – | – | 41.64 | 37±15 | 0.30 |
| CALYMHA-S16-326 | 09: 57: 27.82 | 02: 24: 07.9 | NO | – | – | – | 41.70 | 148±68 | 0.05 |
| CALYMHA-S16-328 | 09: 57: 26.66 | 02: 24: 26.3 | NO | – | – | – | 41.61 | 42±18 | 0.17 |
| CALYMHA-S16-349 | 09: 57: 08.86 | 01: 49: 52.0 | NO | – | – | – | 41.73 | 44±33 | 0.23 |
| CALYMHA-S16-352 | 09: 57: 05.81 | 01: 58: 54.5 | NO | – | – | – | 41.69 | 49±38 | 0.07 |
| CALYMHA-S16-363 | 02: 18: 17.38 | −04: 51: 12.2 | YES | – | – | – | 42.96 | 14±1 | NaNb |
| CALYMHA-S16-371 | 02: 17: 49.92 | −05: 03: 15.8 | NO | – | – | – | 41.80 | 124±53 | −0.07 |
| CALYMHA-S16-381 | 02: 17: 36.53 | −05: 21: 56.5 | YES | – | – | – | 41.81 | 26±3 | 0.12 |
| CALYMHA-S16-385 | 02: 17: 28.68 | −05: 18: 49.3 | NO | – | – | – | 41.72 | 68±20 | −0.30 |
| CALYMHA-S16-394 | 02: 17: 13.10 | −05: 02: 14.6 | NO | – | – | – | 41.78 | 69±18 | −0.22 |
| CALYMHA-S16-412 | 02: 16: 41.16 | −05: 13: 19.2 | YES | bright core, faint arcs | – | – | 41.87 | 39±5 | NaN |
aNot applicable, there is no coverage in that respective band.
bNaN: not measured because undetected in one band.
Same as Table B1, for C iv emitters at z ∼ 1.53. A fits version of this table can be found online.
| CALYMHA ID | RA | Dec. | zspec | HST | Chandra | Radio 1.4 GHz | log LCIV | EWrest | (U − B)obs |
|---|---|---|---|---|---|---|---|---|---|
| (hh: mm: ss) | ( ° : ΄ : ″ ) | confirmed | morphology | counterpart | counterpart | (erg s−1) | (Å) | (mag) | |
| CALYMHA-S16-16 | 10: 02: 29.16 | 02: 09: 31.7 | YES | p.s.a | –b | NO | 42.84 | 8±1 | 0.33±0.07 |
| CALYMHA-S16-26 | 10: 02: 17.98 | 01: 58: 36.8 | YES | p.s. | – | YES | 43.02 | 66±3 | 0.56 |
| CALYMHA-S16-58 | 10: 01: 47.28 | 02: 47: 29.4 | YES | p.s. | – | NO | 42.71 | 41±3 | 0.28 |
| CALYMHA-S16-63 | 10: 01: 41.26 | 02: 23: 08.2 | YES | p.s. | YES | NO | 42.65 | 97±33 | −0.22 |
| CALYMHA-S16-92 | 10: 01: 11.98 | 02: 30: 25.2 | YES | p.s. | YES | NO | 42.59 | 7±1 | 0.41 |
| CALYMHA-S16-118 | 10: 00: 47.95 | 02: 11: 26.9 | YES | p.s. | YES | NO | 42.77 | 12±1 | 0.64 |
| CALYMHA-S16-135 | 10: 00: 28.08 | 01: 55: 47.6 | YES | p.s. | YES | NO | 42.88 | 72±4 | 0.35 |
| CALYMHA-S16-226 | 09: 59: 08.69 | 02: 54: 24.5 | YES | – | – | possible faint source | 43.54 | 7±1 | 0.62 |
| CALYMHA-S16-236 | 09: 59: 04.01 | 02: 50: 40.6 | NO | – | – | NO | 42.23 | 138±89 | 0.49 |
| CALYMHA-S16-250 | 09: 58: 48.86 | 02: 34: 41.2 | YES | p.s. | – | NO | 43.36 | 24±1 | 0.78 |
| CALYMHA-S16-274 | 09: 58: 15.50 | 01: 49: 22.8 | YES | p.s. | – | YES | 43.38 | 16±1 | 0.14 |
| CALYMHA-S16-289 | 09: 57: 52.22 | 02: 35: 24.0 | NO | faint p.s. | – | NO | 41.99 | 156±96 | 0.33 |
| CALYMHA-S16-319 | 09: 57: 31.70 | 02: 25: 52.3 | NO | – | – | – | 41.99 | 90±46 | 0.55 |
| CALYMHA-S16-325 | 09: 57: 28.32 | 02: 25: 41.9 | YES | – | – | – | 43.76 | 31±1 | 0.48 |
| CALYMHA-S16-364 | 02: 18: 16.80 | −05: 00: 55.1 | YES | – | – | – | 42.19 | 80±28 | −0.65 |
| CALYMHA-S16-372 | 02: 17: 47.16 | −04: 56: 24.7 | YES | – | – | – | 42.47 | 36±2 | 0.08 |
| CALYMHA-S16-375 | 02: 17: 45.22 | −05: 01: 52.0 | YES | – | – | – | 42.47 | 19±1 | 0.43 |
ap.s.: point source.
bNot applicable, there is no coverage in that respective band.
