


ABSTRACT
Globally, human rhinoviruses/enteroviruses (HRVs/ENTs), indistinguishable on many widely available molecular platforms, are among the leading causes of the common cold. Geographic and climatic factors impact the peak activity of these viruses. In temperate climates, the peak activity of HRV occurs during autumn and spring whereas that of ENT occurs during autumn and summer. Both viruses are thought to peak during the rainy season in tropical climates like Hawai’i; however, data remain limited. We describe HRV/ENT seasonality and evaluate the climatic factors associated with peak activity among respiratory viral samples processed on Oahu, Hawai’i.
We conducted a retrospective analysis of all respiratory specimens submitted to Tripler Army Medical Center for multiplex polymerase chain reaction testing between May 2016 and May 2019. Among HRV/ENT-positive samples, we recorded the month and year of positivity. Summative monthly positive detection was calculated with peak months above the mean. Associations between temperature, precipitation levels, relative humidity, and wind speed by week and the number of positive samples for HRV/ENT were evaluated using Poisson regression. This analysis was conducted via IRB exempt protocol number 19R18.
During our study period, there were 7,143 nasopharyngeal respiratory samples sent for multiplex polymerase chain reaction testing, with 1,572 positive for HRV/ENT (22%). Nineteen percent of respiratory samples positive for HRV/ENT were additionally positive for one or more respiratory pathogens. The majority of HRV/ENT-positive samples arose from children < 5 years of age (n = 959, 61%). Peak months were February, March, May, August, November, and December. After controlling for lagged count and year, average wind speed was the only climatic factor significantly associated with HRV/ENT sample positivity.
The peak monthly activity of HRV/ENT was similar to temperate climates with the exception of peak activity in February. Unlike other tropical climates, lower wind speed was associated with increased weekly HRV/ENT positivity and should be further explored as a transmission factor. Our study contributes to understanding the annual variability of HRV/ENT activity in tropical environments, which can inform clinician expectations regarding respiratory viral symptomatology in this region.
INTRODUCTION
Globally, acute respiratory infections are a leading cause of morbidity and mortality in children.1 Human rhinovirus(es) (HRVs), the most frequent cause of upper respiratory infections, are associated with around 70% of acute asthma exacerbations in school-aged children.2 Enterovirus(es) (ENTs) are also common causes of infection and can present with symptoms of upper respiratory infection among children. Certain ENT infections can result in significant diseases including viral encephalitis, acute flaccid paralysis, or pericarditis.3 HRV/ENT, both of the Picornaviridae family and Enterovirus genus, are indistinguishable on commonly available molecular platforms.4
Climatic and geographic factors influence the transmission of respiratory viral pathogens including HRV/ENT. In temperate climates, HRVs are found year-round with peak infections observed in autumn and spring.2 ENT infections generally occur in summer and autumn.3 These non-enveloped viruses are transmitted through direct contact, a fomite, or respiratory droplets; therefore, climatic factors can influence viral behavior by affecting host resistance to infection, viral survival outside the body, and changes in human behavior such as spending more time indoors or congregating with others.5
The understanding of respiratory viral transmission dynamics, including seasonality and environmental factors for transmission, has risen to key importance, especially in light of the global coronavirus disease 2019 pandemic.6 In tropical climates such as Hawai’i, the understanding of viral activity remains limited. The available literature suggests key differences in the dynamics of viral transmission observed in Oahu, Hawai’i, and those observed in temperate climates.7,8 In a previously published analysis, we observed the peak activity of respiratory syncytial virus from September to December among respiratory nasopharyngeal specimens collected from children at Tripler Army Medical Center (TAMC).9 This activity was notably earlier in autumn and for a shorter duration than observed in temperate climates. Importantly, our prior analysis did not present data on HRV/ENT because of changes in laboratory testing capabilities for these pathogens. The purpose of this study is to describe the seasonality of HRV/ENT and associated climatic factors with peak activity on Oahu.
METHODS
We conducted a retrospective analysis of respiratory specimens submitted to TAMC on Oahu, Hawai’i, for multiplex polymerase chain reaction (PCR) testing between May 2016 and May 2019 utilizing the electronic medical record. All clinical specimens submitted for testing were included in these analyses. Clinical specimens were ordered by licensed medical providers within the institution with ordering capabilities. Of note, there was no restriction to the ordering of the test.
Study Population
Tripler Army Medical Center is the largest U.S. military treatment facility in the Pacific Region with both inpatient and outpatient capabilities. The TAMC diagnostic laboratory processes specimens from military service members (Army, Navy, Air Force, Marine Corps, and Coast Guard), retirees, and veterans, as well as eligible family members, civilian employees, and U.S. Associated/Affiliated Pacific Islanders through the Pacific Island Health Care Project. From the electronic medical record, we collected the patient’s age, the date (month and year), and collection method of respiratory specimens.
Identification of HRV/ENT
The FilmArray Respiratory Panel (RVP—BioFire Diagnostics, Salt Lake City, UT) was implemented at TAMC in May 2016. This platform is a multiplex nucleic acid amplification test for qualitative detection of 20 viruses and bacteria.10 We included respiratory samples positive for HRV/ENT alone in addition to those simultaneously positive for HRV/ENT and other respiratory pathogens.
Daily Climatic Factors
We obtained daily climatic information from the National Weather Service using the Honolulu International Airport (latitude: 21.33°N, longitude: 157.94°W) (https://www.weather.gov/). The following climatic factors were assessed: Average wind speed, average temperature, weekly total precipitation, and average humidity.
Statistical Analysis
The outcome of interest was the seasonality of RVP positivity for HRV/ENT. Positive samples were aggregated by month across the years in order to determine seasonality. We calculated a summative monthly positive detection (PD) of HRV/ENT across the 3 years of data. Peak months were defined by a PD above the overall mean for HRV/ENT, which we calculated by dividing the total number of positive samples by total months over the 3-year span and by 12 for the aggregated average year. Poisson regression was used to evaluate associations between temperature, precipitation levels, relative humidity, and wind speed by week and the number of cases of HRV/ENT. Models were adjusted for year, month, and lagged weekly count. All analyses were performed using SAS statistical software version 9.4 (SAS Institute, Cary, NC).
RESULTS
Between May 2016 and May 2019, 7,143 respiratory samples were received for testing at TAMC, and 1,572 (22%) were positive for HRV/ENT. All other viral findings from this time period have been previously published in both children9 and active duty military personnel.11Table I describes the demographics of our population stratified by single infection with HRV/ENT vs. coinfection. The majority of positive samples arose from patients less than 18 years of age as follows: <1 year: n = 397 (25%), 1 to <6 years: n = 562 (36%), and 6 to <18 years: n = 130 (8%). Among all samples positive for HRV/ENT, 304 (19%) were positive for at least one other respiratory pathogen. The majority of such samples arose from children under 6 years of age (<1 year: n = 117 [38%], 1 to <6 years: n = 140 [46%]).
Characteristics of Respiratory Samples Positive for Human Rhinovirus/Enterovirus, Oahu, Hawai’i, 2016-2019
| Characteristic | Positive for HRV/ENT (all) | Positive for HRV/ENT only | Positive for HRV/ENT and other virus(es) |
|---|---|---|---|
| N | 1,572 | 1,268 | 304 |
| Age (years) | |||
| < 1 | 397 | 280 | 117 |
| 1-5 | 562 | 422 | 140 |
| 6-17 | 130 | 113 | 17 |
| 18-64 | 363 | 341 | 22 |
| ≥65 | 120 | 112 | 8 |
| Specimen type | |||
| Nasal swab | 4 | 3 | 1 |
| Nasal washing | 2 | 1 | 1 |
| Nasopharyngeal swab | 1,566 | 1,264 | 302 |
| Years | |||
| 2016 (May-December) | 402 | 304 | 98 |
| 2017 (January-December) | 531 | 424 | 107 |
| 2018 (January-December) | 429 | 369 | 60 |
| 2019 (January-May) | 210 | 171 | 39 |
The demographics of the study population as well as specimen type and year stratified by single infection with HRV/ENT vs. coinfection. Coinfections included respiratory syncytial virus, adenovirus, human parainfluenza viruses (serotypes 1-4), human metapneumovirus, and influenza A and B.
Abbreviations: HRV/ENT, human rhinovirus/enterovirus; PD, positive detection.
Figure 1 shows the seasonality of HRV/ENT among respiratory samples positive for HRV/ENT. Panel A demonstrates the monthly detection of HRV/ENT across 3 years with a mean PD of 42. Panel B combines months to simulate an average year with an aggregate monthly mean peak detection of 131. Over the 3-year span, we observed major peaks from June to October 2016 and November to December 2017, as well as smaller peaks in December 2016, March 2017, February 2018, May 2018, and February to March 2019. These peaks correlated well with the peak detection months of Panel B (February [n = 133], March [n = 142], May [n = 158], August [n = 150], November [n = 132], and December [n = 154]). Only March was consistently a peak month across all the years.

Seasonality of HRV/ENT with PD rates. (A) Monthly detection of HRV/ENT across all 3 years by month. (B) Monthly aggregated detection of HRV/ENT.
The association between climatic factors and HRV/ENT detection in relation to the rainy and windy seasons on Oahu is described in Figure 2. Regression analysis showed that during weeks with low average wind speed (<7 mph), the counts for HRV/ENT were 20% higher (incidence rate ratio [IRR] = 1.20 [95% CI, 1.03-1.40]; P = .02). Average temperature less than 74°F (IRR = 1.16 [95% CI, 0.97-1.39]; P < .10]), weekly total precipitation (IRR = 1.09 [95% CI, 0.95-1.26]; P < 0.23), and average humidity (IRR = 1.14 [95% CI: 0.92-1.40]; P < .23) did not have a significant association with HRV/ENT activity.
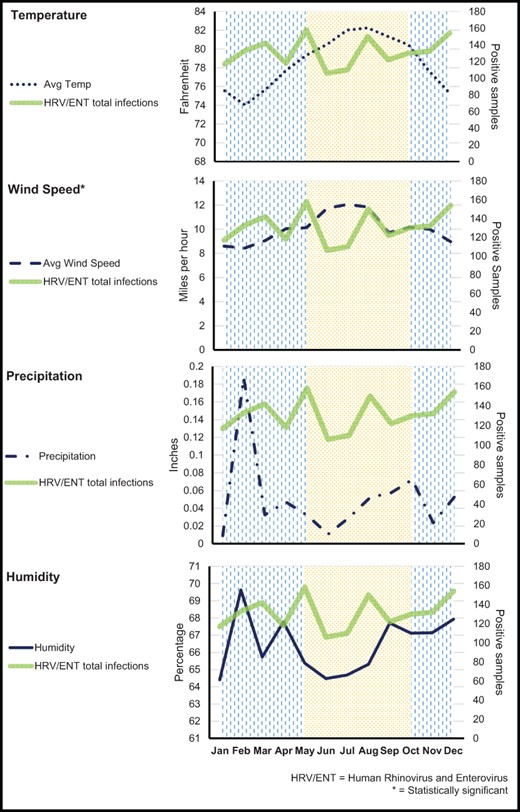
Average monthly variability of HRV/ENT in relation to temperature, wind speed, precipitation, and humidity. The background of vertical lines denotes the rainy season, and the dotted background denotes the windy season. The asterisk indicates a significant association between the climatic factor and HRV/ENT positivity. Data are presented by month in this figure for ease of graphical representation. Statistical analyses were performed on weekly counts as described in the Methods section.
DISCUSSION
This retrospective analysis of HRV/ENT seasonality and associated factors demonstrated peak viral activity across all seasons. The age-stratified analysis showed that HRV/ENT had a propensity to infect younger children with about 61% of patients being <6 years old, consistent with other published studies.4 Our findings are generally consistent with the seasonality of HRV/ENT described in temperate areas within the CONUS,2 except a peak of HRV/ENT in February, the only full winter peak month. The aggregate peak in February may be influenced by the increased positive rates of February in 2018 or potentially reflect changes in viral transmission during times of increased tourism on the island, which occurs during the winter months.12 Future studies should include peak tourism as a factor that could impact respiratory viral activity on Oahu. The aggregated peak in August could be related to the onset of the school term, which has been noted in previous studies.13 Another important consideration is that our study evaluated Military Health System beneficiaries, a population that moves on and off island throughout the year. This dynamic could facilitate transmission of HRV/ENT in a way that mirrors the temperate CONUS. However, since our previous analysis of other respiratory pathogens among this population uncovered differences in peak viral detection, we expect our observations to reflect the peak viral activity on Oahu.
Data on tropical climates with comparable environments to Hawai’i are lacking. The viral seasonality of multiple tropical countries was studied, whereas none of them were subtropical islands with rainy and windy seasons. Notably, there still was some similarity, with HRV/ENT being present year-round. Peak months varied from our data depending on the country, with seasonal patterns more in line with non-island tropical climates.7 Overall, the seasonality of HRV/ENT in Oahu is more in alignment with temperate climates compared to other tropical climates.
Interestingly, we found that lower wind speed was associated with increased infections. This result differs from a study with over 20,000 samples and 2,807 cases of HRV in Sweden, which found a positive correlation between wind speed and incidence of HRV.14 We hypothesize that our findings are plausible since, for non-enveloped viruses such as HRV/ENT, transmission occurs mainly through direct contact or a fomite, with virus particles surviving on surfaces for several hours.4 Outside of wind speed, no other climatic factors were associated with HRV/ENT activity, contrasting previous analyses15–17 demonstrating associations of precipitation, temperature, dew point, and humidity with respiratory viral activity, for unclear reasons, which could provide opportunities for further investigation.
We acknowledge strengths and limitations of our study. We present an analysis with a robust sample size over a 3-year time period, which provides a useful picture of HRV/ENT activity. Additionally, we deliver new information on a previously understudied and important subject. Although we expect that we were able to capture all positive samples of HRV/ENT performed at the TAMC laboratory through our data capture approach, it is possible that cases were missed in this analysis. Other cases that may have been missed include those patients who did not seek care for their illness since this was a convenience sample of medically attended upper respiratory infections. Even though the weather varies across Oahu, the weather data at the airport make a useful approximation as an overall trend in climate. Minimal demographic information outside of age was available for review preventing further understanding of demographic factors impacting HRV/ENT positivity. Additionally, it is plausible that viral testing via PCR varied on a monthly basis as a result of respiratory viral seasons. Such variation could account for differences in peak detection of HRV/ENT by month. We were unable to further explore the impact of overall viral testing rates on the observed peak detection rate of HRV/ENT given the nature of data aggregation for this analysis. Finally, we were unable to distinguish HRV from ENT which limits the ability to identify distinct seasonality for the two viruses as well as the differential impact of the various climate factors on one virus over the other. However, many hospitals currently utilize similar PCR platforms which make these results more generalizable.
CONCLUSION
We evaluated seasonality and associated climatic factors of HRV/ENT peak detection on Oahu, Hawai’i, over a 3-year period and showed that the only climatic factor associated with increased positivity rates was lower wind speed, unlike many previous studies in temperate regions and the limited data from comparable tropical regions. Notably, the seasonality of HRV/ENT was more like that of temperate climates and less like that of similar tropical climates. Our data add to the viral activity information in this region by helping to set a baseline. By understanding and monitoring viral seasonality, we can continue to enforce and improve upon mitigation measures both here in Oahu and in similar environments to improve public health.
ACKNOWLEDGMENTS
None declared.
FUNDING
None declared.
CONFLICT OF INTEREST STATEMENT
None declared.
DATA AVAILABILITY
The U.S. Department of the Army and the study investigators are committed to safeguarding the privacy of all military service members and their families. The study investigators have implemented measures to ensure participant anonymity is maintained in all reporting of research data. This allows for the publication of aggregate data only and specifically prohibits the publication or distribution of individual-level data. Distribution of de-identified participant-level data and accompanying research resources will require compliance with all applicable U.S. Department of the Army regulatory and ethical processes. Requests for these materials can be made to the TAMC Department of Clinical Investigation via Dr Zakariae Bram, PhD; Phone 808-433-6476; [email protected].
CLINICAL TRIAL REGISTRATION
Not applicable.
INSTITUTIONAL REVIEW BOARD (HUMAN SUBJECTS)
This study was conducted via IRB exempt protocol number 19R18.
INSTITUTIONAL ANIMAL CARE AND USE COMMITTEE (IACUC)
Not applicable.
INSTITUTIONAL CLEARANCE
Institutional clearance approved.
REFERENCES
Author notes
Academic Pediatric Association, Pediatric Academic Societies Meeting, Denver, CO, April 2022.
The views expressed in this manuscript are those of the author(s) and do not reflect the official policy or position of the Department of the Army, DoD, or the U.S. Government.

