


ABSTRACT
Phase angle (PhA) determined by bioelectrical impedance (BIA) is related to body fluid balance and cell membrane integrity. Handgrip strength (HGS) is used to assess muscle strength and as an indicator of health. We aimed to determine the relationship between PhA and HGS in healthy young males and to verify whether this relationship is dependent on body components.
Hundred and sixty-three healthy male army cadets (18.8 ± 0.6 years old) participated in the study. PhA was determined by BIA, HGS was assessed by a hydraulic dynamometer, and dual-energy X-ray absorptiometry determined: fat mass (FM), bone mineral content (BMC), and lean soft tissue (LST). Participants were divided according to the PhA tertile (first tertile: PhA < 7.14°, second tertile: 7.14° ≤ PhA < 7.83°, and third tertile: PhA ≥ 7.83°).
Youth from the first tertile of PhA had lower BMC (2.8 kg vs. 3.0 kg and vs. 3.1 kg) and LST (51.7 vs. 53.8 kg and vs. 57.6 kg) compared to youth from the second and third tertile of PhA (P < .001), respectively. Additionally, lower HGS (83.0 kg vs. 93.1 kg) was found in the first tertile compared to the third tertile of PhA (P < .001). PhA explained 3% of the HGS variation (R2 = 0.029), while LST and BMC explained 39% (R2 = 0.385) and 22% (R2 = 0.221), respectively. Furthermore, the correlation between PhA and HGS was dependent on LST (P = .567) and BMC (P = .182).
In this sample, PhA showed a small relationship with HGS, remaining dependent on BMC and LST values. These results reinforce the importance of maintaining a physically active lifestyle with great lean mass and muscle strength values.
INTRODUCTION
Muscle strength is an essential component of physical fitness.1 The handgrip strength (HGS) test assesses muscle strength and performance in populations of different ages and health conditions.2–4 Previous studies indicate that low or decreased values of muscle strength are associated with the risk of cardiovascular disease and cancer,5 increased length of hospital stay,6 and mortality risk in men and women.5,7,8 On the other hand, high muscle strength values are associated with a greater quantity of muscle mass in the elderly,9,10 good physical fitness in children and adolescents,11,12 and better physical performance in military populations.13,14
The phase angle (PhA) determined by the bioelectrical impedance is an index obtained through the ratio of resistance and reactance15 and is used as a healthy marker in several diseases.16,17 High values of PhA (>6°) indicate better fluid balance and better cell membrane integrity18; thus, it can be used to monitor body cell mass.19 Previous studies report a positive association between PhA and HGS in patients with various diseases states and clinical conditions2,3,20–22 and among older adults and women.23 Accordingly, it indicates the use of both parameters (PhA and HGS) as a functional clinical predictor related to diseases.
In the military population, good muscle strength and body composition levels are crucial to performing successfully in many military activities and health.24–26 Previous studies show an increase of 7.1% in the HGS and a decrease of 1.5% in the percentage of fat mass (FM) in navy cadets who engaged in a physical training program27 and an increase of 1.6 and 2.1 kg in the HGS and fat-free mass, respectively, among marines during a combat operation.13 These studies indicate that the quantity of muscle mass displays a determining physiological characteristic for this population.27 Muscle strength depends on different physiological and metabolic factors (i.e., the energy substrate, recruitment, and types of fibers). The quantity of muscle mass is one of the essential physiological components of the muscle’s capacity to produce force.28 HGS is associated with PhA (r = 0.58) in healthy men aged from 20 to 40 years29; however, it is not known whether body composition parameters may have determined this relationship.
Therefore, this study aims to determine the relationship between PhA and HGS in healthy male army cadets aged 18 and 22 years and to verify whether this relationship depends on body components. We hypothesized that healthy male army cadets with high PhA values have a higher HGS value when compared to young men with lower PhA values; in addition, this relationship is influenced by the quantity of lean mass.
METHODS
Participants
Study participants were young male army cadets who entered in the “Preparatory School of Army Cadets” (EsPCEx) of Campinas-SP, Brazil. Before enrolling in EsPCEx, candidates undergo a process proving their ability to efficiently carry out the proposed military activities, thus indicating that they are fit and healthy. This process consists of 3 phases: (1) an intellectual test, (2) a medical inspection (applicants must send a report of several medical examinations: exercise tests, complete blood count, an electroencephalogram, a chest and skull X-ray, and an authorization letter signed by the responsible physician), and (3) a physical test (which includes exercises of muscular strength, endurance, and aerobic fitness) performed at EsPCEx. Five hundred students who entered at EsPCEx were invited to participate in the study; however, only 369 students volunteered to participate. During the data collection period, 186 participants did not show up on the assessment day (e.g., by work schedule) or returned the signed informed consent form, and 20 participants did not complete all evaluations. Therefore, the final sample consisted of 163 healthy young male army cadets aged between 18 and 22 years.
Study Design and Ethics
This is a cross-sectional study in which all measurements were performed on the same morning day at the university facilities. All participants were informed about their research participation procedures, agreed to participate, and signed the informed consent form. Participants were instructed to remove all objects containing metal (e.g., bracelets, watches, rings, etc.) before the evaluations; they wore light clothes (shirt and shorts) and were barefoot. The Ethics Committee of the School of Medical Sciences at the University of Campinas approved the research. All procedures were conducted following the Declaration of Helsinki.
Anthropometry
Total body weight (kilograms) was measured using a digital scale with a precision of 0.1 kg, and height (centimeters) was measured using a vertical stadiometer with a precision of 0.1 cm following the recommended protocols.30 Body mass index (BMI, kg/m2) was calculated.
Bioelectrical Impedance Analysis
The assessment of bioelectrical impedance analysis (BIA) parameters was carried out according to the literature’s instructions.31 BIA parameters were taken by tetrapolar and uni-frequency (50 kHz) equipment (Quantum II, RJL Systems, Detroit, Michigan) and provided the values of resistance (R) and reactance (Xc) in Ohms (Ω). Participants were instructed to remove all objects containing metal before the BIA measurement was taken. Participants were laid barefoot, in a supine position, with the legs abducted at a 45° angle, arms far from the trunk, and hands pronated on a table isolated from electrical conductors. After 5 minutes of resting, the skin of the participants was cleaned with alcohol, and 2 electrodes were placed on the surface of the right hand and 2 others on the surface of the right foot, according to the recommended protocol. The evaluation lasted about 1 minute. Afterward, the PhA value in degrees was calculated (°) [PhA = arc-tangent(Xc/R) × (180°/3.14)].15
Handgrip Strenght
HGS was evaluated using a hydraulic dynamometer (Jamar, Sammons Preston, Inc., Bolingbrook, IL, EUA). The HGS protocol was carried out with participants standing, arms relaxed and alongside the body, forearm in a neutral position, and foot apart.32 Three maximal performances were measured for both arms with 3 seconds of contraction duration and a 1-minute rest interval between each test. The participant was instructed to start and to stop the contractions; no other verbal encouragement was given. The highest value of each arm was recorded (HGSRight and HGSLeft).33 The sum of the 2 arms was considered for the statistical analysis (HGS = HGSRight + HGSLeft).
Dual-energy X-ray Absorptiometry
An iDXA (GE Healthcare Lunar, Madison, WI, USA) version 13.6 determined the whole-body measurement of FM, bone mineral content (BMC), and lean soft tissue (LST) in kilograms. During the evaluation (for approximately 5 minutes), participants were dressed in light clothes, barefoot, and without the presence of any metal on their clothing. All measurements and calibration were performed according to the manufacturer’s instructions.
Statistical Analysis
Descriptive statistics mean and standard deviation were used to characterize the sample participants. Variables that did not show normal distribution were adjusted using the logarithm 10 (age, BMI, PhA, HGS, and FM). Pearson’s correlation was used to verify the association between PhA, HGS, and body components (FM, BMC, and LST). Analysis of variance with Bonferroni’s posthoc test was used to compare variables of interest among the groups according to the PhA tertile (first tertile vs. second tertile, first tertile vs. third tertile, and second tertile vs. third tertile). When necessary, additional adjustment for a covariate (height) was included in the model. Partial correlation was used to verify the association between PhA and HGS controlled by each body component (FM, BMC, and LST). Multiple linear regression analysis was used to verify the influence of PhA value and body components on HGS. We considered P-value <.05 statistically significant. Analyses were performed using SPSS 21.0.
RESULTS
Table I presents the descriptive characteristics and estimated values of BIA parameters, body components, and HGS of the study participants by PhA tertile (first tertile: PhA < 7.14°, second tertile: 7.14° ≤ PhA < 7.83°, and third tertile: PhA ≥ 7.83°). Since a significant difference was observed in height, comparisons between BIA, body components, and HGS variables among the participants were adjusted according to height (height = 175.6 cm).
Descriptive Characteristics and Estimated Values of BIA Parameters, Body Components, and HGS according to the PhA Tertile
| Variables | First tertile (n = 54) | Second tertile (n = 55) | Third tertile (n = 54) | F | P-value |
|---|---|---|---|---|---|
| Mean (95% CI) | Mean (95% CI) | Mean (95% CI) | |||
| Age (years) | 18.8 (18.0–20.1) | 18. 8 (18.0–21.9) | 18.9 (18.0–19.8) | 0.360 | .698 |
| Weight (kg) | 67.8 (45.0–83.3) | 68.4 (50.9–99.4) | 70.9 (57.0–94.8) | 1.815 | .166 |
| Height (cm) | 178.2 (162.2–192.7)*,** | 174.6 (159.6–190.8) | 174.0 (162.6–186.0) | 6.954 | .001 |
| BMI (kg/m2) | 21.4 (16.0–26.5)*,** | 22.4 (18.6–32.3) | 23.4 (19.7–29.7) | 10.610 | <.001 |
| R (Ω)a | 485.3 (474.3–496.3)** | 473.1 (462.5–483.8)** | 438.2 (427.4–449.0) | 19.480 | <.001 |
| Xc (Ω)a | 56.4 (54.8–57.9)*,** | 61.7 (60.2–63.2) | 63.6 (62.1–65.1) | 22.150 | <.001 |
| PhA (°)a | 6.6 (6.5–6.7)*,** | 7.4 (7.3–7.6)** | 8.3 (8.2–8.4) | 196.603 | <.001 |
| FM (kg)a | 11.3 (10.3–12.4) | 12.8 (11.7–13.8) | 11.9 (10.9–12.9) | 1.840 | .162 |
| BMC (kg)a | 2.8 (2.7–2.9)*,** | 3.0 (2.9–3.1)** | 3.1 (3.1–3.2) | 15.236 | <.001 |
| LST (kg)a | 51.7 (50.5–52.9)*,** | 53.8 (52.6–54.9)** | 57.6 (56.4–58.8) | 23.548 | <.001 |
| HGS (kg)a | 83.0 (78.9–87.1)** | 83.0 (79.0–87.0)** | 93.1 (89.1–97.1) | 8.067 | <.001 |
Abbreviations: BMI: Body Mass Index; R: Resistance; Xc: Reactance; PhA: Phase angle; FM: Fat mass; BMC: Bone mineral content; LST: Lean soft tissue; HGS: Handgrip strength. 95% CI: Confidence interval.
: Adjusted for height.
Bold values indicate statistically significant (*: vs. second tertile of PhA and **: vs. third tertile of PhA).
The PhA mean was significantly different between tertile groups of PhA, in which healthy young male army cadets classified in the first PhA tertile had a lower PhA value than those from the second and third tertile of PhA (P < .001). Healthy young male army cadets classified in the first tertile of PhA were taller and had lower BMI, Xc, BMC, and LST than those from the second and third tertile of PhA (P < .001). In addition, healthy young male army cadets classified in the first tertile of PhA had higher R value and lower HGS when compared to those from the third tertile of PhA (P < .001). Finally, healthy young male army cadets classified in the second tertile of PhA had higher R value and lower value for BMC, LST, and HGS when compared to their peers in the third tertile of PhA (P < .001).
A positive association was observed between HGS and PhA (r = 0.235, P = .002) and between HGS and body components [FM (r = 0.209, P = .007), BMC (r = 0.505, P < .001), and LST (r = 0.632, P < .001)] in our sample (Fig. 1).
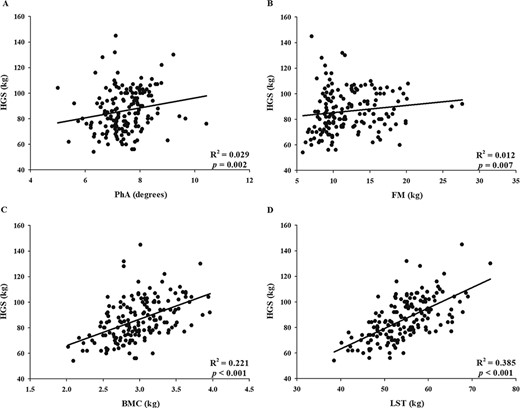
Association between handgrip strength (HGS) and (A) phase angle (PhA), (B) fat mass (FM), (C) bone mineral content (BMC), and (D) lean soft tissue (LST).
Multiple linear regression analysis showed that, despite being a small association, the PhA explained 3% of the variation in HGS (β = 0.186; P = .017) while LST explained 39% (β = 0.623; P < .001) and BMC explained 22% (β = 0.475; P < .001) the variation in HGS. No significant association between HGS and PhA was found when controlled by the BMC (r = 0.105, P = .182) neither by the LST (r = 0.045, P = .567) (Table II).
Partial Correlation between Handgrip Strength and Phase Angle
| Controlled variables | PhA | ||
|---|---|---|---|
| R | P | ||
| HGS | FM | 0.184 | .019 |
| BMC | 0.105 | .182 | |
| LST | 0.045 | .567 | |
| Controlled variables | PhA | ||
|---|---|---|---|
| R | P | ||
| HGS | FM | 0.184 | .019 |
| BMC | 0.105 | .182 | |
| LST | 0.045 | .567 | |
Abbreviations: FM: Fat mass; BMC: Bone mineral content; LST: Lean soft tissue. Values in bold represent statistically significant.
DISCUSSION
This study aimed to determine the relationship between PhA and HGS in healthy young male army cadets. Although PhA has a significant positive association with HGS, its contribution was small in the HGS variation (3%). Furthermore, the reported small association between HGS and PhA (r = 0.24) differs from the findings of previous studies. They reported a stronger association between HGS and PhA among different populations, such as in kidney transplantation patients (r = 0.32),3 in patients with chronic obstructive pulmonary disease of both sexes (men: R2 = 0.34 and women: R2 = 0.40),20 in hospitalized patients for different diseases (r = 0.54),21 and healthy adult men (r = 0.58).29 Moreover, when partial correlation was used, there was no significant association between HGS and PhA, suggesting that this association is dependent on the quantity of LST and BMC and independent of the amount of FM in healthy young male army cadets.
In our sample, the LST was the body component that presented the most significant contribution in HGS variation (39%, P < .001). Previous studies have reported that low HGS values are associated with significant loss of muscle mass with the advancing age in adults of both sexes.34 On the other hand, a study carried out with male and female military personnel reported that better levels of physical fitness are associated with a higher quantity of muscle mass,24 indicating that the amount of muscle mass is a determining characteristic for this population.
The PhA is used as a prognostic marker of body fluid balance between intracellular and extracellular water, cell membrane integrity, and, consequently, muscle mass (since approximately 73% of body water is present in muscle mass).15 Participants in this study were considered as healthy participants (taking into account their inclusion criteria), and they belonged to a homogeneous sample: considering their age (18.8 ± 0.6 years) and their amount of muscle mass (54.4 ± 6.4 kg). It is speculated that since they present a more significant amount of muscle mass (compared to other studies), this may be a factor that influenced the weak relationship between PhA and HGS34; in particular, among the groups in which participants in the third tertile (highest PhA value) had higher HGS and LST when compared to the reference group (participants in the first tertile, lower PhA value). These results indicate that PhA and HGS are more related to LST in healthy young male army cadets.
The PhA is calculated by the ratio between R and Xc determined by the BIA (at 50 kHz), where the R value depends on the content of fluids and electrolytes present in body water, while the Xc value depends on the charge storage of cell membranes that act as imperfect capacitors;35 therefore, the better the body hydration, the lower the R value.31 We found that the healthy young male army cadets who were in the first tertile of PhA (<7.14°) had higher R, lower LST, and lower HGS values (Table I) when compared with the young men who were in the third tertile of PhA (≥7.83°), indicating that the participants from the first tertile of PhA had less body water compared to those in the third tertile of PhA. However, the mechanism that explains the association between PhA and HGS is not clear. Since PhA is a predictor of cell mass, participants with lower PhA values tend to have less body water and greater cell damage, which may, thus, compromise muscle strength.29,36
It is important to point some limitations of this study. First, our results are targeted at healthy young male army cadets. Furthermore, given the study’s cross-sectional nature, a causal–effect relationship between PhA and HGS cannot be established. This study also has strengths that should be emphasized. First, upper limb muscle strength assessment was performed using HGS as this has been considered an indicator of global strength. In addition, HGS is an accurate and reproducible measure; it can be used both inside and outside the laboratory environment, it was used in several studies, and it facilitates the evaluation of a large number of individuals in a short period.12,32,37 Second, the sample in this study was comprised of healthy participants; as mentioned above, the admission process for army cadets is entirely standardized and controlled, which, to our knowledge, was not found in a previous study. Finally, the lean mass assessment was determined using dual-energy X-ray absorptiometry, as previous studies used BIA or skinfold equations to estimate lean mass.
CONCLUSION
Although the phase angle shows a relationship with muscle strength, this association depends on the quantity of lean tissue in healthy male army cadets. In this sense, the use of phase angle might be of particular interest to monitor performance status in healthy individuals and the general population. Thus, these results reinforce the importance of maintaining a physically active lifestyle to maintain adequate levels of lean mass and muscle strength throughout life.
ACKNOWLEDGMENTS
The authors especially acknowledge all the officers and the cadets of the “Preparatory School of Army Cadets” (EsPCEx) of Campinas-SP for their authorization and collaboration in this study. The authors are grateful for the exceptional contributions from the Editor Anthony LaPorta and the unknown reviewers to improve the quality of the manuscript.
FUNDING
This study was funded by the Coordination for the Improvement of Higher Education Personnel—CAPES (Process No. 23001.000422/98-30). The funders had no role in the study design, collection, analysis, and interpretation of data, writing of the paper, or decision to submit for publication. All authors were independent of the funding agency.
CONFLICT OF INTEREST STATEMENT
None declared.

