


ABSTRACT
The high prevalence of patellofemoral pain in military service members results in strength loss, pain, and functional limitations during required physical performance tasks. Knee pain is often the limiting factor during high-intensity exercise for strengthening and functional improvement, thus limiting certain therapies. Blood flow restriction (BFR) improves muscle strength when combined with resistance or aerobic exercise and may serve as a possible alternative to high-intensity training during recovery. In our previous work, we showed that Neuromuscular electrical stimulation (NMES) improves pain, strength, and function in patellofemoral pain syndrome (PFPS), which led us to ask whether the addition of BFR to NMES would result in further improvements. This randomized controlled trial compared knee and hip muscle strength, pain, and physical performance of service members with PFPS who received BFR-NMES (80% limb occlusion pressure [LOP]) or BFR-NMES set at 20 mmHg (active control/sham) over 9 weeks.
This randomized controlled trial randomly assigned 84 service members with PFPS to one of the two intervention groups. In-clinic BFR-NMES was performed two times per week, while at-home NMES with exercise and at-home exercise alone were performed on alternating days and omitted on in-clinic days. The outcome measures included strength testing of knee extensor/flexor and hip posterolateral stabilizers, 30-second chair stand, forward step-down, timed stair climb, and 6-minute walk.
Improvement was observed in knee extensor (treated limb, P < .001) and hip strength (treated hip, P = .007) but not flexor over 9 weeks of treatment; however, there was no difference between high BFR (80% LOP) and BFR-sham. Physical performance and pain measures showed similar improvements over time with no differences between groups. In analyzing the relationship between the number of BFR-NMES sessions and the primary outcomes, we found significant relationships with improvements in treated knee extensor strength (0.87 kg/session, P < .0001), treated hip strength (0.23 kg/session, P = .04), and pain (−0.11/session, P < .0001). A similar set of relationships was observed for the time of NMES usage for treated knee extensor strength (0.02/min, P < .0001) and pain (−0.002/min, P = .002).
NMES strength training offers moderate improvements in strength, pain, and performance; however, BFR did not provide an additive effect to NMES plus exercise. Improvements were positively related to the number of BFR-NMES treatments and NMES usage.
INTRODUCTION
Knee injuries are common in U.S. Military personnel. These injuries cause knee pain, reduced movement, and deconditioning of quadriceps muscles and affect physical performance of military duties. Patellofemoral pain syndrome (PFPS) is a common cause of knee pain,1 with a prevalence of 13.5% in the U.S. Military.2 Patellofemoral pain syndrome is characterized by diffuse anterior knee pain that intensifies during activities that load the knee during flexion, such as running, squatting, and stair ascent/descent.3 Overuse injuries,4 training errors,5 and imbalances in hip and quadriceps muscle strength6 are associated with PFPS, reflecting the military’s high operating tempo, frequent deployments, and demanding training.
In rehabilitation, knee pain is frequently the limiting factor during recommended high-intensity resistance exercises for strength improvements. Literature suggests that blood flow restriction (BFR) combined with less-intense resistance or aerobically based exercise promotes changes in muscle strengthening and size.7 These studies use a wide array of BFR training methodologies with one consistent view, i.e., that pairing BFR with an exercise is critical for optimal effects.
Blood flow restriction in knee pain rehabilitation involves application of a restrictive cuff to the exercising thigh, reducing arterial and venous blood flow to increase muscle strength and hypertrophy. During low-intensity exercise, BFR limits the oxygen supply to working muscles, shifting from slow-twitch oxidative fibers to fast-twitch anaerobic fibers, generating intramuscular lactate. Accumulated effects of fatigue, mechanical tension, metabolic stress, and reactive hyperemia promote muscle adaptation with minimal strain.8 Thus, BFR allows those with PFPS to train at reduced intensity while receiving training benefits similar to those obtained from high-intensity workloads.
Non-pharmaceutical home therapies for knee pain and PFPS, including neuromuscular electrical stimulation (NMES) and exercise, vary in effectiveness. We showed that home use of NMES as a passive electrotherapy utilized during active exercise reduced pain and improved quadriceps muscle strength in knee injuries9 and PFPS,10 compared to exercise alone. Others compared low-load BFR in those with PFPS with and without standard quadriceps strengthening and observed significant increases in muscle strength with greater pain reduction.11 Blood flow restriction training is effective in quadriceps strengthening for those that cannot tolerate heavy resistance training, e.g., individuals with patellofemoral pain. The addition of hip and knee exercises to BFR was as effective as usual hip/knee exercises alone in improving pain symptoms and strength, with greater isometric strength gains by the knee extensors after treatment.12
The high prevalence of PFPS in active duty personnel suggested that perhaps BFR plus NMES might lead to better improvement than NMES alone. This randomized controlled trial (RCT) compared quadriceps and posterolateral hip strength, pain, and physical performance of active duty service members with PFPS who received BFR-NMES (80% limb occlusions pressure [LOP]) and BFR-NMES set at 20 mmHg, which does not occlude arterial or venous blood flow and serves as an active control. Our central hypothesis was that BFR-NMES (80% LOP) strength training of the injured leg would result in significantly greater improvements than BFR-NMES set at 20 mmHg (BFR-sham).
METHODS
Design and Setting
This clinical trial was a two-group intent-to-treat RCT of active duty military personnel with PFPS recruited from the Blanchfield Army Community Hospital (Fort Campbell, KY) physical therapy department from August 2020 to February 2022. See Supplementary Table S1 for eligibility criteria.
Randomization
Participants were grouped using blocked randomization with a permuted block sequence of four numbers via a computer-generated random number table. Our statistician managed the computer-generated allocation sequence. Group assignments were concealed from study staff and participants until after consent and baseline testing. Each participant opened the next envelope in a prenumbered series of sealed envelopes containing allocation assignment. Blinding of participants or staff after baseline determination was not feasible because of the nature of this treatment-based study.
Interventions
The two self-managed treatment interventions for PFPS were (1) NMES exercise supplemented with high BFR 80% LOP and (2) NMES exercise with low percentage of BFR LOP at 20 mmHg (BFR-sham). The in-clinic BFR-NMES was performed two times per week, while the at-home NMES with exercise and at-home exercise alone were performed on alternating days and omitted on in-clinic days. Sessions totaled 62 with 31 exercise-only at-home sessions, 18 in-clinic sessions of combined NMES/exercise/BFR, and 13 at-home sessions of NMES/exercise. The NMES garment and BFR cuff were placed on the PFPS/injured leg. If both legs were involved, the leg with the most pain received the intervention.
Active exercise
During the baseline visit, participants were provided with an exercise handout and viewed a demonstration of daily exercise. Exercises were performed during visits to assure proper form and performance. The sequence of exercises began with stretching the quadriceps and hamstring and then a combination of open and closed chain exercises including active straight leg raises, quadriceps straightening, step-up, and squats. These exercises were designed to coincide with the timing and intensity of the NMES and BFR devices and were performed alone (at home), jointly with NMES (at home), and during in-clinic BFR-NMES therapy. The participant performed 30 repetitions of the exercise at a 4.5-second cadence, 15-second rest, 15 repetitions at the same cadence, 15-second rest, and a final 15 repetitions.13
NMES
Both groups received a portable battery-operated Kneehab® XP (Theragen Inc./Neurotech®, Manassas, VA) device with controller, conductive thigh garment, battery charger, and four self-adhering reusable hydrogel electrodes (Theragen Inc./Neurotech®, Manassas, VA). Before starting each exercise session, the conductive garment was wrapped around the injured thigh to provide consistent placement of the four electrodes over the quadriceps (vastus medialis, intermedius and lateralis, and rectus femoris) muscles.
The NMES device delivered a preset program using a symmetrical square biphasic waveform with an output current ranging from 0 to 70 mA. Parameters for the work cycle were variable pulse duration of 300-400 μs; ramp time of 1.0:0.50 seconds; frequency of 50 Hz; contraction time of 5-second on; and relaxation time of 10-second off.14 The total cycle length was 16.5 seconds, which provided a total on time of 6.06 minutes during each 20-minute session. There were 1-minute pauses between each exercise to position the participant for the next exercise and to minimize fatigue.
The Kneehab® XP device generates coordinated muscle contractions using a patented stimulation system called “Multipath.” This approach involves changing the current pathways between the electrodes for preset periods within each pulse, allowing multiple pathways through which the stimulation current flowed. This method, compared to conventional NMES, allows higher stimulation intensities to maximize muscle fiber recruitment and thereby produce stronger muscle contractions, while minimizing muscle fatigue with lessened discomfort during the treatment session.15
Training intensity.
The NMES protocol consisted of 20 minutes of NMES stimulation while concurrently performing the active exercises. To ensure consistent interventions across participants, stimulation intensity was a calculated percentage of maximal voluntary contraction (% MVC) using strength results. Participants trained at 20-30% MVC during weeks 1-3, 31-40% MVC weeks 3-6, and 41-50% MVC weeks 6-9. Changes were made at the 3- and 6-week clinic visits with individualized instructions for adjusting the amplitude dial settings and a return demonstration to maintain the appropriate % MVC. Participants used daily email logs to record date, duration, amplitude achieved, and pain levels. The first 5 minutes of each study visit trained study staff reviewed training logs, examined NMES goals attainment, and discussed solutions for any problems.
High BFR LOP (80% LOP)
A Delfi’s Personalized Tourniquet System (Owens Recovery Science, San Antonio, TX) was used for BFR. Participants in the high LOP group underwent four times 5-minute cuff inflations at 80% LOP separated by 1 minute of rest while simultaneously performing the NMES and exercises as mentioned earlier.
The BFR-NMES training consisted of 20-minute sessions performed twice a week for a total of 18 in-clinic sessions. For each exercise, BFR was inflated to 80% LOP, NMES was started, the exercise was performed, and the BFR cuff was deflated and NMES paused for 1 minute. This was repeated for each of the exercises. If proper form could not be maintained, the exercise set was terminated to the 1-minute rest and the number of repetitions was recorded. The total inflation time for the entire BFR-NMES session was 20 minutes with 1 minute of deflation every 5 minute between exercises.
Low BFR LOP (20 mmHg)
Participants in the low LOP group underwent the same program as mentioned earlier, with the BFR inflated to 20 mmHg and exercises being performed during cuff inflation. Through protocol testing, we found that 20 mmHg cuff inflation was the minimum occlusion pressure needed to keep the cuff from slipping down during the performance of these exercises. This resulted in exercising with no restriction to muscle blood flow (sham BFR treatment).
Adherence to Treatment
Adherence was measured by participant completion of daily email logs, data from the NMES devices internal compliance monitor, and the total number of in-clinic sessions attended. The Kneehab XP registered the total treatment time during usage. Compliance checks and visit reminders occurred via telephone calls, emails, and/or text messages.
Outcome Measures
The primary outcome was lower extremity muscle strength and hip posterolateral stabilizers over the 9-week study. The secondary outcomes were physical performance measures and pain. Participants were assessed at baseline and 3, 6, and 9 weeks. The order of testing was 30-second chair stand test (30-SCST), forward step-down test (FSDT), timed stair climb test (SCT), 6-minute walk test (6MWT), and strength testing of knee extensor/flexor and hip posterolateral stabilizers. Pain levels were assessed before and after each test using visual analog scale (VAS) (Table I). Current pain was assessed at baseline (Supplementary Table S2).
Knee Strength and Hip Stability Isometric Test by Study Groups (N = 84) Adjusted and Unadjusted for Pain
| Wk. | Knee extensor- treated limb (kgf) | Knee extensor- untreated limb (kgf) | Knee flexor- treated limb (kgf) | Knee flexor- untreated limb (kgf) | HipSIT- treated limb (kgf/kg) | HipSIT- untreated limb (kgf/kg) | Pain severity at muscle testinga | |
|---|---|---|---|---|---|---|---|---|
| BFR 80% LOP | 0 | 54.8 (18.7) | 58.8 (17.2) | 21.0 (8.5) | 22.1 (7.7) | 29.6 (12.4) | 31.4 (11.8) | 3.36 (2.3) |
| 3 | 57.1 (22.0) | 63.1 (25.4) | 21.3 (8.1) | 22.8 (8.4) | 31.7 (12.7) | 30.5 (12.3) | 2.54 (1.9) | |
| 6 | 61.5 (21.5) | 64.4 (22.0) | 21.8 (8.2) | 22.1 (7.3) | 32.8 (13.2) | 33.1 (13.7) | 2.24 (2.1) | |
| 9 | 62.7 (24.1) | 65.9 (25.7) | 21.5 (7.7) | 21.8 (7.6) | 32.5 (13.2) | 33.6 (13.6) | 2.67 (2.4) | |
| BFR 20 mmHg of LOP | 0 | 54.4 (22.8) | 62.3 (20.9) | 21.6 (7.9) | 22.7 (7.7) | 28.3 (11.5) | 28.9 (10.4) | 3.47 (2.0) |
| 3 | 57.5 (24.1) | 63.0 (23.4) | 21.4 (7.9) | 22.7 (7.5) | 29.7 (10.3) | 30.1 (9.97) | 3.74 (2.2) | |
| 6 | 62.7 (22.0) | 66.0 (24.7) | 20.9 (8.0) | 21.5 (8.0) | 29.7 (10.0) | 29.9 (10.6) | 2.26 (2.0) | |
| 9 | 63.0 (20.6) | 68.6 (20.1) | 19.8 (5.4) | 20.3 (5.1) | 31.3 (11.3) | 31.4 (11.2) | 2.35 (2.3) | |
| Mixed-effects regression models F testb | ||||||||
| Unadjusted | ||||||||
| Time | F(1,203) = 25.7 (P < .001) | F(1,203) = 10.4 (P = .001) | F(1,206) = 0.32 (P = .57) | F(1,206) = 3.32 (P = .07) | F(1,204) = 7.35 (P = .007) | F(1,201) = 7.06 (P = .008) | F(1,203) = 23.6 (P < .001) | |
| Group | F(1,102) = 0.0 (P = .99) | F(1,102) = 0.19 (P = .66) | F(1,116) = 0.26 (P = .61) | F(1,120) = 0.17 (P = .68) | F(1,108) = 0.36 (P = .55) | F(1,103) = 0.7 (P = .41) | F(1,123) = 1.2 (P = .27) | |
| t×g | F(1,203) = 1.0 (P = .32) | F(1,203) = 0.19 (P = .67) | F(1,206) = 3.15 (P = .08) | F(1,207) = 2.72 (P = .10) | F(1,204) = 0.08 (P = .77) | F(1,201) = 0.001 (P = .98) | F(1,203) = 1.1 (P = .30) | |
| Adjusted for pain at time of testing | ||||||||
| Time | F(1,208) = 15.7 (P = .001) | F(1,208) = 8.0 (P = .005) | F(1,214) = 2.45 (P = .12) | F(1,215) = 6.6 (P = .01) | F(1,210) = 3.24 (P = .07) | F(1,206) = 5.24 (P = .02) | — | |
| Group | F(1,103) = 0.03 (P = .87) | F(1,104) = 0.23 (P = .63) | F(1,119) = 0.55 (P = .46) | F(1,122) = 0.36 (P = .55) | F(1,110) = 0.21 (P = .64) | F(1,102) = 0.62 (P = .43) | — | |
| t×g | F(1,202) = 0.67 (P = .42) | F(1,202) = 0.14 (P = .71) | F(1,206) = 4.03 (P = .046) | F(1,206) = 3.37 (P = .07) | F(1,202) = 0.21 (P = .65) | F(1,200) = 0.01 (P = .97) | — | |
Values are mean ± SD except where indicated.
Abbreviations: BFR, blood flow restriction; HipSIT, hip stability isometric test; LOP, limb occlusion pressure; M, mean; PFP, patellofemoral pain; SD, standard deviation; VAS, visual analog scale; Wk., week.
*P < .05 ** P < .01; There were no significant findings comparing 80% LOP BFR group to 20 mmHg BFR group at each time point from a mixed-effects model with time as a factor.
VAS pain item: Indicate your pain level on this scale where “0” is no pain and “10” is the worst possible pain.
Mixed-effects models with time as continuous variable using a type III ANOVA table with Satterthwaite’s method. The F value, degrees of freedom, and corresponding P values are presented. Bold text indicates a significant F test (P <0.05). Time effect is for overall change during study. Group effect is whether there is a difference between the group means. t×g interaction tests whether change over time differs between the two groups.
Lower extremity muscle strength and hip posterolateral stabilizers
Knee flexion, extension muscles, and hip posterolateral stabilizers were assessed for strength using a handheld Nicholas Manual Muscle Tester (NMMT; Lafayette Instrument Company, Lafayette, IN). The NMMT device measured knee extensor and flexor muscle strength as described by Dunn and Iversen.16 A systematic literature review that compared handheld dynamometry with isokinetic muscle strength testing (gold standard) found minimal differences between handheld and isokinetic dynamometry in a clinic setting,17 suggesting that these techniques are valid and reliable for muscle strength assessment. Muscle groups were tested in this order: Right knee extensors, right knee flexors, left knee extensors, left knee flexors, right hip stability isometric test (HipSIT), and then left HipSIT. For each test, participants performed three maximal efforts holding contractions for 4 seconds, separated by 30-second rests; the highest of the three values was accepted in kilograms.
Participants sat with 90° hip flexion, feet dangling. A goniometer positioned the knee in 70° flexion. The distance from tibial tuberosity to superior aspect of the medial malleolus was measured, multiplied by 0.6, and marked. Knee extension was tested on the superior aspect of the limb using the NMMT, while knee flexion was tested on the dorsal side of the same limb. Reliability of the NMMT was determined using 1-day repeat testing with intrarater correlation coefficients ranging from 0.97 to 0.99.18 Pearson correlation coefficients between the NMMT and a Cybex II dynamometer ranged from 0.64 to 0.76.18
The HipSIT evaluated strength of the hip posterolateral stabilizers (gluteus medius, maximus, and tensor fasciae latae).19 Participants were placed in a side lying position with legs at 45° hip flexion and 90° knee flexion. The dynamometer was placed 5 cm above the knee joint with a strap placed over it for stabilization. The participant lifted the knee to push against the dynamometer as hard as possible for 4 seconds while retaining heel contact. The intraclass correlation coefficient (ICC) was 0.981 (95% CI: 0.966, 0.990) with interrater ICC = 0.981 (95% CI: 0.967, 0.989).19
Physical performance tests
The chair stand test, FSDT, and SCT encompassed weight-bearing stress with knee flexion angles to represent common aggravating positions of those with PFPS that require active muscle control.20 The 6MWT is a submaximal test used to evaluate aerobic capacity, mobility, and physical performance.21–23 Before and after each test, a VAS was administered to quantify pain.
30-SCST
The 30-SCST was conducted with the participant sitting in the middle of a chair, feet flat on the floor, and arms crossed over the chest. The participant stood to a full standing position and then returned to a fully seated position as many times as possible in 30 seconds, while the tester counted the number of repetitions. Validation of the 30-SCST to the lateral step-up test showed Pearson correlations of r = 0.51 (P = .01) and r = −0.79 (P = .01) as compared to the five times sit-to-stand test.24 Intraclass correlation estimates showed ICC = 0.95 (CI = 0.91-0.97) in adults aged 18-35 years.25
30-Second FSDT
The 30-second FSDT was performed from a platform with an 8-inch step height (rise). The participant stepped forward and down using a single-leg stance and straight knee with hands crossing the chest. The knee of the stance leg bends until the opposite foot lightly touches the floor with the heel and returns to full knee extension. Both the affected and unaffected legs were assessed. The number of repetitions the subject performed in 30 seconds was noted. Intraclass correlations estimates showed ICC = 0.94 (SEM = 0.53); Pearson correlations of the 30-second FSDT with the VAS were r = 0.570, P < .01.20
Timed SCT
Participants ascended four steps (6-inch rise, 11.5-inch run) to a platform and descended to the bottom of the stairs, “as fast as possible while still being safe.” A single handrail was allowed, if needed. Each participant completed two complete rounds, if possible, and the two times were averaged. Such performance-based measures have high test–retest reliability26 and are inversely correlated to quadriceps muscle strength and cardiovascular capacity.27
6MWT
Participants walked at a “fast” pace for 6 minutes using a preset circular course. Instructions given to participants were to walk as “quickly as possible.” Upon completing the test, the total distance walked was determined using a measuring wheel. The 6MWT has demonstrated a 72.7% ± 11.6% of VO2max with a rank order correlation of 0.49 (P = .001).22 Test–retest reliability was ICC of 0.917 (0.86-0.95).28
Current pain intensity
The VAS was used to assess current PFPS knee pain. A horizontal 10-cm line with a movable slider was used to indicate perceived pain intensity ranging from “no pain” at far left (0.0 cm) to “worst pain imaginable” at far right (10 cm). Participants moved the slider to the point indicating their current pain. The score was determined by the distance between the “no pain” anchor and the participant’s cursor. The VAS pain scale correlates highly with acute pain levels.29,30 Intraclass correlation of reliability for all paired VAS score showed ICC = 0.97 (95% CI = 0.96 to 0.98).31
Sample Size Estimates
Sample size was estimated using simulation to detect an effect size of approximately 0.5 with power of 0.8, alpha of .05, and allowing for a 20% dropout/withdrawal rate. This effect size was consistent with our previous work and the expectation of a medium effect for BFR based on the literature.9,10,32,33 The simulation was based on creating 1,000 datasets with participants evaluated at baseline and 3, 6, and 9 weeks using a multivariate normal distribution for random effects for intercept and slope that were added to the basic model specifying the effect size over the 9-week intervention. At time points 3, 6, and 9, participants were randomly dropped from the analysis at a specified rate to assess the impact of withdrawal. The resulting datasets were analyzed using a linear mixed-effects model with random intercept and time. The time-by-group interaction was tested with a naïve likelihood ratio test with the proportion of significant (P < .05) interactions representing the power. Based on this approach, 42 participants per group were adequate to detect an approximate 0.5 effect size with a power of 0.8 for the primary strength and physical performance variables assuming a dropout rate of 20%.
Statistical Analyses
Group demographics were compared using the Fisher’s exact test for categorical variables and a t-test for continuous variables. Primary analysis was based on the intention-to-treat principle with outcome measures being examined using repeated measures, linear mixed-effects models with random effect for participant, time treated as continuous, group, and a group-by-time interaction. The main comparison was the group-by-time interaction to test for change over time between the treatment groups evaluated by an F-test. The mixed-effects model was reanalyzed with time as categorical to compare change from baseline between BFR-NMES (80% LOP) and BFR-sham at each time by t-tests using Satterthwaite’s method. A P value <.05 was set a priori for statistical significance for all analyses performed using R software version 4.2.134–36 with mixed-effects models using the lme437 and lmerTest38 software packages.
Enrollment and study attrition
The study enrolled and randomized 84 participants, 42 per group. Of the 84 starting the program, 21 participants were lost to follow-up (11 high BFR 80% LOP; 10 BFR-sham). See CONSORT diagram (Fig. 1).

CONSORT flow diagram for blood flow restriction study.
Sensitivity analysis
Sensitivity analysis was used to study the influence of intervention adherence. The analysis used linear mixed effects to regress outcome measures on (1) the cumulative number of in-clinic BFR-NMES treatments and (2) the cumulative minutes downloaded from the NMES devise (which included at-home and in-clinic usage) at each evaluation time (0, 3, 6, and 9 weeks). These relationships were plotted by the cumulative NMES time usage (Figs. 2 and Supplementary Fig. S1) and the number of treatment sessions (Supplementary Figs S2 and S3).
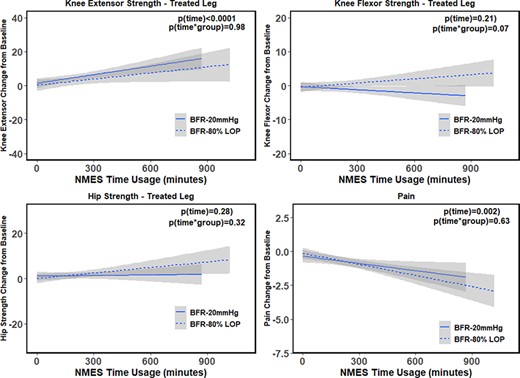
Mean change of hip and knee strength, and pain from baseline for NMES usage in minutes. Points and lines represent the two intervention groups: the points are the mean NMES usage in minutes, although the lines are the regression lines for the BFR intervention groups. The P values are from a mixed-effects model of strength and pain outcomes and NMES time usage.
RESULTS
Baseline Participant Characteristics
There were no significant group differences between the high BFR (80% LOP) and BFR-sham (20% LOP) groups at baseline for sex, race, rank, injury mechanism, or current pain level (Supplementary Table S2). The groups differed by participant age, with high BFR (80% LOP) participants being approximately 3 years older than those in the BFR-sham group. Strength and physical performance measures (P > .05) did not differ at baseline, except for the step-down test (treated and untreated leg, t = 2.2, P = .03). The mixed-effects models we used account for the baseline differences based on the random intercepts for participants.
Quadriceps and Hip Muscle Strength and Pain
Improvement was observed in knee extensor and hip strength but not flexor over 9 weeks of treatment (Table I). In both the treated and the untreated extremities, no differences (group-by-time interactions) were found between the high BFR (80% LOP) and the BFR-sham groups for knee extension, flexion, or hip strength (Table I). Similarly, pain measures improved over the intervention for both groups with no group-by-time interactions. When strength measures were adjusted for pain using the VAS before all strength and physical performance tests, knee flexion exhibited a difference between high BFR (80% LOP) and BFR-sham groups (Table I). Pain severity at muscle testing declined over the 9 weeks for both groups with no significant differences (P = .30).
Physical Performance
The physical performance measures showed similar improvements over the 9-week intervention. All measures improved over time (Table II). No group-by-time interactions were identified between the high BFR 80% LOP and the BFR-sham groups, an observation that persisted when adjusting for pain.
Physical Performance and Pain Outcomes by Study Groups (N = 84) Adjusted and Unadjusted for Pain
| Week | FSDT treated (number of repetitions) | FSDT untreated (number of repetitions) | 30-SCST (number of rises) | 6MWT (inches) | SCT (seconds) | |
|---|---|---|---|---|---|---|
| BFR 80% LOP | 0 | 14.5 (5.2) | 16.6 (4.6) | 11.5 (3.19) | 21,727 (3,589) | 4.62 (2.61) |
| 3 | 17.0 (5.4) | 18.4 (4.9) | 12.9 (3.37) | 23,630 (3,641) | 4.22 (1.70)* | |
| 6 | 18.7 (5.9) | 19.4 (5.1) | 14.0 (4.05) | 23,614 (3,927) | 4.21 (1.78) | |
| 9 | 19.5 (7.1) | 21.3 (5.9) | 14.8 (5.00) | 23,156 (3,578) | 3.99 (1.07) | |
| BFR 20 mmHg of LOP | 0 | 12.0 (4.9) | 14.3 (4.8) | 10.8 (2.60) | 22,059 (3,270) | 4.35 (0.88) |
| 3 | 13.3 (6.0) | 15.8 (4.7) | 11.5 (3.36) | 22,730 (3,635) | 4.75 (2.58)* | |
| 6 | 15.9 (5.1) | 17.7 (6.6) | 12.6 (3.45) | 23,745 (4,057) | 4.08 (0.96) | |
| 9 | 16.9 (6.0) | 18.7 (6.5) | 13.9 (3.54) | 23,573 (4,021) | 3.76 (0.68) | |
| Mixed-effects models F testa | ||||||
| Unadjusted | ||||||
| Time | F(1,217) = 37.9 (P < .0001) | F(1,203) = 25.7 (P < .0001) | F(1,206) = 101 (P < .0001) | F(1,194) = 16.5 (P < .0001) | F(1,184) = 8.7 (P = .004) | |
| Group | F(1,120) = 2.9 P = .09) | F(1,111) = 3.8 P = .05) | F(1,112) = 1.33 P = .25) | F(1,111) = 0.00 (P = .98) | F(1,104) = 0.03 (P = .87) | |
| t×g | F(1,201) = 1.17 (P = .28) | F(1,203) = 0.02 (P = .89) | F(1,206) = 0.24 (P = .62) | F(1,194) = 0.06 (P = .81) | F(1,184) = 0.23 (P = .63) | |
| Adjusted for pain at time of testing | ||||||
| Time | F(1,205) = 55.6 (P < .0001) | F(1,203) = 76.5 (P < .0001) | F(1,215) = 62.2 (P < .0001) | F(1,204) = 6.1 (P = .01) | F(1,189) = 2.6 (P = .11) | |
| Group | F(1,114) = 5.6 (P = .02) | F(1,111) = 3.6 (P = .06) | F(1,115) = 0.72 (P = .40) | F(1,114) = 0.19 (P = .66) | F(1,106) = 0.67 (P = .42) | |
| t×g | F(1,197) = 0.40 (P = .53) | F(1,202) = 0.007 (P = .98) | F(1,206) = 0.84 (P = .36) | F(1,192) = 0.01 (P = .91) | F(1,182) = 1.12 (P = .29) | |
Values are mean ± SD except where indicated.
P < .05; comparing 80% LOP BFR group to 20 mmHg BFR group at each time point from a mixed-effects model with time as a factor.
Mixed-effects models with time as continuous using a type III ANOVA table with Satterthwaite’s method. The F value, degrees of freedom, and corresponding P-values are presented. Time effect is for overall change during the study for all participants. Group tests whether there is a difference between the group means across all measurements. t×g tests whether change over time differs between at least one of the treatment groups and PT.
Abbreviations: 6MWT, 6-minute walk test; 30-SCST, 30-second chair stand test; BFR, blood flow restriction; FSDT, forward step-down test; LOP, limb occlusion pressure; NMES, neuromuscular electrical stimulation; SCT, timed stair climb test; SD, standard deviation.
Adherence to Interventions
Adherence was accessed by the number of in-clinic BFR-NMES therapy visits attended and the cumulative time registered on the NMES device. The high BFR (80% LOP) group had a median of 14 participants (interquartile range [IQR] 9-15) who attended BFR-NMES therapy visits although the BFR-sham group had 13 participants (IQR 9-14). The total NMES time usage was 380 minutes (IQR 266-498) for the high BFR group and 371 minutes (IQR 324-541) for the BFR-sham group. This corresponds to a median of approximately 19 20-minute NMES sessions for the high BFR (80% LOP) group and 18.5 for the BFR-sham group. When we examined the relationship between the number of BFR-NMES sessions and the outcomes, we found significant relationships with improvements in treated knee extensor strength (0.87 kg/session, P < .0001), treated hip strength (0.23 kg/session, P = .04), and pain (−0.11/session, P < .0001) (Supplementary Fig. S2) although there were no group differences. A similar set of relationships was observed for the time of NMES usage for treated knee extensor strength (0.02/minute, P < .0001) and pain (−0.002/minute, P = .002) (Fig. 2). For the physical performance measures, improvement was observed between the number of BFR-NMES visits and the forward step-down test (0.04 steps/session, P < .0001), chair stand test (0.23 stands/session, P < .0001), 6MWT (143 inches/session, P = .0002), and timed SCT (−0.04 second/session, P = .01) (Supplementary Fig. S3). For the time of NMES usage, similar relationships were observed for forward step-down test (0.009 steps/minute, P < .0001), chair stand test (0.005 stands/minute, P < .0001), and 6MWT (3.6 inches/minute, P = .0005) (Supplementary Fig. S1). A trend was observed for the timed SCT.
DISCUSSION
This study examined whether high BFR treatment (80% LOP) with NMES leads to better improvement in strength, physical performance, and pain than BFR-sham with NMES. The main findings showed that adding high BFR (80% LOP) or BFR-sham to NMES over 9 weeks resulted in similar improvements in strength, physical performance, and pain. The improvements in both treatment groups are consistent with our previous work using electrostimulation for strength, physical performance, and pain improvement in active duty service members with PFPS.10 In that study, we found that injured knee extensor strength increased approximately 22% in the NMES and 16% in the NMES plus TENS groups, although in the current study, improvements were approximately 14% for high BFR (80% LOP) and 16% for BFR-sham groups. Thus, in combining BFR with our previous NMES protocol with active exercise, BFR did not appear to have an additive effect.
Other studies showed varied results when adding BFR to NMES, with differences possibly because of length or intensity of training programs. Andrade et al. found no benefit to combining low-intensity NMES training with BFR at 100 mmHg pressure; participants trained one leg 3 days a week for 6 weeks with no increase in isometric muscle strength.39 Slysz and Burr observed group differences between BFR + NMES but not NMES or BFR alone and a no treatment control in recreationally active adults suggesting a combined effect.40 In this case, the intervention groups stimulated each leg for 32 minutes, 4 days per week for 6 weeks.40
A systematic review that quantified the effectiveness of BFR on muscle strength found BFR training for a period longer than 6 weeks was needed to show strength gains and that a duration of longer than 8 weeks was approximately 60% as effective as those shorter than 8 weeks (0.2 kg versus 0.3 kg, P = .05).7 Another literature review found some studies that suggested BFR training does not significantly increase strength until after a period of 9-10 weeks.41 Thus, the short duration of the average BFR intervention needs to be considered in interpreting results, particularly when combining BFR with NMES.
Another issue in evaluating BFR with NMES is treatment adherence. Interestingly, we found increasing NMES usage associated with greater improvements in strength, physical performance, and pain. The median number of BFR-NMES in-clinic treatments in this study was comparable or greater than reported in the literature,40,41 although the impetus for improvement seemed to be NMES usage. This could explain why BFR had no additive effect in this case, perhaps any BFR effect was overshadowed by NMES over the 9-week duration of the current study.
A limitation of this study was lack of a BFR-only or exercise-only comparison groups. This study design was planned a priori based on the research question and our prior work. We previously compared strength changes in active duty personnel with PFPS treated with NMES plus exercise to those treated with exercise alone. As noted earlier, the mean difference between the control and NMES groups in our previous study was similar to the improvement noted for both groups in this study. A related limitation was that the current study was designed to detect an effect size difference of 0.5 between the high and low BFR groups, which represented an increased difference of 8 kg isometric strength for the quadriceps between the two groups over 9 weeks, from an average starting strength of 32 kg. Our participants started stronger, with both groups improving knee extensor strength by approximately 15%. Therefore, the study was not powered to detect smaller differences between the two treatment groups, if it were present.
CONCLUSIONS
Incorporating NMES strength training into the rehabilitation of active duty service members with PFPS may offer modest benefit in improving knee and hip strength, pain, and physical performance over 9 weeks. Improvement in knee extensor strength, pain, and physical performance was related to the number of BFR sessions. Blood flow restriction did not seem to provide a large additive effect to NMES plus exercise in this group of military active duty service members with PFPS.
ACKNOWLEDGMENTS
We would like to thank the military service members who volunteered to participate in this study.
SUPPLEMENTARY MATERIAL
SUPPLEMENTARY MATERIAL is available at Military Medicine online.
FUNDING
This research was sponsored by the TriService Nursing Research Program, Uniformed Services University of the Health Sciences (USUHS); however, the information or content and conclusions do not necessarily represent the official position or policy of, nor should any official endorsement be inferred by, the TriService Nursing Research Program, the USUHS, the Department of Defense, or the U.S. Government (Award # 11052-N19-B01). The USUHS, 4301 Jones Bridge Rd., Bethesda, MD 20814-4799, is the awarding and administering office.
CONFLICT OF INTEREST STATEMENT
The authors have no financial disclosures or conflict of interests to report.
DATA AVAILABILITY
The data underlying this article are available in the article and in its online supplementary material.
CLINICAL TRIAL REGISTRATION
The trial was registered in ClinicalTrials.gov (Trial of Neurostimulation and BFR for PFPS in Active Duty Identifier: NCT04086615), first posted on September 11, 2019.
INSTITUTIONAL REVIEW BOARD
This study was approved by Walter Reed National Military Medical Center Institutional Review Board (WRNMMC-2019-0269).
INSTITUTIONAL ANIMAL CARE AND USE COMMITTEE (IACUC)
Not applicable
INDIVIDUAL AUTHOR CONTRIBUTION STATEMENT
L.A.T., E.J.M., and L.W. contributed to study conception, design, and implementation of the research. L.A.T. and E.J.M. drafted the original manuscript. K.E. and J.H. contributed to data collection. E.J.M., L.A.T., and M.F. contributed to data management and data cleaning. L.A.T., E.J.M., and C.M. contributed to analysis and interpretation of results. C.M. verified the analytical methods. All authors reviewed the results and approved the final version of the manuscript.
PUBLIC AFFAIRS CLEARANCE
Public affairs clearance approved.
CONSORT
CONSORT guidelines for RCTs were followed using http://www.consort-statement.org.
REFERENCES
Author notes
We have submitted the abstract to present at the TriService Nursing Research Program Dissemination Course April 2023. Awaiting acceptance. The views expressed are those of the authors and do not reflect the official policy or position of the TriService Nursing Research Program, Uniformed Services University of the Health Sciences, University of Tennessee Health Sciences Center, the Department of Defense, or the U.S. Government.

