


ABSTRACT
Gender distribution in academic ob-gyn leadership positions has previously been examined in the civilian sector, but not in military medicine.
To characterize the distribution of department-level leadership positions by gender and subspecialty in academic military facilities in comparison to those reported in the civilian sector.
This is an observational cross-sectional study. We queried military obstetrics and gynecology (ob-gyn) specialty consultants, for title and gender of personnel assigned to academic military treatment facilities. Roles were characterized by gender and subspecialty, and the proportion of female leaders was compared to published civilian leadership data.
Women comprised 25% of Department Chairs, 45% of Assistant Chairs, and 42% of Division Directors. In educational leadership roles, women comprised 25% of Residency Program Directors, 0% of Fellowship Directors, and 62% of medical Student Clerkship Directors. Female department chairs were most often uro-gynecologists (44%) followed by specialists in ob-gyn (37%). Most female residency program directors were specialists in general obstetrics and gynecology. The proportion of women in leadership roles in military departments was not different than in the civilian sector.
In contrast to civilian academic leadership positions, Department Chairs were most likely to be uro-gynecologists. Similar to civilian programs, women remain underrepresented as chairs, Assistant Chairs, Fellowship Directors, and Division Directors and similarly represented as Residency Program Directors. Despite a smaller pool of women available to fill academic leadership positions in military ob-gyn departments, the proportion of women in leadership roles reaches parity with the civilian sector. This suggests that a greater proportion of women rise to leadership positions in military academic ob-gyn departments than in the civilian sector.
INTRODUCTION
A 2015 study in Obstetrics & Gynecology reported on the 2012-2013 gender distribution of leadership roles in academic obstetrics and gynecology (ob-gyn) programs. Military programs were intentionally excluded based on the presumption that they drew from a different pool of available leaders than the civilian population and the lack of publicly accessible data on military programs.1 This study was followed a year later by an article that compared the proportion of women in department leadership positions across nine specialties (obstetrics & gynecology, anesthesia, diagnostic radiology, general surgery, internal medicine, neurology, pathology, pediatrics, and psychiatry), compared to the proportion of women entering their respective fields. Women were underrepresented across all nine specialties.2 When leadership roles were stratified by the geographic American College of Obstetricians and Gynecologists (ACOG) districts, the proportion of female leaders was lower than the proportion of female members; the degree of disparity varied by geographic location and role.3 This study also excluded the ACOG Armed Forces District.
Gender disparities have also been highlighted for women achieving the rank of full professor, even after adjusting for age, years since residency, publication volume, National Institutes of Health grants, and participation in clinical trials.4 Although women hold 55% of all faculty appointments, they are underrepresented in the academic rank of Full Professor (27%), and Associate Professor (26%). Only 15% of Department Chair positions are held by women. These data are drawn from the National Residency Match Program which does not include information about military programs due to a separate match process.5 The Association of American Medical Colleges indicates that 82.6% of ob-gyn residents are female (2013 data) as compared to 74.1% in 2003. The percentage of female ob-gyn residents in 2018 is largely unchanged (82.8%). Overall, women represent 46% of residents in the USA.6
Military Obstetrics and Gynecology Residency Programs represent 3.3% of the ob-gyn programs in the USA (8 of 241 programs in 2016). Residents are drawn from the Uniformed Services University of the Health Sciences (USUHS) and the Health Professions Scholarship Program (HPSP), which offers prospective military physicians medical education in exchange for service as a commissioned officer. The demographics of the military physician feeder population differs from those entering civilian residency training. Women comprise nearly half the medical students in the USA. The gender distribution at USUHS and in the HPSP program was similar from 2014 to 2017, with women comprising 25% and 28% of students, respectively.7 Women comprised 34% of the class of 2018 and 37% of the class of 2019 at the USUHS.8 For the largest represented service (Army), women comprised 32% of graduates from the HPSP program from 2003 to 2019 (email communication, Ms. Linda Diehl, Army Medical Command Graduate Medical Education Administrator, May 2016, [email protected]). It appears that gaps in gender parity at USUHS begin at the level of the medical student application and selection process. However, once enrolled in USUHS, female graduates are as likely to enter surgical specialties as male graduates.9
The military leadership pipeline for women is further complicated by gender differences in physician attrition. After two prolonged land wars, the military experienced a depletion of officers, including physicians.10 Causes for this attrition include, but are not limited to, physician burnout, morale, and frequent deployments.10–14 In the Army, the percentage of female ob-gyns declines with advancing rank (Fig. 1), and more women leave the military at earlier ranks than men (Fig. 2) (email communication, Andy Wiesen MD, Office of the Assistant Secretary of Defense, Health Affairs, May 2016). Over time, this leaves fewer available women to hold leadership positions. Wiesen et al. examined factors associated with continued active duty physician service beyond the initial service obligation. They found that factors associated with continued service included male gender, total years of accumulated service at the conclusion of the initial obligation, and the specialties of infectious disease and preventive medicine.15
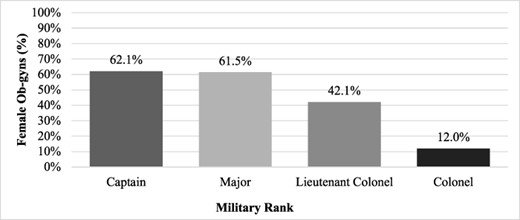
Percentage of female obstetrician-gynecologists by military rank (Army).
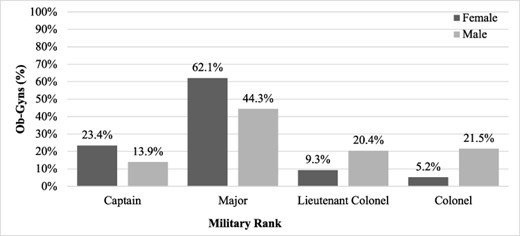
Rank at separation from military service by gender.
This purpose of this study is to examine the gender and subspecialty distribution among leadership positions in military academic centers and to compare the proportion of women in military leadership positions to that in civilian academic centers.
MATERIALS AND METHODS
This is an observational cross-sectional study conducted in June 2016, approved by the Madigan Army Medical Center Institutional Review Board (#216055). Each branch of the military (Air Force, Army, and Navy) has a specialty consultant, who has access to the names of all personnel assigned to each military treatment facility and their position. The specialty consultants were queried for the gender and specialty or subspecialty status of individuals in leadership positions at academic military institutions. We defined academic military institutions as those with an accredited Obstetrics and Gynecology Residency Program.
The specific positions queried were as follows: Department Chief/Chair, Assistant Department Chief/Chair, Division Director, Residency Program Director, Fellowship Program Director, and Medical Student Clerkship Director. Military treatment facilities without ob-gyn residency programs were excluded. Gender was inferred by the specialty consultants based on name or personal knowledge of the individual. No personally identifying information was collected.
Gender and subspecialty data are reported in count and frequencies by leadership position. Comparisons between gender and non-ordinal categorical variables were conducted with Χ2 test or Fisher’s exact test as necessary, while gender and ordinal variables were examined using the Cochrane–Armitage test for trend. Analyses were run using SAS 9.4 (SAS Institute, Cary NC), and P values less than .05 were considered significant.
RESULTS
Within the 8 academic facilities, there were a total of 71 leadership positions. Of these, 61 filled leadership positions were identified (Table I). The reason for the discrepancy is that some individuals hold more than one leadership position. At the time of this study, none of the positions were vacant.
Subspecialty and Gender for Obstetrics/Gynecology Leadership Roles, Academic Military Facilities
| Title | Obstetrics & gynecology specialist # (%) | Maternal-fetal medicine # (%) | Gynecologic oncology # (%) | Reproductive endocrinology & infertility # (%) | Minimally invasive gynecologic surgery # (%) | Female pelvic medicine & reconstructive surgery # (%) | Total # (%) |
|---|---|---|---|---|---|---|---|
| Chief | 3 | 0 | 0 | 0 | 0 | 5 | 8 |
| Female | 1 (33.3) | 0 (0) | 0 (0) | 0 (0) | 0 (0) | 1 (20.0) | 2 (25.0) |
| Male | 2 (66.7) | 0 (0) | 0 (0) | 0 (0) | 0 (0) | 4 (80.0) | 6 (75.0) |
| Assistant Chief | 4 | 1 | 0 | 1 | 1 | 4 | 11 |
| Female | 1 (25.0) | 0 (0) | 0 (0) | 0 (0) | 0 (0) | 4 (100.0) | 5 (45.5) |
| Male | 3 (75.0) | 1 (100.0) | 0 (0) | 1 (100.0) | 1 (100.0) | 0 (0) | 6 (54.6) |
| Division Director | 0 | 7 | 8 | 8 | 0 | 8 | 31 |
| Female | 0 (0) | 2 (28.6) | 4 (50.0) | 4 (50.0) | 0 (0) | 3 (37.5) | 13 (41.9) |
| Male | 0 (0) | 5 (71.4) | 4 (50.0) | 4 (50.0) | 0 (0) | 5 (62.5) | 18 (58.1) |
| Fellowship Director | 0 | 1 | 1 | 1 | 1 | 1 | 5 |
| Female | 0 (0) | 0 (0) | 0 (0) | 0 (0) | 0 (0) | 0 (0) | 0 (0) |
| Male | 0 (0) | 1 (100.0) | 1 (100.0) | 1 (100.0) | 1 (100.0) | 1 (100.0) | 5 (100.0) |
| Residency Director | 4 | 2 | 1 | 1 | 0 | 0 | 8 |
| Female | 1 (25.0) | 1 (50.0) | 0 (0) | 0 (0) | 0 (0) | 0 (0) | 2 (25.0) |
| Male | 3 (75.0) | 1 (50.0) | 1 (100.0) | 1 (100.0) | 0 (0) | 0 (0) | 6 (75.0) |
| Clerkship Director | 5 | 1 | 0 | 2 | 0 | 0 | 8 |
| Female | 3 (60.0) | 0 (0) | 0 (0) | 2 (100.0) | 0 (0) | 0 (0) | 5 (62.5) |
| Male | 2 (40.0) | 1 (100.0) | 0 (0) | 0 (0) | 0 (0) | 0 (0) | 3 (37.5) |
| Total | 16 | 12 | 10 | 13 | 2 | 18 | 71 |
| Female | 6 (37.5) | 3 (25.0) | 4 (40.0) | 6 (46.2) | 0 (0) | 8 (44.4) | 27 (38.0) |
| Male | 10 (62.5) | 9 (75.0) | 6 (60.0) | 7 (53.9) | 2 (100.0) | 10 (55.6) | 44 (62.0) |
We found that women comprised of 25.0% of Department Chairs/Chiefs, 45.5% of Vice Chairs/Assistant Chiefs, and 41.9% of Division Directors. In educational leadership, women made up 25.0% of Residency Directors and 62.5% of Clerkship Directors. There were no female Fellowship Directors. Breakdown of the leadership roles by subspecialty shows the percentage of female ob-gyn leaders is highest among reproductive endocrinology and infertility (46.2%) and uro-gynecology (44.4%), while it is lowest in minimally invasive gynecological surgery (0%) and maternal-fetal medicine (25.0%). (Table I) The proportion of females in academic leadership positions is not significantly different between military and civilian institutions (Table II).
Proportion of Women in Leadership Positions, Civilian Versus Military
| Role | Civilian | Military | P value |
|---|---|---|---|
| Chief/Chair | 46 (20.4) | 2 (25.0) | .6700 |
| Assistant Chief/Vice Chair | 53 (36.1) | 5 (45.5) | .5337 |
| Division Director | 173 (29.6) | 13 (41.9) | .1615 |
| Fellowship Director | 61 (31.9) | 0 (0) | .1514 |
| Residency Director | 113 (47.3) | 2 (25.0) | .2905 |
| Clerkship Director | 76 (66.1) | 5 (62.5) | 1.0000 |
Data reported in n (%). Civilian data from Hofler et al.1
DISCUSSION
Representation of women in leadership roles in academic military ob-gyn departments mimics that of the civilian system, in that women remain underrepresented as Department Chair, Assistant Chairs, and Division Director as compared to the percentage of women in the specialty. Although not statistically significant, military academic ob-gyn departments had a higher proportion of women as Chiefs and Division Directors. Similar to findings in the civilian sector, women are more heavily represented in educational leadership roles in academic military facilities, specifically as residency program directors and clerkship directors with a notable absence of female fellowship directors.
Multiple factors contribute to the smaller feeder population of female physician leaders. The discrepancy begins in medical school, regardless of whether entry is via the Uniformed Services University or the HPSP program. In the Army, this is compounded by greater attrition of women in the rank of Captain and Major, which corresponds to individuals in their first 8 years of practice as well as when individuals’ active duty service obligation has been fulfilled. This time range may also correspond to a desire to pursue child-bearing. This results in a pool of available senior leaders skewed toward male ob-gyns.7
This is the first study to characterize the proportion of women in military academic ob-gyn leadership roles. This information is not publicly accessible. The relatively small number of military training programs, especially fellowship programs, makes any gender differences more pronounced than in civilian programs. Limitations include lack of attrition data for the Navy and Air Force and inability to account for the effect of other unique leadership pathways such as operational medicine, which exist in the military. We assume that non-academic leadership opportunities could further deplete the pool of available female academic leaders.
Women are similarly represented in academic ob-gyn department leadership positions, despite having a smaller pool of women to draw from. This seems to indicate that despite lack of gender parity, a greater proportion of female military ob-gyn physicians advance to academic and department leadership roles when compared to the civilian sector. Future studies should examine leadership representation among all specialties and across all branches of service.
ACKNOWLEDGMENTS
The study team wishes to acknowledge the assistance of the three specialty consultants, Dr. Johnnie Wright (U.S. Army), Dr. Kristina Morocco (U.S. Navy), and Dr. Geoff Towers (U.S. Air Force), and Ms. Ashley Adams for statistical support.
FUNDING
None declared.
CONFLICT OF INTEREST STATEMENT
None declared.
REFERENCES
Website: Association of Americal Medical Colleges:
Website: Association of American Medical Colleges:
Website: Uniformed Services University:
Author notes
Podium presentation at the American College of Obstetricians and Gynecologists Armed Forces District Annual Meeting, Orlando, FL, October 21-23, 2016, and poster presentation at the Military Health System Research Symposium Conference, Orlando, FL, August 19-23, 2018. The views expressed in this article are those of the authors and do not necessarily reflect the official policy or position of the Department of the Navy, Department of the Army, Department of the Air Force, Department of Defense, the Defense Health Agency, or the U.S. Government. The authors are military service members. This work was prepared as part of their official duties. Title 17 U.S.C. 105 provides that “Copyright protection under this title is not available for any work of the United States Government.” Title 17 U.S.C. 101 defines a U.S. Government work as a work prepared by a military service member or employee of the U.S. Government as part of that person’s official duties.

