


Abstract
Musculoskeletal injuries cost the U.S. Marine Corps approximately $111 million and 356,000 lost duty days annually. Information identifying the most common types of injuries and events leading to their cause would help target mitigation efforts. The purpose of this effort was to conduct an archival data review of injuries and events leading to injury during recruit training. An archival dataset of Marine recruits from 2011 to 2016 was reviewed and included 43,004 observations from 28,829 unique individuals. Injuries were classified as mild, moderate, and severe and categorized into new overuse, preexisting overuse, and traumatic. Injury classification and categorization were stratified by event in which the injury occurred. The majority of injuries were due to overuse, and the most common types were sprains, strains, iliotibial band syndrome, and stress fractures, which constituted over 40% of all injuries. Conditioning hikes were the primary event leading to injury, with 31% of all injuries occurring during this training; running claimed 12%. Most injuries sustained during basic training comprised sprains and strains. Marines who remained uninjured during basic training outperformed those who reported at least one injury on fitness tests. These results point to enhanced conditioning as a potential entry point to target future intervention efforts.
INTRODUCTION
Personnel loss compromises military readiness and represents a significant problem for the military. Musculoskeletal injuries (MSKIs) are a leading source of personnel loss or the classification of “not fit for full duty” among warfighters. These losses are estimated to cost the U.S. Marine Corps approximately $111 million and 356,000 lost duty days each year.1 Epidemiological studies have reported statistically significant associations between MSKIs and low fitness levels,2,3 suggesting that improvements in physical fitness could potentially decrease the incidence of MSKI. Further, several recent studies with military personnel have shown that performance on the functional movement screen, Y-Balance Test, dorsiflexion range of motion test, single-leg hop test, and aerobic fitness tests have the potential to detect MSKIs in personnel performing intense training evolutions.4,5 Among U.S. Marine Corps personnel, the prevalence of MSKI is the greatest in young Marines and during training periods requiring high volumes of vigorous exercise. Accordingly, interventions aimed at decreasing MSKI may be most beneficial when initiated before or during periods of vigorous, high-volume training. However, there is little understanding as to the source of MSKIs sustained during recruit training and which specific training events induce injury and the type of injury sustained.
A recent report from the Center for Naval Analyses (CNA) found that greater fitness levels were associated with lower rates of injury in a large sample of both male and female Marines: 4.6% for the least fit, 3.6% for the moderately fit, and 2.4% for the fittest groups.6 The CNA report concluded that performance on the Initial Strength Test (IST) was a good predictor of injury in training. However, it is important to note that while fitness may be associated with injury, it is not an adequate predictor of injury (i.e., even those in the “poorest” fitness category, as defined by the IST, still had a greater than 95% chance of remaining uninjured throughout training). Therefore, an important next step is to identify critical training events that are most likely to lead to injury (distinguished by type and severity of the injury sustained). Thus, the purpose of this effort was to conduct an archival data review and determine: (1) the prevalence of MSKI, (2) the events in which the most injuries occur, and (3) if there is a relationship between performance on annual physical fitness assessments and injury. The overall goal was to identify the event and injury type, as well as the fitness level required to reduce risk of injury, so that effective interventions may be implemented to reduce injury risk.
METHODS
Database Search
Prevention program data and injury data within the Marine Corps Training Information Management System were searched to determine the prevalence of reported MSKI among male infantry Marines (military occupational specialty [MOS] 03XX; designations listed in Table I) at Marine Corps Recruit Depot (MCRD), San Diego, California prior to entry into the School of Infantry. Data were stratified by injury type (e.g., stress fracture, fractures, and soft-tissue injuries, such as sprains and strains) and general causal type (e.g., traumatic, new overuse, or a preexisting overuse injury). The main training event (e.g., conditioning hike, running, the “Crucible”) on which the Marine was injured was also recorded. The injury data were studied in the context of each fitness test conducted at MCRD (IST, Physical Fitness Test [PFT], and Combat Fitness Test [CFT]); reported fitness scores were expressed as means. This study was approved by the Institutional Review Board at Naval Health Research Center and adhered to the Department of the Navy’s human research protection policies (Protocol NHRC.2016.0023).
Injury Frequencies by MOS by Various Fitness Test
| MOS | IST Frequency | PFT Frequency | CFT Frequency |
|---|---|---|---|
| 0300: Basic Infantry Marine | 681 | 86 | 97 |
| 0302: Infantry Officer | 9 | 1 | 1 |
| 0311: Rifleman | 2,256 | 572 | 245 |
| 0313: Light Armor Vehicle Marine | 106 | 23 | 23 |
| 0321: Reconnaissance Marine | 48 | 5 | 2 |
| 0331: Machine Gunner | 384 | 104 | 82 |
| 0341: Mortarman | 465 | 131 | 82 |
| 0351: Infantry Assault Marine | 172 | 49 | 20 |
| 0352: Anti-tank Missile Gunner | 177 | 51 | 18 |
| 0365: Infantry Squad Leader | 0 | 2 | 0 |
CFT, combat fitness test; IST, initial strength test; MOS, military occupational specialty; PFT, physical fitness test.
The master archival dataset of injuries used in this study spanned 6 years, from 2011 to 2016. In total, the dataset included 43,004 observations across these years from 28,829 unique individuals (in some cases, multiple observations were reported for a single individual to indicate multiple injuries). Furthermore, to address cases in which measured values (e.g., PFT pull-ups) failed to reside within plausible bounds for those variables (e.g., pull-ups >200 repetitions, run time = 0 s), a trimmed version of the records were used—values between the 1st and 99th percentiles of the data. To quantify differences in fitness components, Welch’s unpaired t-tests were employed to account for unequal sample size variation and the α-level was set to 0.01 to reduce Type I error rate. To quantify the magnitude of the fitness differences between injured and uninjured recruits, the size of each effect, expressed as a standardized mean difference (Cohen’s d), was calculated for each comparison. Following Cohen’s conventions, interpretations of effects are as follows: d = 0.20 as small, d = 0.50 as medium, and d ≥ 0.80 as large. Results are reported as mean ± standard deviation (SD).
Fitness Test Design
There are three designated fitness tests performed by Marine recruits at MCRD: IST, PFT, and CFT. The IST is performed on the first day at MCRD (Forming Day) and includes a maximum pull-up and crunch test (2-minute time limit), as well as a 1.5-mile timed run. Minimum repetitions for male recruits for the three IST events are: 2 pull-ups, 35 crunches, and 13 min 30 s (810 s) run. The PFT is completed on training days 22, 48, and 57 of MCRD boot camp and includes a maximum pull-up and crunch test (2-minute time limit), as well as a 3-mile timed run. The CFT is completed twice during boot camp on days 41 and 51 and consists of an 800-m sprint, simulating movement to contact, immediately followed by 2-min of overhead ammunition can lifts (30 lb). Directly after ammunition can lifts, recruits move to the maneuver under fire (MANUF) task, which is a series of sprints, crawls, casualty drags, and ammunition carries (300 yd). The IST, PFT, and CFT are then scored on a sliding scale and a composite score is generated.
RESULTS
Injuries and the Initial Strength Test, Physical Fitness Test, and Combat Fitness Test
The first analysis of injury data was from individuals who had at least one IST score paired with an injury, with the fitness test occurring before the injury. This particular dataset contained 4,298 observations of injury from 2,881 unique individuals; therefore, some subjects had more than one IST score. In comparison, the dataset from uninjured Marines contained 26,130 observations from 25,885 unique individuals. Thus, the prevalence of injuries observed is 14.1% of total IST observations. The MOSs included in this analysis were: 0300, 0302, 0311, 0313, 0321, 0331, 0341, 0351, and 0352 for those who were injured, with frequencies identified in Table I. Breakdown of injury types for the IST is provided in Table II and listed by frequency and proportion. The most common injuries were strains, sprains, and iliotibial band syndrome (ITBS), which accounted for 47% of all injuries (rare injuries <1% total proportion were excluded). Further analysis revealed the frequency and proportion of activities being performed when injuries were sustained, with 30% of injuries attributed to overuse-nonspecific activities (rare activities <1% total proportion were excluded; Table III).
Injury Frequencies and Proportions for Specific Injury Type by Various Fitness Test
| Injury Type | IST | PFT | CFT | |||
|---|---|---|---|---|---|---|
| Frequency (%) | Proportion | Frequency (%) | Proportion | Frequency (%) | Proportion | |
| Sprain | 831 (2.7) | 0.19 | 193 (0.7) | 0.19 | 93 (0.5) | 0.17 |
| Strain | 732 (2.4) | 0.17 | 135 (0.5) | 0.13 | 87 (0.5) | 0.16 |
| ITBS | 466 (1.5) | 0.11 | 85 (0.3) | 0.08 | 50 (0.73) | 0.09 |
| PFPS | 433 (1.4) | 0.1 | 78 (0.3) | 0.08 | 36 (0.2) | 0.07 |
| MTSS | 346 (1.1) | 0.08 | 43 (0.1) | 0.04 | 29 (0.2) | 0.05 |
| Contusion | 266 (0.9) | 0.06 | 39 (0.1) | 0.04 | 36 (0.2) | 0.07 |
| Inflammation | 249 (0.8) | 0.06 | 19 (0.1) | 0.02 | 3 (<0.1) | 0.01 |
| Tendinitis | 238 (0.8) | 0.06 | 112 (0.4) | 0.11 | 43 (0.2) | 0.08 |
| Stress fracture | 195 (0.6) | 0.05 | 86 (0.3) | 0.08 | 59 (0.3) | 0.11 |
| Fracture | 91 (0.3) | 0.02 | 16 (0.1) | 0.02 | 9 (<0.1) | 0.02 |
| Spasm | 66 (0.2) | 0.02 | 77 (0.3) | 0.08 | 52 (0.3) | 0.1 |
| Bursitis | 60 (0.2) | 0.01 | 27 (0.1) | 0.03 | 11 (<0.1) | 0.02 |
| Fasciitis | 49 (0.2) | 0.01 | 13 (<0.1) | 0.01 | 6 (<0.1) | 0.01 |
| Nerve palsy | 33 (0.1) | 0.01 | 6 (<0.1) | 0.01 | -- | -- |
| Periostitis | 32 (0.1) | 0.01 | -- | -- | -- | -- |
| Plica syndrome | -- | -- | 12 (<0.1) | 0.01 | 6 (<0.1) | 0.01 |
| Impingement | -- | -- | 14 (<0.1) | 0.01 | 5 (<0.1) | 0.01 |
| Avulsion fracture | -- | -- | 8 (<0.1) | 0.01 | 4 (<0.1) | 0.01 |
| Dislocation | -- | -- | 8 (<0.1) | 0.01 | 3 (<0.1) | 0.01 |
| Nerve impingement | -- | -- | 9 (<0.1) | 0.01 | 3 (<0.1) | 0.01 |
| Cellulitis | -- | -- | 10 (<0.1) | 0.01 | ||
The most common injuries were strains, sprains, and stress fractures, accounting for 44% of all injuries (rare activities < 1% were excluded). Frequency is the absolute number of injuries observed per injury type and (%) is the incidence rate of injuries observed related to the total number of observations. Proportion is the portion of a particular injury compared to the total number of observed injuries. CFT = Combat Fitness Test; IST = Initial Strength Test; MTSS = medial tibial stress syndrome; PFT = Physical Fitness Test; PFPS = patellofemoral pain syndrome. -- represents no value or value <1% of proportion.
Injury Frequencies and Proportions Across Type of Events in Which Injuries Occurred
| Injury Site | IST | PFT | CFT | |||
|---|---|---|---|---|---|---|
| Frequency (%) | Proportion | Frequency (%) | Proportion | Frequency (%) | Proportion | |
| Overuse-nonspecific | 1,288 (4.2) | 0.30 | 83 (0.3) | 0.08 | 36 (0.6) | 0.07 |
| Conditioning hike | 621 (2.0) | 0.14 | 320 (1.1) | 0.31 | 142 (0.8) | 0.26 |
| Running | 574 (1.9) | 0.13 | 118 (0.4) | 0.12 | 32 (0.2) | 0.06 |
| Crucible events | 402 (1.3) | 0.09 | 86 (0.3) | 0.08 | 66 (0.4) | 0.12 |
| Admin movement | 192 (0.6) | 0.04 | 32 (0.1) | 0.03 | 4 (<0.1) | 0.01 |
| Obstacle course | 184 (0.6) | 0.04 | 22 (0.1) | 0.02 | 8 (<0.1) | 0.01 |
| Basic daily routine | 177 (0.6) | 0.04 | 93 (0.3) | 0.09 | 48 (0.3) | 0.09 |
| Martial arts | 170 (0.6) | 0.04 | 11 (<0.1) | 0.01 | 13 (0.1) | 0.02 |
| PFT/IST | 144 (0.5) | 0.03 | 37 (0.1) | 0.04 | 41 (0.2) | 0.08 |
| Close order drill | 120 (0.4) | 0.03 | -- | -- | -- | -- |
| Confidence course | 76 (0.2) | 0.02 | -- | -- | 4 (<0.1) | 0.01 |
| Basic warrior training | 61 (0.1) | 0.01 | 16 (0.1) | 0.02 | 17 (0.1) | 0.03 |
| CRT | 57 (0.1) | 0.01 | 19 (0.1) | 0.02 | 13 (0.1) | 0.02 |
| Incentive training | 49 (0.1) | 0.01 | 59 (0.2) | 0.06 | 54 (0.3) | 0.10 |
| Weapons training | 44 (0.1) | 0.01 | 38 (0.1) | 0.04 | 12 (0.1) | 0.02 |
| Calisthenics | 40 (0.1) | 0.01 | -- | -- | -- | -- |
| Land navigation, orienteering | 23 (0.1) | 0.01 | 44 (0.1) | 0.04 | 25 (0.1) | 0.05 |
| Recreation | -- | -- | 16 (0.1) | 0.02 | 8 (<0.1) | 0.01 |
| ADL sports | -- | -- | 9 (<0.1) | 0.01 | 8 (<0.1) | 0.01 |
| Motor vehicle | -- | -- | -- | -- | 6 (<0.1) | 0.01 |
| Endurance course | -- | -- | -- | -- | 4 (<0.1) | 0.01 |
| MOUT training | -- | -- | -- | -- | 4 (<0.1) | 0.01 |
Activities that require extensive exertion, or powerful ballistic movement, are the highest culprit of injury. Frequency is the absolute number of injuries observed per injury type and (%) is the incidence rate of the number of injuries observed related to the total number of observations. Proportion is the portion of a particular injury compared to the total number of observed injuries. -- represents no value or value <1%.
The next analysis of the injury data was from individuals who had at least one PFT score paired with an injury, with the fitness test occurring before the injury. This particular dataset contained 1,024 observations of injury from 490 unique individuals. In comparison, the dataset from uninjured Marines contained 28,459 observations from 15,927 unique individuals. Thus, the prevalence of injuries observed is 3.5% of total PFT observations. The MOSs included in this analysis were: 0300, 0302, 0311, 0313, 0321, 0331, 0341, 0351, 0352, and 0365 for those who were injured, with frequencies provided in Table I. Breakdown of injury types for the PFT is provided in Table II and listed by frequency and proportion. The most common injuries were strains, sprains, and tendinitis, which accounted for 43% of all injuries (rare injuries <1% total proportion were excluded). Further analysis of injuries and PFT data revealed the frequency and proportion of activities being performed when injuries were sustained, with 31% of all injuries occurring during a conditioning hike (rare activities <1% total proportion were excluded; Table III).
Subsequent analysis of the injury data was from individuals who had at least one CFT score paired with an injury, with the fitness test occurring before the injury. This particular dataset contained 545 observations of injury from 261 unique individuals. In comparison, the dataset from uninjured Marines contained 17,419 observations from 10,900 unique individuals. Thus, the prevalence of injuries observed is 3.0% of total CFT observations. The MOSs included in this analysis were: 0300, 0302, 0311, 0313, 0321, 0331, 0341, 0351, and 0352 for those who were injured, with frequencies provided in Table I. Breakdown of injury types for the CFT is provided in Table II and listed by frequency and proportion. The most common injuries were strains, sprains, and stress fractures, which accounted for 44% of all injuries (rare injuries <1% total proportion were excluded). Further analysis of injuries and CFT data revealed the frequency and proportion of activities being performed when injuries were sustained, with 26% of all injuries occurring during a conditioning hike (rare activities <1% total proportion were excluded; Table III).
Additionally, the examination of the frequency distribution of IST, PFT, and CFT scores across the broad classification of injury types, revealed a substantial majority of injuries were new overuse injuries, regardless of fitness test association (Table IV).
Injury Frequencies and Proportions Across Broad Category Distinctions
| Injury Type (Broad) | IST | PFT | CFT | |||
|---|---|---|---|---|---|---|
| Frequency (%) | Proportion | Frequency (%) | Proportion | Frequency (%) | Proportion | |
| New overuse | 2,576 (8.5) | 0.61 | 363 (1.2) | 0.36 | 189 (1.1) | 0.37 |
| Traumatic | 1,185 (3.9) | 0.28 | 399 (1.4) | 0.40 | 188 (1.0) | 0.36 |
| Preexisting overuse | 462 (1.5) | 0.11 | 248 (0.8) | 0.25 | 139 (0.8) | 0.27 |
Frequency is the absolute number of injuries observed per injury type and (%) is the incidence rate of the number of injuries observed related to the total number of observations. Proportion is the portion of a particular injury compared to the total number of observed injuries.
Comparing Fitness Between Injured and Uninjured Marines
Comparison of the IST and PFT scores revealed significant differences between the number of pull-ups performed (IST: 13 ± 4.8 vs. PFT: 15 ± 4.2; P < 0.01), the number of crunches performed (IST: 87 ± 16.1 vs. PFT: 98 ± 5.7; P < 0.01), and the total composite score (IST: 217 ± 40.1 vs. PFT: 251 ± 28.2; P < 0.01).
Comparison of IST fitness scores between injured and uninjured Marines revealed that uninjured Marines outperformed injured Marines on every fitness component (Table V). On average, uninjured Marines completed 1 more pull-up than their injured counterparts (p < 0.01). Uninjured marines also completed an average of 3 more crunches than their injured counterparts (p < 0.01); and uninjured Marines ran the 1.5-mile timed run an average of 10.2 seconds faster than their injured counterparts (p < 0.05). Cumulatively, uninjured Marines scored an average of nine points higher on their IST composite score than injured Marines (p < 0.01). Furthermore, comparison of the mean differences in IST fitness scores between injured and uninjured Marines, revealed small effect sizes (Fig. 1) for the overall IST composite score and run component; with the largest separation between injured and uninjured Marines exhibited with the IST composite score.
Descriptive Summary of the IST Composite and Component Scores, Separated by Injury Status (Total vs. Injured vs. Uninjured)
| IST Scores | Status | n | Mean | SD | Median | Min | Max |
|---|---|---|---|---|---|---|---|
| Pull-ups (# completed) | Total | 28,127 | 13 | 4.8 | 13 | 3 | 24 |
| Uninjured | 25,320 | 13 | 4.8 | 13 | 3 | 24 | |
| Injured | 2,807 | 12* | 4.8 | 12 | 3 | 24 | |
| Crunches (# completed) | Total | 27,904 | 87 | 16.1 | 88 | 49 | 127 |
| Uninjured | 25,125 | 87 | 16.0 | 89 | 49 | 127 | |
| Injured | 2,779 | 84* | 17.1 | 84 | 49 | 127 | |
| Run (s) | Total | 27,973 | 656.4 | 57.0 | 657 | 540 | 1,500 |
| Uninjured | 25,135 | 655.3 | 57.1 | 655 | 540 | 1,500 | |
| Injured | 2,838 | 666.5* | 55.2 | 670 | 540 | 858 | |
| Composite score | Total | 28,766 | 217 | 40.1 | 218 | 0 | 300 |
| Uninjured | 25,885 | 218 | 40.0 | 219 | 0 | 300 | |
| Injured | 2,881 | 209* | 40.5 | 209 | 65 | 300 |
Numerical summary of the IST data, comparing results between total, injured, and uninjured Marines. IST, initial strength test; SD, standard deviation; min = minimum value in dataset; max = maximum value in dataset. *p < 0.01, significantly different from uninjured.
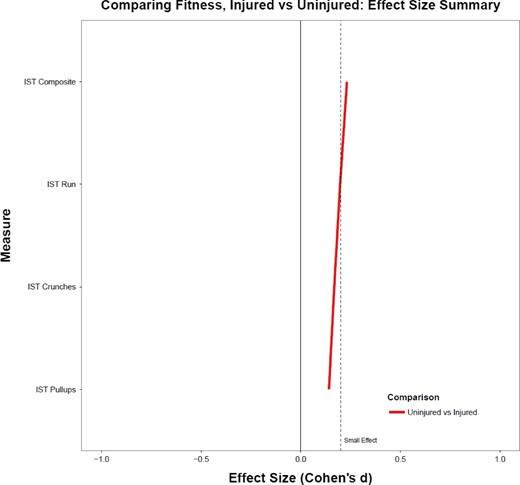
Comparing IST performance differences between injured and uninjured trainees. The relationship is quantified by a standardized mean difference (Cohen’s d).
Comparison of PFT fitness scores between injured and uninjured Marines revealed that uninjured Marines outperformed injured Marines on nearly every fitness component (Table VI). On average, uninjured Marines completed 1 more pull-up than their injured counterparts (p < 0.01); and uninjured Marines ran the 3-mile timed run an average of 17.7 seconds faster than their injured counterparts (p < 0.01). There was, in addition, a very small, but statistically significant difference between uninjured and injured Marines for the number of crunches completed (p > 0.01, d = 0.10). Cumulatively, uninjured Marines scored an average of 7 points higher on their PFT composite score than injured Marines (p < 0.01). Furthermore, comparison of the mean differences in PFT fitness scores between injured and uninjured Marines, revealed small effect sizes (Fig. 2) for the overall PFT composite score, run, and pull-ups; with the largest separation between injured and uninjured Marines exhibited with the PFT composite score.
Descriptive Summary of the PFT Composite and Component Scores, Separated by Injury Status (Total vs. Injured vs. Uninjured)
| PFT Scores | Status | n | Mean | SD | Median | Min | Max |
|---|---|---|---|---|---|---|---|
| Pull-ups (# completed) | Total | 16,292 | 14.9 | 4.2 | 15 | 3 | 24 |
| Uninjured | 15,811 | 15.0 | 4.2 | 15 | 3 | 24 | |
| Injured | 481 | 14.1* | 4.3 | 14 | 3 | 23 | |
| Crunches (# completed) | Total | 16,341 | 98.4 | 5.7 | 100 | 51.5 | 124 |
| Uninjured | 15,858 | 98.4 | 5.7 | 100 | 51.5 | 127 | |
| Injured | 483 | 97.8⊥ | 6.2 | 100 | 64.5 | 121 | |
| Run (s) | Total | 16,407 | 1,286.4 | 96.4 | 1,287 | 785 | 1,634 |
| Uninjured | 15,924 | 1,285.7 | 96.3 | 1,286 | 785 | 1,634 | |
| Injured | 483 | 1,310.2* | 96.2 | 1,317.5 | 1,040 | 1,620 | |
| Composite score | Total | 16,408 | 251.1 | 28.2 | 253.5 | 89 | 300 |
| Uninjured | 15,925 | 251.3 | 28.3 | 253.5 | 89 | 300 | |
| Injured | 483 | 244.0* | 30.0 | 248.0 | 91 | 300 |
Numerical summary of the PFT data, comparing results between total, injured, and uninjured Marines. PFT, physical fitness test; SD, standard deviation; min, minimum value in dataset; max, maximum value in dataset. *p < 0.01, ⊥p < 0.05, significantly different from uninjured.
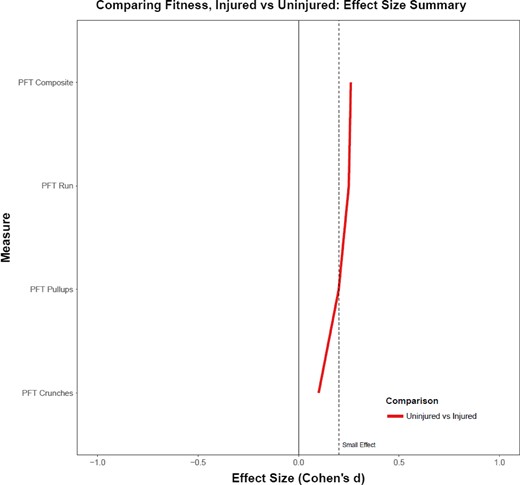
Comparing PFT performance differences between injured and uninjured trainees. The relationship is quantified by a standardized mean difference (Cohen’s d).
Comparison of CFT scores between injured and uninjured Marines revealed that uninjured Marines outperformed injured Marines on nearly every component (Table VII). On average, uninjured Marines completed the movement to contact 3.3 seconds faster than their injured counterparts (p < 0.01); and uninjured Marines ran the MANUF an average of 6.0 seconds faster than their injured counterparts (p < 0.01). However, there were no differences between uninjured and injured Marines for the number of ammo can lifts completed (p > 0.01). Cumulatively, uninjured Marines scored an average of four points higher on their CFT composite score than injured Marines (p < 0.01). Furthermore, comparison of the mean differences in CFT scores between injured and uninjured Marines, revealed small effect sizes (Fig. 3) for the MANUF and overall CFT composite score; with the largest separation between injured and uninjured Marines exhibited with the MANUF.
Descriptive Summary of the CFT Composite and Component Scores, Separated by Injury Status (Total vs. Injured vs. Uninjured)
| CFT Scores | Status | n | Mean | SD | Median | Min | Max |
|---|---|---|---|---|---|---|---|
| Ammunition can lifts (reps) | Total | 11,040 | 97 | 10.8 | 100 | 42 | 132 |
| Uninjured | 10,780 | 97 | 10.8 | 100 | 42 | 132 | |
| Injured | 260 | 96 | 12.2 | 98.5 | 45.5 | 131 | |
| Movement to contact (s) | Total | 11,059 | 173.5 | 13.0 | 173 | 144 | 237 |
| Uninjured | 10,802 | 173.4 | 12.9 | 172.5 | 144 | 237 | |
| Injured | 257 | 176.7* | 13.8 | 177 | 145 | 218 | |
| Maneuver under fire (s) | Total | 10,893 | 149.7 | 15.9 | 148 | 117 | 230 |
| Uninjured | 10,633 | 149.5 | 15.9 | 148 | 117 | 230 | |
| Injured | 260 | 155.5* | 17.0 | 154.5 | 118 | 210.5 | |
| Composite score | Total | 11,160 | 287 | 10.8 | 289 | 223 | 300 |
| Uninjured | 10,900 | 287 | 10.8 | 289 | 223 | 300 | |
| Injured | 260 | 283* | 12.2 | 284.8 | 244 | 300 |
Numerical summary of the CFT data, comparing results between total, injured, and uninjured Marines. CFT, combat fitness test; SD, standard deviation; min, minimum value in dataset; max, maximum value in dataset. *p < 0.01, significantly different from uninjured.
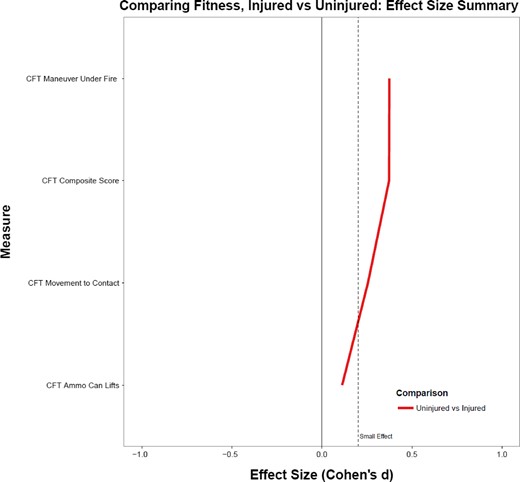
Comparing CFT performance differences between injured and uninjured trainees. The relationship is quantified by a standardized mean difference (Cohen’s d).
DISCUSSION
Overall, it can be concluded that the majority of injuries sustained by Marines during basic training were new overuse injuries, resulting in: sprains, strains, ITBS, and stress fractures. Injuries occurring during a defined activity (i.e., less overuse-nonspecific) were most likely to occur during conditioning hikes and running. Injury prevalence tended to decrease as training progressed and fitness levels increased, suggesting that improved fitness leads to reductions in injury rates.
In regards to potential protective factors against injury, preliminary data analyses across the three fitness tests (IST, PFT, and CFT) conducted at MCRD were consistent with the claim that fitness is associated with reduced injury risk. Commonly, uninjured Marines had higher overall composite scores for each fitness test and faster run times. Performance on the MANUF component (obstacle course) of the CFT produced the greatest differentiation between injured and uninjured Marines, as measured by Cohen’s d. PFT crunches and CFT ammunition can lifts, in contrast, produced comparatively little differentiation, suggesting that core and upper body fitness are not as related to injury rates as running and functional whole body movements. These findings may be explained as a consequence of most injuries occurring to lower extremities (i.e., as a result of overuse injuries); or may be a ceiling effect as observed in the average scores of the CFT components and composite score, which were high for both injured and uninjured Marines. To further illustrate the potential ceiling effect, both injured and uninjured Marines scored in excess of the 91 maximum ammunition can lifts for 100 points (uninjured mean average: 97 lifts; injured mean average: 96 lifts), and composite averages for both groups were well within the 270–300 point range for a first class score average (uninjured mean average: 287; injured mean average: 283). However, this analysis is based on taking the averages of any multiple scores for a particular individual; thus, it is likely that averaging these scores over the course of a 12-week regimen mask initial physical deficiencies and/or the overall training effect for an individual. For example, there are three times (day 22, 48, and 57) during basic training at MCRD that the PFT is conducted. If the Marine took the PFT all three times, then their scores were averaged for each component (e.g., pull-ups) and the mean was reported. Similarly, the CFT is conducted twice during the 12-week regimen (day 41 and 51) and the IST is only conducted once on Forming Day. For future analyses, rather than averaging all fitness tests taken during the training period, a repeated measures approach with order effects may be more revealing. Additionally, examining the injury data relative to the most recent fitness test data could provide evidence of any training effect (improvement in fitness levels) within individuals during the 12-week course and potentially identify physical deficiencies, as well as injury risk, based on a particular fitness metric.
Despite the limitations, the results presented in this study add to a growing body of literature demonstrating that fitness is associated with injury risk.7 In fact, in this study, injury prevalence was reduced over the course of training, while fitness levels tended to increase. The current findings are echoed in epidemiological studies of Army basic training, which consistently find that low levels of aerobic fitness, as measured by 1- or 2-mile run times, are associated with higher risks of injury.3,7–9 Specifically, injury risk for women tested during a 1-mile run increased 25%, from 36% to 61%, when mile times increased 16%, from 9 min to 10.4 min.10 Similarly, injury risk for men tested during a 1-mile run increased 28%, from 14% to 42%, when mile times increased 20%, from 6.4 min to 7.7 min.10 A review conducted by Knapik et al3 also illustrated that slower male or female trainees exhibited higher rates of injuries, across a larger population of new military recruits and cadets from other military services (Air Force or Marine Corps).3 Additionally, just as in the case of aerobic fitness, performance on muscular endurance tasks is also associated with injury risk.
Furthermore, gender differences in injury risk could have important implications for training methods and long-term sustained effort over a career cycle. One way to examine these gender differences is to consider body composition as a potential explanatory variable, given the known average group differences between men and women on key body composition variables (e.g., lean muscle mass, height). Unfortunately, the data sources used in this study did not contain body composition information. Accordingly, future research should continue to examine the relationship between these variables (e.g., height, weight) and injury risk to better differentiate potential underlying causes of the relationship between injury risk and fitness. The current understanding of the relationship between injury risk and a prominent body composition variable – percentage body fat (or estimates based on body mass index [BMI]) – is limited. Discrepant data exist on whether lower or higher levels of body fat are associated with injury, while others show inconsistent findings: mixed associations11; males bimodal association, females no association8; and no association.3,12 Along these lines, a particularly notable study, conducted by the National Research Council, demonstrated a direct relationship between run times and injury risk in women; however, regardless of run time, the highest risks of injury were associated with the leanest women (those with the lowest BMIs).11 Analyses carried out for men showed a similar pattern; the highest risk of injury (28.7%) occurred among the leanest men; and importantly, men who were fast runners with higher BMIs were not as protected from injury as women with higher BMIs. Thus, BMI may be a useful tool or predictor in the determination of injury risk, irrespective of gender.
The results of this study implicate running and conditioning hikes as higher risk events, in terms of producing injuries. However, these events, as part of a comprehensive preparatory training program, are unavoidable. Dismounted military personnel are required to have a high level of aerobic fitness and engage in weight-bearing type activities, such as running and hikes (marching with load), as part of their occupational requirements. It is well understood that load carriage: induces lumbar spine changes, decreases mobility, increases fatigue, increases injury risk, and exacerbates foot blisters, spinal injury and degeneration, muscle tightness, and soreness of the legs, feet, back, and shoulders.13–18 Consistent with these past findings, the results of this study also show a greater risk of injury during conditioning hikes. However, what is not known is if certain body composition or fitness levels may protect against injury during conditioning hikes. Furthermore, if such a relationship exists, it is important to determine the true underlying cause of injuries (e.g., are fitter, leaner trainees at lower injury risk because they are better conditioned) and identify optimal levels of fitness or body composition that may be protective against injury.
CONCLUSIONS
The emerging conclusion, from this and past studies, is that fitness is associated with injury risk (and potentially body composition). Critical training events, such as running and conditioning hikes, tend to exhibit the most injuries during recruit training. However, there is insufficient data bearing on how all of these factors influence injury when collected in concert and analyzed together. The cited literature has focused on one possible predictor – BMI – but this measure is limited since it fails to account for fat mass and fat free mass. Furthermore, the association does not necessarily imply predictive value and, while correlations are evident, causation is not. Future work is needed to develop reliable prediction models that will provide direct, actionable information of injury risk and modifiable characteristics that could mitigate injury risk. Genetics, socioeconomic status, race, age, gender, body composition, nutrition, prior injury history, and training load and volume are all known factors that influence musculoskeletal health. However, of the aforementioned factors, only body composition, nutrition, and training load and volume are modifiable – these factors should, accordingly, figure prominently in any future analyses aimed at developing predictive models of injury risk.
While definitive revelations about the mechanisms of injury have yet to be determined, prospective Marines, soldiers, sailors, and airmen can minimize injury risk. Based on the current findings, in general, if one wants to minimize injury susceptibility during boot camp, they should increase their physical fitness, particularly in activities that require lower body strength and endurance. Another potential mechanism to combat injury prevalence would be to have recruits focus on basic soldiering skills (i.e., load carriage) prior to boot camp entrance; as events that contain load carriage or operationally functional movements tend to be more predictive of injury susceptibility. Currently, the U.S. Army employs an occupational physical assessment test (OPAT) prior to entrance into a combat MOS; a similar test may be useful for the Marine Corps, to identify those who may need further training prior to their entrance to boot camp.
In summary, the findings from this effort demonstrate that injuries sustained during recruit training are primarily new sprains and strains and the products of overuse (and potential overtraining and insufficient recovery). Moreover, these injuries are most likely due to aerobic conditioning and extended duration tasks, such as running and conditioning hikes, rather than more static, strength-based events. While the data suggest that initial screening tests for Marine Corps recruits could be an indicator of injury risk, more work is needed to expand on these collective findings and to determine mitigation strategies.
Previous Presentations
Presented at the 2017 Military Health System Research Symposium, Kissimmee, FL; abstract # MHSRS-18-0937.
Funding
This research study was supported by the Office of Naval Research-Code 30 under work unit no. N1627. This supplement was sponsored by the Office of the Secretary of Defense for Health Affairs.
References
Author notes
I am a military service member (or employee of the U.S. Government). This work was prepared as part of my official duties. Title 17, U.S.C. §105 provides the “Copyright protection under this title is not available for any work of the United States Government.” Title 17, U.S.C. §101 defines a U.S. Government work as work prepared by a military service member or employee of the U.S. Government as part of that person’s official duties. Report No. 18-XX was supported by the Office of Naval Research under work unit no. N1627. The views expressed in this article are those of the authors and do not reflect the official policy or position of the Department of the Navy, Department of the Army, Department of the Air Force, Department of Veterans Affairs, Department of Defense, or the US Government. Approved for public release; distribution is unlimited. Human subjects participated in this study after giving their free and informed consent. This research has been conducted in compliance with all applicable federal regulations governing the protection of human subjects in research (Protocol NHRC.2016.0023).

