


Abstract
Section 718 of the Fiscal Year 2017 (FY17) National Defense Authorization Act (NDAA) outlines many reportable telemedicine outcomes. While the Military Health System Data Repository (MDR) and the Management and Reporting Tool M2 provide some telemedicine analyses, there are many outcomes that neither the MDR nor M2 provide. Understanding patient and provider attitudes towards telehealth and specialty-specific usage may assist initial or ongoing telehealth lines of effort within Defense Health Agency Medical Treatment Facilities (DHA MTFs).
A retrospective descriptive analysis of synchronous virtual health (VH) encounters and results from three internally developed telehealth surveys for calendar year (CY) 2016 was conducted.
Three thousand seven hundred and seventy-eight synchronous VH visits for 2,962 unique patients were completed by 142 providers located within 27 distinct specialty clinics. 89.8% of patients were adults and 75.9% were Active Duty. Skill type I and II medical providers conducted 1,827 new consultations, 1,187 follow-up visits, and 371 readiness exams. Overall, specialty-specific VH use ranged from less than 1% to 39.9%. Patient satisfaction was 98% while provider satisfaction ranged from 91% to 93%. Additionally, significant intangible savings were recognized.
Regional medical centers conducting synchronous VH will require both internal and external data sources to report Section 718 outcomes required by Congress. As the anticipated demand for direct provider-to-patient telehealth increases, understanding these outcomes may aid initial and ongoing efforts in other military treatment facilities conducting synchronous VH.
BACKGROUND
Virtual health (VH) has been identified as a healthcare priority for the Military Health System (MHS) within the Army Campaign 2020 and the military’s selection of Brooke Army Medical Center (BAMC) as the Army’s first virtual medical center with dedicated Program Objective Memorandum (POM) funding.1 However, BAMC and other VH hubs will be required to report congressionally mandated, telehealth-specific outcomes outlined in Section 718 (Telemedicine) of the Fiscal Year 2017 (FY17) National Defense Authorization Act (NDAA).2 Recently, a Government Accountability Office report highlighted some telemedicine outcomes obtained from the MHS Data Repository (MDR) and the Management and Reporting Tool M2, but many outcomes, which can only be performed by detailed internal analyses and surveys, are still needed.3
Within Regional Health Command Europe (RHCE), Landstuhl Regional Medical Center (LRMC) is the only Role 4 United States military treatment facility (MTF). LRMC supports approximately 200,000 beneficiaries within United States European Command (USEUCOM), United States Central Command (USCENTCOM), and United States Africa Command (USAFRICOM) (Fig. 1). The majority of these beneficiaries are enrolled in Army, Air Force, and Navy health clinics located in Germany, Italy, and Belgium.
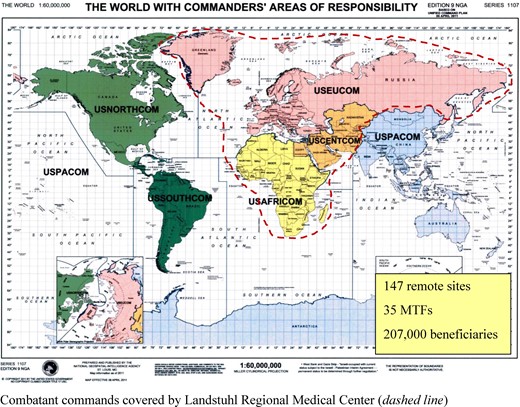
RHCE Commander’s Area of Responsibility Combatant commands covered by Landstuhl Regional Medical Center (dashed line).
Prior to 2014, telehealth efforts in RHCE focused on behavioral health and a few surgical subspecialties; however, in late 2014 the European Advancement for Regional Telehealth (EARTH) project was launched hiring specialty-trained telehealth presenters who directly supported multispecialty synchronous telehealth expansion.4 However, we are aware of only one publication reporting multispecialty synchronous telehealth outcomes from a role 4 or 5 MTF.5 Despite this information, many aspects of multispecialty synchronous VH remain unknown. Recognizing Section 718 requirements and the future expansion of synchronous VH, the LRMC VH team continued its analysis of synchronous VH in calendar year 2016 (CY16) and also developed two internal surveys to address other reportable aspects of Section 718.
Herein, we report the outcomes required by the FY17 NDAA for LRMC based on CY16 synchronous VH encounters. In addition, understanding tangible and intangible outcomes from both originating and distant site locations will not only meet congressional requirements but will enhance planned synchronous telehealth implementation across the MHS.
METHODS
The primary objective of this 1-year retrospective review was to determine the number, type, and complexity of synchronous VH encounters conducted per specialty. Secondary objectives included reporting elements required by the FY17NDAA Section 718 and assessing tangible and intangible telehealth revenue and savings, respectively.
Patient satisfaction was measured using an anonymous patient satisfaction survey which patients complete immediately following their VH visit (Appendix 1). A second fillable pdf survey was developed by the LRMC telehealth staff to understand healthcare provider’s opinions and attitudes regarding synchronous VH. The survey was refined through three cognitive interview sessions with 6–8 providers who conducted synchronous VH visits at LRMC (Appendix 2). Once finalized, the survey was emailed through the hospital’s enterprise email system to all LRMC providers who had conducted at least one synchronous VH visit in the past three years. The survey was resent once a week for 2 additional weeks to garner additional responses from initial non-responders.
The LRMC VH team also developed a survey for medical assistants (MAs) who were responsible for booking all synchronous telehealth appointments within their respective clinics. These written surveys were dropped off at each clinic who had MAs who booked synchronous VH visits. A secure, HIPAA-compliant telehealth appointment booking tool which was developed by LRMC Clinical Operations staff allowed MAs to simultaneously view both the originating site telehealth cart availability and the provider’s clinic schedule when booking a patient VH appointment. Once the appointment was booked, the RHCE Telehealth support team generated an email to both the patient’s preferred email address and the specialty provider’s enterprise email with an appointment reminder. Recognizing this unique scheduling platform (i.e., patients did not call the usual central appointment booking cell), the regional telehealth team’s service coordinators developed a 9-question MA-specific survey. Data regarding total VH and in-person outpatient encounters for each specialty were provided by the LRMC telehealth hub team and the LRMC Clinical Operations Division, respectively.
Descriptive statistics were used for patient demographics, specialty details, and intangible outcomes. Descriptive statistics, factor analysis, multivariate analysis of variance, and one-way analysis of variance were performed on patient and provider satisfaction results using SPSS statistical software (IBM, Armonk, NY, USA). A paired t-test using free web-based statistical software (www.socscistatistics.com) was utilized to compare in-person versus telehealth outcomes for scheduling requirements. An α < 0.05 was considered statistically significant. Study approval was obtained by the LRMC Human Research Protection Program and all patients provided written consent to conduct a telehealth appointment.
RESULTS
From January to December 2016, a total of 3,778 synchronous VH visits were completed for 2,962 unique patients. The majority of patients were adults (89.8%), Active Duty (75.9%), and only participated in one synchronous VH visit (58.7%). Median (range) visits for patients were 1(1–9) while median (range) number of encounters per location was 27.5 (1–734). Synchronous VH visits were conducted by 142 distinct healthcare providers located within 27 distinct specialty clinics who connected to 22 unique originating patient locations. The Virtual Integrated Patient Readiness and Remote (VIPRR) care clinic, staffed by one MA and one 0.8 FTE physician assistant, performed readiness exams to individual Soldiers located in one of 16 remote locations within USEUCOM, USCENTCOM, and USAFRICOM (Table I).
Originating Site Telehealth Usage and Estimated Intangible Savings
| Originating Site | Number of encounters | % Usage by Local Pop. | Miles (roundtrip)a | Days (roundtrip)b | Time Savings (days) | Travel Savings (miles) | Per Diem Savingsc |
|---|---|---|---|---|---|---|---|
| Correctional Facility, Sembach, Germany | 9 | NP | 0 | 0 | 0 | 0 | 0.0 |
| Baumholder AHC | 7 | 0.2 | 55.8 | 0.5 | 3.5 | 390.6 | 210.9 |
| Brussels AHC | 29 | 3.7 | 421.2 | 2 | 58 | 12,214.8 | 6,596.0 |
| Eskan Village, Saudi Arabia | 15 | NP | 6,100.8 | 7 | 105 | 91,512 | 49,416.5 |
| Grafenwoehr AHC | 325 | 4.0 | 537.6 | 2 | 650 | 174,720 | 94,348.8 |
| Hohenfels AHC | 79 | 3.5 | 452.4 | 1 | 79 | 35,739.6 | 19,299.4 |
| In-home | 26 | NP | 210 | 1 | 26 | 5,460 | 2,948.4 |
| Izmir, Turkey | 1 | NP | 3,192 | 7 | 7 | 3,192 | 1,723.7 |
| Katterbach AHC | 132 | 3.1 | 326.4 | 1 | 132 | 43,084.8 | 23,265.8 |
| Lakenhealth Air Base | 1 | NP | 1,017.6 | 3 | 3 | 1,017.6 | 549.5 |
| Livorno AHC | 1 | 0.2 | 1,260 | 5 | 5 | 1,260 | 680.4 |
| Mihail Kogalniceanu, Romania | 5 | NP | 2,510.4 | 4 | 20 | 12,552 | 6,778.1 |
| Naples Naval Air Station | 1 | NP | 1,687.2 | 4 | 4 | 1,687.2 | 911.1 |
| Stavanger, Norway | 1 | NP | 1,806 | 5 | 5 | 1,806 | 975.2 |
| Shape AHC | 470 | 13.5 | 452.4 | 2 | 940 | 212,628 | 114,819.1 |
| Sigonella Naval Air Station | 2 | NP | 2,408 | 5 | 10 | 4,816 | 2,600.6 |
| Spangdahlem Air Base | 94 | 1.9 | 200.4 | 1 | 94 | 18,837.6 | 10,172.3 |
| Stuttgart AHC (2 locations) | 539 | 5.6 | 232.8 | 1 | 539 | 125,479.2 | 67,758.8 |
| Vicenza AHC | 339 | 4.0 | 1,012.8 | 5 | 1695 | 343,339.2 | 185,403.2 |
| VilseckAHC | 734 | 9.2 | 463.2 | 2 | 1468 | 339,988.8 | 183,594.0 |
| Wiesbaden AHC | 594 | 10.1 | 128.4 | 1 | 594 | 76,269.6 | 41,185.6 |
| VIPRR Clinic (16 countries) | 371 | NP | Varies | 5 | 1870 | NP | 1,302,000 |
| Total | 3,778 | 8,307.5 | 1,505,995 | 2,115,237.3 |
aCalculated using Google Maps (https://maps.google.com).
bEstimated based on driving distance and country;
c2016 Joint Travel Regulation reimbursement of $0.54 per mile (does not include lodging and M + IE); NP, not performed.
Licensed independent providers conducted 1,827 new consultations, 1,187 follow-up visits, and 371 readiness exams. The remaining encounters were performed by credentialed providers such as nutritionists, psychologists, and therapists. VH visit E + M complexity ranged from 99211 to 99205 with an average work relative value unit (wRVU) for new and follow-up visits of 1.46 and 1.02, respectively.
Overall service utilization ranged from less than 1% to 39.9%. Eight clinics, to include sleep medicine, outpatient nutrition, the VIPRR clinic, orthopedics, general surgery, behavioral health, allergy, and otolaryngology accounted for 80.1% of all telehealth visits (Table II). LRMC Clinical Operations provided total outpatient visits for 26 (96.4%) specialties engaged in synchronous VH in CY16. One specialty, pre-op/anesthesia, did not have a defined Medical Expense and Performance Reporting System code but only accounted for 24 (0.6%) VH visits. Individual specialty VH usage as a percentage of the specialty’s total outpatient visits varied greatly with a median (range) of 2.1% (0.1–39.9%) (Table II). Excluding the VIPRR clinic, nineteen (70.4%) specialties utilized telehealth for at least 1% of their outpatient visits while five (18.5%) specialties utilized VH for more than 5% of outpatient encounters (Table II). The 3,778 telehealth visits represented 3.5% (3,778/107,887) of all outpatient visits for these 27 specialties. Mean monthly provider documentation compliance with “GT” synchronous telehealth modifier in the AHLTA disposition section was 80.6 ± 3.9%. Mean monthly originating site compliance with the Q3014 Originating Site Fee code was 92.8 ± 2.6%.
January–December 2016 Synchronous Telehealth (sTH) Encounters
| Specialty | # TH Visits | % all sTH | % All Servicea | % SPECb |
|---|---|---|---|---|
| Sleep medicine | 1,296 | 34.3 | 28.4 | 67.0 |
| Nutrition | 405 | 10.7 | 14.1 | 52.6 |
| Virtual Integrated Patient Readiness and Recapture (VIPRR) clinic | 371 | 9.8 | 39.9 | 100.0 |
| Orthopedic surgery | 284 | 7.5 | 1.5 | 26.1 |
| General surgery | 205 | 5.4 | 4.5 | 44.9 |
| Behavioral health | 185 | 4.9 | 1.5 | 18.0 |
| Allergy | 157 | 4.2 | 9.8 | 61.8 |
| Otolaryngology | 126 | 3.3 | 2.5 | 66.1 |
| Pain management | 85 | 2.2 | 1.7 | 3.9 |
| Pediatric developmental | 80 | 2.1 | 19.1 | 71.8 |
| Pediatric gastroenterology | 75 | 2.0 | 24.3 | 61.6 |
| Podiatry | 74 | 2.0 | 2.5 | 20.0 |
| Neurosurgery | 63 | 1.7 | 2.7 | 37.9 |
| mTBI | 51 | 1.3 | 2.8 | 25.0 |
| Urology | 51 | 1.3 | 2.3 | 76.6 |
| Occupational therapy | 40 | 1.1 | 1.3 | 0.0 |
| Pulmonary | 39 | 1.0 | 3.0 | 34.3 |
| OB/GYN | 36 | 1.0 | 0.3 | 44.1 |
| Cardiology | 31 | 0.8 | 0.8 | 46.7 |
| Rheumatology | 24 | 0.6 | 1.6 | 8.7 |
| Pre-op/anesthesia | 24 | 0.6 | NP | 100.0 |
| Endocrinology | 20 | 0.5 | 1.7 | 42.1 |
| Physical medicine and rehabilitation | 19 | 0.5 | 0.2 | 70.6 |
| Hematology/oncology | 12 | 0.3 | 1.0 | 75.0 |
| Plastic surgery | 10 | 0.3 | 0.9 | 33.3 |
| Speech pathology | 9 | 0.2 | 0.5 | 0.0 |
| Infectious disease | 3 | 0.1 | 0.3 | 33.3 |
| Neurology | 3 | 0.1 | 0.1 | 0.0 |
| Total | 3,778 |
aPercent all encounters conducted via sTH for that specialty.
bPercent of sTH visits that are new visits.
Forty-eight (33.8% survey response) providers returned a survey from 22 specialty clinics. Two providers indicated they had not performed any synchronous telehealth encounters and were not included in the analysis. Median (range) survey response per specialty was 2 (1–8). Eight surveys were completed for behavioral health providers, 13 for medicine specialties, 15 for surgical services, and 10 for primary care providers. 89.1% were either Skill Type I (i.e., M.D./D.O.) or Skill Type 2 (i.e., Nurse Practitioner or Physician Assistant). Providers from four different disciplines differed significantly for 15 of the 42 questions (Table III). Generally, medicine specialties and primary care had a more favorable opinion of synchronous telehealth compared to behavioral health and surgical subspecialties. Overall, 42 (91%) providers felt that patients appreciated being able to see them through telehealth and 43 (93%) providers responded that telehealth was a valuable resource for patients.
Provider Responses Towards Synchronous Telehealth*
| Behavioral health | Medicine subspecialties | Surgical specialties | Primary care | p* | |
|---|---|---|---|---|---|
| # surveys returned | 8 | 13 | 15 | 10 | |
| The training I received was appropriate | 3.88 (0.6) | 4.31 (0.5) | 4.47 (0.6) | 4.5 (0.7) | 0.30 |
| Using the desktop computer application for telehealth is easy | 3.75 (1.1) | 4.46 (0.6) | 4.33 (0.6) | 4.5 (0.7) | 0.33 |
| My patients appreciate being able to see me via telehealth | 4.13 (0.6) | 4.69 (0.5) | 4.8 (0.4) | 4.2 (0.9) | 0.06 |
| How often does the patient presenter understand my specialty needs during the visit? | 3.13 (0.8) | 3.92 (0.8) | 3.9 (0.7) | 4.1 (0.9) | 0.31 |
| How often do NEW patients who I see via telehealth still have to see me IN-PERSON for a follow-up visit? | 1.88 (1.3) | 3.23 (0.7) | 2.8 (1.1) | 2.5 (1.4) | 0.27 |
| How often do patients who I see via telehealth for a FOLLOW-UP visit still have to see me IN-PERSON for an additional follow-up visit? | 1.75 (0.7) | 2.54 (0.6) | 2.13 (1.0) | 2.1 (0.9) | 0.62 |
| Telehealth visits are incorporated into my normal clinic template | 3.63 (1.0) | 4.08 (0.7) | 3.87 (0.8) | 3.80 (1.3) | 0.84 |
| How often is evaluating patients IN-PERSON MORE personally satisfying than seeing patients via telehealth? | 4.75 (0.7) | 3.31 (0.7) | 3.93 (1.1) | 3.2 (1.1) | <0.01 |
| Telehealth saves the patient time | 3.75 (0.4) | 4.92 (0.3) | 4.6 (0.7) | 4.6 (0.5) | 0.01 |
| Telehealth saves the patient or their unit money | 3.63 (0.5) | 4.85 (0.5) | 4.8 (0.4) | 4.6 (0.5) | <0.001 |
| Telehealth is a valuable resource for patients | 4.13 (0.6) | 4.92 (0.3) | 4.47 (0.9) | 4.7 (0.5) | 0.08 |
| My overall interest in using telehealth has decreased since I first starting using it | 2.5 (1.0) | 1.92 (1.1) | 2.07 (1.2) | 1.90 (1.0) | 0.34 |
| I need additional technical training on using the computer telehealth application | 2.13 (0.8) | 1.85 (0.9) | 1.87 (1.0) | 1.8 (0.4) | 0.51 |
| It was cumbersome to be credentialed for telehealth at other locations | 2.0 (0) | 2.0 (0.9) | 2.27 (1.1) | 3.0 (1.0) | 0.31 |
| Telehealth is integrated into my normal clinic schedule | 3.75 (0.7) | 4.15 (0.8) | 3.93 (0.6) | 3.9 (1.0) | 0.76 |
| Scheduling telehealth visits seems easy for my staff | 3.25 (0.7) | 3.46 (1.1) | 3.64 (0.7) | 3.9 (1.0) | 0.47 |
| How often would conducting a NEW telehealth visit to the patient’s home be as good as a NEW telehealth visit to a clinic site? | 2.43 (1.5) | 2.77 (1.0) | 3.07 (1.3) | 3.5 (0.8) | 0.24 |
| How often would conducting a FOLLOW-UP telehealth visit to the patient’s home be as good as a telehealth visit to a clinic site? | 2.86 (1.5) | 3.46 (0.8) | 3.5 (1.1) | 3.5 (0.8) | 0.49 |
| How often does it take MORE time to see a NEW patient via telehealth compared to an IN-PERSON visit? | 3.25 (1.2) | 2.15 (0.5) | 2.93 (1.3) | 2.63 (1.2) | 0.28 |
| How often does it take MORE time to see a FOLLOW-UP patient via telehealth compared to an IN-PERSON visit? | 2.88 (1.3) | 2.08 (0.5) | 2.5 (1.3) | 2.4 (0.9) | 0.62 |
| I have a favorable opinion of telehealth as an option for patients | 3.63 (0.7) | 4.69 (0.5) | 4.33 (0.5) | 4.5 (0.7) | <0.001 |
| My clinical leadership supports telehealth | 4.0 (0) | 4.85 (0.4) | 4.53 (0.7) | 4.7 (0.5) | <0.01 |
| My clinical leadership wants me to do more telehealth | 3.75 (0.7) | 3.69 (0.8) | 3.87 (0.8) | 4.0 (0.9) | 0.45 |
| I prefer to see patients only at specific clinic sites | 2.75 (0.8) | 2.62 (0.7) | 2.4 0(1.1) | 1.89 (0.9) | 0.35 |
| How often is telehealth well-suited to evaluate NEW patients? | 2.13 (0.6) | 3.38 (0.9) | 3.2 (0.9) | 4.0 (0.6) | <0.001 |
| How often is telehealth well-suited to evaluate FOLLOW-UP patients? | 3.5 (0.9) | 4.0 (0.6) | 3.8 (0.9) | 4.2 (0.7) | 0.14 |
| How often is the audio connection clear? | 4.0 (0.5) | 4.31 (0.8) | 4.53 (0.7) | 4.5 (0.7) | 0.10 |
| How often is the video connection clear? | 4.13 (0.6) | 4.31 (0.8) | 4.53 (0.5) | 4.6 (0.7) | 0.13 |
| How often is the patient presenter technically competent when using the telehealth equipment? | 3.75 (0.8) | 4.23 (0.6) | 4.2 (0.8) | 4.7 (0.5) | 0.11 |
| How often are you able to connect within 15 minutes of the appointment time? | 4.25 (0.8) | 4.77 (0.4) | 4.67 (0.6) | 4.9 (0.3) | 0.03 |
| How often are you on-time (<15 min from appointment time) to see your IN-PERSON clinic patients? | 4.5 (0.7) | 4.15 (0.7) | 4.4 (0.7) | 4.8 (0.4) | 0.30 |
| How often do you add the “GT” modifier to the AHLTA note? | 4.63 (0.5) | 4.77 (0.4) | 3.67 (1.7) | 4.5 (0.5) | 0.11 |
| A telehealth visit is better than a telephone call for FOLLOW-UP visits | 4.0 (0.9) | 4.31 (0.8) | 3.73 (0.9) | 4.6 (0.8) | 0.09 |
| How often do you use the Share Content feature? | 1.38 (0.7) | 2.38 (1.3) | 1.87 (1.2) | 3.9 (0.9) | <0.01 |
| How often are service-specific screening/intake forms completed by the time of the telehealth appointment? | 2.88 (1.4) | 3.0 (0.9) | 2.71 (0.9) | 2.70 (1.7) | 0.95 |
| What percentage of NEW patients do you think you would like to see via telehealth? | 12.2 (16) | 32.1 (27) | 8.5 (5) | 36.6 (29) | 0.02 |
| What percentage of FOLLOW-UP patients do you think you would like to see via telehealth? | 24.3 (23) | 46.7 (30) | 43.8 (32) | 47.5 (28) | 0.4 |
| On average, a NEW telehealth visit takes how many minutes? | 71.3 (12) | 34.4 (9) | 28.5 (11) | 50.5 (12) | <0.001 |
| On average a FOLLOW-UP telehealth visit takes how many minutes? | 40.4 (11) | 21.7 (6) | 18.8 (8) | 38.6 (11) | <0.001 |
| On average, a NEW IN-PERSON visit takes how many minutes? | 77.5 (13) | 41.7 (13) | 30.2 (13) | 54.8 (14) | <0.001 |
| On average, a FOLLOW-UP IN-PERSON visit takes how many minutes | 48.3 (13) | 23.9 (7) | 16.9 (8) | 38.6 (11) | <0.001 |
| How often do you use the following telehealth cart features? | |||||
| Otoscope for EAR exam | 1.0 (0) | 1.62 (1) | 1.87 (1) | 1.0 (0) | 0.11 |
| Otoscope for NASAL exam | 1.0 (0) | 1.69 (1) | 1.87 (1) | 1.0 (0) | 0.10 |
| HD camera for ORAL exam | 1.0 (0) | 2.38 (1.5) | 2.40 (2) | 1.0 (0) | 0.01 |
| Stethescope | 1.0 (0) | 1.77 (0.8) | 1.6 (1) | 1.0 (0) | 0.049 |
| Bladder scanner | 1.0 (0) | 1.0 (0) | 1.2 (0.5) | 1.0 (0) | 0.51 |
*Results are presented as the mean (standard deviation) based on a 5-point Likert scale.
Nine-hundred and fifty-nine (25.4% response rate) anonymous patient surveys were completed. Reported patient satisfaction with their telehealth visit was 97.9% (939/959) while 98.0% (940/959) would also use telehealth again. Nine-hundred fourteen patients answered the final question regarding whether they would need to see the provider in person; 396 (43.3%) responded “no,” 198 (21.7%) answered “maybe,” and 320 (35.0%) reported “yes.” The patient survey demonstrated excellent consistency with a Cronbach’s alpha of 0.91. Further, when comparing patient satisfaction with the need to be seen in-person there was no difference between the reported and expected count regarding the need to be seen in-person and patient satisfaction.
The RHCE telehealth team received 28 MA responses from 19 distinct clinics. MAs reported significantly longer time required to book a telehealth appointment compared to an in-person clinic appointment (10.3 ± 6.6 vs 2.8 ± 1.4 minutes, P < 0.001) (Table IV). Seventeen (61%) MAs only reported having to book up to one telehealth appointment per week while 9 (32%) booked 2–5 telehealth appointments per week. Interestingly, the remaining two MAs who were assigned to the busiest telehealth service, sleep medicine, reported booking more than 10 telehealth appointments per week but had a mean time required for booking of 3.75 minutes compared to all other clinic MAs (11 ± 7 minutes).
Clinic Booking Staff Attitudes and Opinions
| # unique clinics surveyed | 19 |
| # MAs surveyed | 28 |
| On an average day, how many virtual visits do you book | 2–5 |
| I feel comfortable in my ability to schedule a telehealth appointmenta | 4.4 (0.9) |
| Scheduling a telehealth appointment is harder than a regular clinic appointmenta | 3.5 (1.1) |
| It is a problem to schedule telehealth visits while I am performing other expected work dutiesa | 3.5 (1.1) |
| I think our clinic needs another person to help with scheduling virtual health visitsa | 2.5 (1.2) |
| I think scheduling virtual health appointments should be done centrally instead of in my clinica | 2.4 (1.2) |
| Patients I schedule for virtual health are happy they can use virtual health to see the specialista | 4.3 (0.7) |
| What is the average # of minutes it takes to schedule a virtual health visit | 10.3 (6.6) |
| What is the average # of minutes it takes to schedule an IN-PERSON visit | 2.8 (1.4)* |
aReponses are based on a 5-point Likert scale from 1 (strongly disagree) to 5 (strongly agree)
*p < 0.001.
Provider wRVU generation and Integrated Resourcing and Incentive System (IRIS) funding were also determined. Based on the 2016 CMS reimbursement of $35.8279 per wRVU, the 3,885.9 wRVUs generated $139,224 in direct care workload. Of the 38 originating sites, only 3 (the Army Correctional Facility, Spangdahlem Air Base, and Wiesbaden Army Health clinic) reside within 100 miles of LRMC. Thus, the 371 VIPRR clinic visits and the 2,741/3,407 specialty visits conducted to locations outside of this radius would likely have resulted in network deferral resulting in 3,115 (82.5%) visits which could be considered “recaptured” or purchased care avoided.
Based on provider and originating site modifier compliance of 80.6% and 92.8% for the GT and Q3014 modifiers, respectively, IRIS reimbursement generated $87,650 for the Q3014 originating site fee ($25/encounter) and $60,900 from the GT modifier ($20/encounter).
Finally, intangible savings were estimated. Based on the number and location of telehealth encounters, Soldiers and beneficiaries saved an estimated 8,307.5 days in travel, 1,505,995 million miles not driven, and USD $813,237.20 in mileage reimbursement alone for the 3,407 EARTH multispecialty clinic appointments. Further, the 271 VIPRR clinic readiness evaluations resulted in a potential savings of USD $1.3 million as the estimated cost to return a remotely-located Soldier to LRMC is $3,500 per Soldier (Table I). Of note, network providers in USEUCOM, USCENTCOM, and USAFRICOM are currently not conducting synchronous telehealth encounters with LRMC beneficiaries.
DISCUSSION
Virtual health encompasses a number of modalities, but synchronous, also called direct-to-consumer or “real time” VH, provides the best patient satisfaction – not only a key aspect of interactive telemedicine but also the primary modality used by the majority of commercial telehealth platforms.6 With an estimated 6–10% of primary care visits resulting in specialty referral, VH leverages technology to reach distant patients.7 However, we are aware of only one previous publication from a United States military MTF that reports multiple telemedicine outcomes although this report does not address all elements of Section 718.5
When reviewing Section 718 of the FY17 NDAA, we observed that only some requirements can be directly pulled either the MDR or M2.3 Other data such as beneficiary population for each MTF location, patient and provider satisfaction, and indirect savings require data from other sources cannot be determined through these resources. A recent GAO report observed that “In an internal audit, the Army found that about 30% of telehealth encounters were underreported.”8 This “underreported” data would not be obtained through MDR or M2 as the only mechanism at present time to link a clinical encounter as a synchronous VH visit is the GT modifier. Thus, when a provider does not add this modifier, which was observed in 19.4% of the 3,778 encounters in this study, there is no way to accurately assess Section 718 outcomes. In RHCE, each synchronous encounter is available for later review and analysis from a secure, HIPAA-compliant appointing scheduling tool. Presently, any VH encounter that lacks the GT modifier is sent for coder review and, when appropriate documentation is present, the modifier is added thus allowing capture by M2.
Similar to other studies, we observed significant patient satisfaction.6,7 In this study, 98% of patients either “strongly agreed” or “agreed” to use telehealth again as well as being satisfied with their visit. Coupled with most VH visits being new consultations, this high satisfaction is very encouraging and dispels the notion that telehealth should only be utilized after an in-person visit. Further, not only did the patient satisfaction survey tool demonstrated excellent consistency but patient satisfaction was not dependent on whether the patient was required to be seen in-person. We feel this is significant as patient satisfaction is a key driver for telehealth success and one of the top three telemedicine program objectives identified in a 2018 U.S. Telemedicine Industry Benchmark Survey.11
Unfortunately, at present time, scheduling a synchronous virtual health visit is more complicated than a usual clinic appointment as noted by survey results from MAs (Table IV). While the booking staff had access to a unique telehealth calendar developed as an access database, staff needed to “triangulate” the appointment since the desired appointment time was based on the patient’s preference, the provider availability, and the cart availability at the originating site. Since each originating site cart could only support one appointment at a time, 27 unique specialties would have to “vie” for cart time often resulting in appointment schedulers needing to repeat the process if one of the three aspects did not fit with the other two. We hypothesized that secondary to a learning curve for the access database calendar appointing system, MAs booking more appointments were more “fluent,” and evidenced by the clinic scheduling the most VH appointments (sleep medicine) having the shortest booking time. As observed with varied provider adoption and attitudes, we also hypothesized that booking staff had similar differences towards the more complicated VH scheduling tool.
While not a primary objective, the importance of VH supporting military readiness cannot be ignored. Based on patient location and the 2016 Joint Travel Regulation reimbursement of $0.54 per mile, these 2,692 unique patients would have driven approximately 1.5 million miles spending 8,307 days to complete their travel which equates to driving 61.7 times around the Earth and 23.3 years of time lost, respectively. Active Duty travel also results in a per diem mileage cost. Even considering reimbursement would only occur for Active Duty patients (75.9%), this would have amounted to USD $646,523 for mileage alone, excluding the VIPPR clinic. Adding the estimated cost of $3,500 to return a remote Soldier to LRMC instead of utilizing the VIPRR clinic would increase that travel cost to USD $2.11 million (Table I). We recognize that a full business case analysis of these 3,778 telehealth encounters should include all costs (i.e., equipment, staff salaries, etc.), but all cost aspects were not available and was not a primary or secondary goal of this study.
In total, 27 specialties connected with 3.7% (2,962/63,348) of the beneficiaries located in an Army, Navy, or Air Force location with a telehealth cart and patient presenter. This a small increase from 3.4% previous year; however, the number of unique VH patients seen by a LRMC provider increased 57% from 1,886 in CY15 to 2,962 in CY16. This difference was most likely due to the addition of a new originating site in CY16 with approximately 5,000 Airman and beneficiaries but became one of the top VH originating sites. Also, we observed wide telehealth patient utilization rate between originating sites of 0.2–13.5%. (Table V).5,12 Finally, total year-to-year VH activity as a measure of total LRMC outpatient visits increased from 2.4% (2,354/100,094) in CY15 to 3.5% (3,778/107,887) in CY16, and is significantly greater than previous reports.5,9
Section 718 (Telemedicine) FY17 National Defense Authorization Act
| Reportable Outcome | RHCE Reportable Outcome (CY2016) |
|---|---|
| Satisfaction of covered beneficiary | 98% |
| Provider satisfaction | 91–93% |
| Frequency of telehealth use | |
| Unique patients | 3.7% of beneficiaries (2,321/63,348) |
| % local clinic population | 0.2–13.5% |
| % virtual health appointments per clinic | 1.0–39.9% |
| Productivity of healthcare providers | |
| Number of appointments (total) | 3,778 |
| Newa | 1,827 |
| Establisheda | 1,187 |
| Non-skill type I or II | 764 |
| wRVUs | 3,359.1 |
| Reduction (if any) of services in the private sector | 3,115 visits (82.5%) not deferred to the network |
| Allow covered beneficiaries to schedule appointments | Yes, through specialty and primary care clinics |
| Improve access to care | |
| Primary care | Yes – in-home appointments |
| Urgent care | Pilot study published12 |
| Behavioral health | ↑ 29% appointments in CY16 |
| Specialty care | Yes |
| Provide diagnosis, interventions, and supervisions | Yes, Direct-to-patient real-time assessment and evaluation with dedicated and trained patient presenter4 |
| To monitor individual health outcomes of covered beneficiaries with chronic disease and conditions | Yes. 26 distinct medical, surgical, and behavioral health specialties |
| Improve communication between healthcare providers and patients | Yes, “real-time” telehealth with email appointment notification reducing no-show rate by 50% |
| Maximize use of secure messaging | Yes, RelayHealth |
aSkill type I or II provider.
We also observed a lower no-show rate for VH visits compared to in-person visits – 2.7% compared to 4.9% – a similar observation described by others.8 We hypothesize that this lower no-show rate was due to the specialty clinic first contacting the patient by phone, then once the appointment was scheduled the LRMC telehealth team sent an email appointment reminder to the patient’s preferred email.8 Another potential factor was patients were motivated to be evaluated by a LRMC specialty provider as equivalent specialties through the local economy were often lacking or limited.
We recognize that there are a number of limitations with this study. First, this was a retrospective review. Ideally, telehealth outcomes for a specific specialty should compare equivalent outcomes for in-person visits with telehealth visits. Also, there was no command-directed “quota” for telehealth use. Thus, individual specialty telehealth activity may be due to a number of factors which were not explored as part of this study. For instance, specialties with limited providers may have been unable to expand their clinical reach due to requirements to meet local access standards while other clinic providers with more telehealth experience may have conducted more synchronous visits. While the provider survey asked 42 questions, we found this number of questions coupled with a limited number of responses resulted in a multivariate analysis of variance analysis that could not be validated; thus, further exploratory analyses and provider surveys are needed. On the other hand, a one-way analysis of variance analysis between the four main disciplines demonstrated fifteen (35.7%) survey questions with a significant difference. Mainly, behavioral health and surgical specialties reported less “enthusiasm” compared to medicine and primary care specialties to see new patients or that VH was a valuable resource. (Table III) However, further study is required to validate these initial pilot observations and even when validated at one location, these outcomes may not be reproducible at other MTFs.
Finally, while we observed telehealth growth from 2015 to 2016, conducting and supporting telehealth within a MTF faces significant challenges. While not assessed in this study, known barriers include changes in leadership priorities and vision, delays in personnel hiring and budget constraints, information technology barriers to include lengthy Defense Business Certification (DBC) and Risk Management Framework (RMF) cybersecurity validation, and provider and patient adoption among others. Due to the standard 3-year overseas tour in USEUCOM, approximately one-third of providers at both distant and originating sites have a permanent change of station (PCS) resulting in a yearly requirement to credential and educate new providers and clinic leaders. Further, the marked decrease in VH encounters during the 2016 Summer and Fall were directly related to the loss of three VH patient presenters who supported the most VH encounters (unpublished data) (Fig. 2).
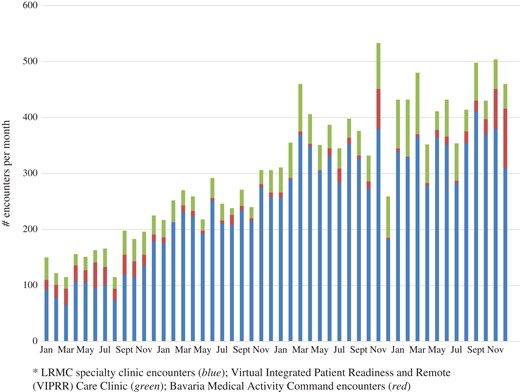
Overall synchronous telehealth encounters in Regional Health Command Europe from January 2014 to December 2017 based on the location of provider. LRMC specialty clinic encounters (blue); Virtual Integrated Patient Readiness and Remote(VIPRR) Care Clinic (green); Bavaria Medical Activity Command encounters (red).
Success of multispecialty synchronous VH not only lies in a detailed costs-benefit analysis but also on developing a centralized hub which develops, supervises, and coordinates training, credentialing, coding, and technical support while identifying opportunities and threats associated with telehealth.10 While we feel this report describes previously unreported outcomes related to synchronous telehealth in the Military Healthcare System, there are still significant knowledge gaps – first and foremost is a comprehensive return on investment (ROI) analysis for a local or regional telehealth platform. Second, the specialties observed herein who conducted the most telehealth appointments may not be representative of the entire MHS, rather could represent local telehealth “champions” or “early adopters.”
Many will also continue to compare telehealth to the usual “brick-and-mortar” in-person visit. Thus, while observed patient and provider and provider satisfaction were high, those conducting telehealth should also report clinic-specific outcomes, quality of care, overall healthcare utilization, and cost savings to the patient and MTF. These primary framework domains, applicable framework subdomains, and potential measurable concepts have been outlined by the National Quality Forum’s “Creating a Framework to Support Measure Development for Telehealth.” 2017 report and should be incorporated into any telehealth planning phase or research.11
Finally, core objectives should be established for a telehealth program. In a recent industry survey of 411 healthcare executives, physicians, nurses, and healthcare professionals in the USA, the top six objectives identified including (1) improving patient outcomes, (2) providing remote patients with access to specialists, (3) increasing patient engagement and satisfaction, (4) improving patient convenience, (5) improving leverage of limited physician resources, and (6) reducing unnecessary ED visits.13
CONCLUSION
Virtual Health remains a top MEDCOM endeavor and has the ability to leverage technology to provide services and access to specialists that otherwise are limited or require extensive travel to reach. However, now the NDAA requires the MHS to provide interval congressional reports regarding Section 718. Herein, we report the outcomes for multispecialty synchronous VH for RHCE and CY16 outcomes which directly address Section 718 elements (Table V).
With the priority of “readiness” and NDAA Section 718 requirements, synchronous VH offers military members and their families located in distant clinics a direct, real-time engagement with specialty providers. We observed a 98% patient satisfaction, a 91–93% provider satisfaction, and significant realized savings for the patient. These outcomes and specific survey tools should be considered when initiating regional and enterprise-level multispecialty synchronous telehealth efforts while measuring identified quality outcomes.
Supplementary Material
Supplementary material is available at Military Medicine online.
Previous Presentations
Presented as a poster (MHSRS17_1648) at the 2017 Military Health System Research Symposium.
Funding
This supplement was sponsored by the Office of the Secretary of Defense for Health Affairs.
Acknowledgments
We thank Dr Tina Dong at the Uniformed Services University of Health Sciences for her statistical input and analysis.
References
Fiscal Year 2017 National Defense Authorization Act (FY17 NDAA). Available at http://www.dtic.mil/congressional_budget/pdfs/FY2017_pdfs/HASC/HASC_Report-CRPT-114hrpt537.pdf; accessed October 29, 2018.
Department of Defense Telehealth Use in Fiscal Year 2016: Available at http://www.gao.gov/products/GAO-18-108R; accessed October 29, 2018.
National Quality Forum: Creating a framework to support measure development for telehealth.
Reach Health 2018 U.S.: Telemedicine Industry Benchmark Survey 2018. Available at https://reachhealth.com/resources/telemedicine-industry-survey/; accessed October 29, 2018.

