


Abstract
Following concussion, return-to-duty decisions are made by medical providers and leaders using informal assessment, review of symptom resolution, and clinical assessments. In an effort to provide military-specific tasks for use in the decision making regarding return-to-duty, a battery developed from the set of basic soldier skills, the Military Functional Assessment Program (MFAP), was evaluated for construct validity using clinical assessment outcomes as well as the relationships between MFAP performance and indicators of long-term performance and satisfaction. A total of 48 participants were enrolled in the study providing baseline and post-treatment clinical assessment, and MFAP performance data. Twenty participants provided follow-up data at 6-month post-MFAP. Correlational analyses suggest significant relationships between MFAP performance ratings and clinical measures of vestibular and cognitive functions and psychological well-being. These findings are consistent with those from previous research on construct validity of the MFAP tasks. Performance on one MFAP task related to perceptions of performance and overall MFAP ratings related to satisfaction reported at 6 months. These findings provide preliminary, however limited, support for these tasks being indicative of the motivation and mental state of the program participant.
INTRODUCTION
Military operations during Operation Enduring Freedom and Operation Iraqi Freedom have resulted in significantly higher rates of traumatic brain injury (TBI) among Soldiers as compared with previous wars, mainly due to the prevalence of improvised explosive attacks.1 Severe brain injuries are less common than the milder forms of TBI, given adequate protective gear, yet the milder forms are more difficult to diagnose and therefore treat. Severe cases of TBI are more straightforward in their clinical presentation, whereas mild TBI (mTBI) symptoms are often invisible in their presentation, causing many cases to go undiagnosed until sequelae occur later in the form of persistent symptoms (e.g., headache, fatigue, dizziness, concentration problems, anxiety), or post-concussive syndrome (PCS), which can be ongoing.2 Such symptoms of mTBI can result in long-lasting deficits that significantly impact a Soldier’s ability to complete mission-critical tasks, making it imperative that providers accurately and reliably determine if a Soldier is capable of and ready to return-to-duty (RTD), or if he or she requires further rehabilitation and treatment, or medical discharge.3,4 Standard clinical assessments, upon which the U.S. Army has traditionally relied, have not been adequately investigated in terms of the mission-critical consequences of mTBI, specifically the complex cognitive and neurosensory requirements of effective military functioning in the field. Military RTD assessments must take into account the unique physical and mental stressors Soldiers face on the battlefield (e.g., combat environments, high workloads, sleep deprivation, fatigue) and the specificity of critical military abilities, such as marksmanship, military vehicle egress, first aid, tactical formations, and land navigation.4
To address the need for a military-specific assessment tool for RTD, the National Intrepid Center of Excellence Intrepid Satellite-III (NICoE ISIII) located at Fort Campbell, KY, developed the Military Functional Assessment Program (MFAP), which has been utilized since 2008 to assist military and clinical professionals in determining Soldier readiness to RTD following mTBI. The MFAP is 5-day assessment program consisting of 10 independent tasks (adapted from the Soldier Manual of Common Tasks: Warrior Skills Level 1)5 and 1 unrated confidence and team building exercise. The MFAP exercises have been developed to accommodate a variety of Soldier injuries while maintaining a high enough level of difficulty to reflect active-duty requirements that maximize operational success. By testing Soldiers in a more applied setting, NICoE ISIII staff can better determine a Soldier’s ability to function while under the pressure of realistic environmental stressors that approximate actual combat scenarios – elements that can significantly impair performance not otherwise captured by traditional clinical assessments.6
In order to determine whether this program has potential for widespread implementation, the validity and reliability of the assessment program need to be established. Construct validity of these tasks was initially explored in a correlational study of an archival dataset from NICoE ISIII.4 The results of this study supported initial convergent validity with a number of commonly used cognitive and vestibular tests that identify critical functioning deficits related to overall neurocognitive status, depression, anxiety, disorientation, alcohol use, and dynamic visual acuity. Most tasks tax multiple functional domains (e.g., cognitive, vestibular, vision, and psychological), whereas some of the simpler tasks are only cognitive in nature. Specific descriptions of each task, the demands identified by the professionals at NICoE ISIII, and summary results from the archival construct validity7 are provided in the Appendix.
A NICoE ISIII staff non-commissioned officer (NCO), who has been trained on the MFAP, rates each Soldier’s performance on 10 tasks and gives each task a subjective rating score using a guided rating scale that incorporates subjective (observed independence level [IL] of the patient) and objective (U.S. Army operational performance standards) criteria (Table I). The ratings are on a 5-point scale and translate to a binary Pass/Fail outcome (Fig. 1). The MFAP occurs following a 12- to 24-week treatment program at NICoE ISIII.
Military Functional Assessment Program Non-commissioned Officer Operational Assessment Criteria
| IL Rating Scale | |
|---|---|
| 1 | Independent; no adaptations: SM is able to complete all of the tasks making up the activity safely, without modification/compensations, and within reasonable time. No cues required. (Exceeds course standards) |
| 2 | Independent; with adaptations/modifications: SM requires increased time to complete tasks, use of compensatory strategies/techniques, indirect verbal guidance or gestural guidance. (Meets course standards) |
| 3 | Acceptable level of assistance: SM requires no more help than direct verbal assistance or physical assistance. SM performs at a level that is acceptable based on rank/experience. Will benefit from additional training. (Marginally achieves course standards) |
| 4 | Unacceptable level of assistance: SM requires that a part of the task (<25%) be completed for them by clinician and/or SM performs at a level that is unacceptable based on his/her rank and/or experience. (Failed to meet course standards) |
| 5 | Dependent: SM requires that 25% or more of activity be done for them by clinician. SM requires psychological intervention. SM unable to complete task due to physical restrictions/limitations. (Failed to meet course standards) |
Note. An IL score of 1, 2, or 3 corresponds to a Pass and an IL score of 4 or 5 corresponds to a Fail. SM, service member; IL, independence level.
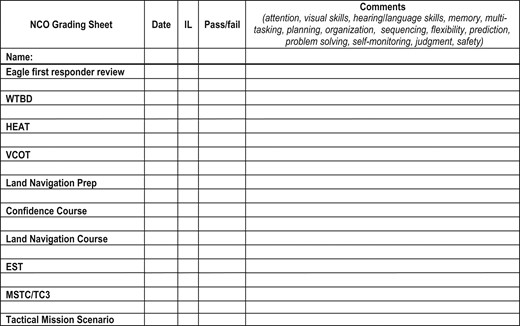
Military Functional Assessment Program non-commissioned officer grading sheet. WTBD, Warrior Tasks and Battle Drills; HEAT, High Mobility Multipurpose Wheeled Vehicle Egress Assistance Trainer; VCOT, Virtual Convoy Operations Trainer; EST, Engagement Skills Trainer; MSCT, Tactical Mission Scenario; TC3, Tactical Combat Casualty Care; IL, independence level.
The NCO rates performance on all of the tasks and additional ratings are provided on a subset of the tasks by an occupational therapist (OT), physical therapist (PT), and mental health (MH) counselor. The OT rates global functioning; PT rates physical strength, agility, and balance; and MH counselor rates anxiety level and psychological level of independence. All raters collaborate at the end of the week to derive a single overall IL score based upon each of their respective operational assessment criteria. Task-specific rating scores based on the IL criteria provided in Table I are collected from all raters and reported on the MFAP Final Results Reporting Sheet (Fig. 2), which includes an overall go/no-go/stop determination for each task, the number and percentage of tasks passed, a general level of independence score (LOI), and recommendation for RTD, among other findings. All scores on the final sheet are based on a collaborative decision made by all four MFAP raters.
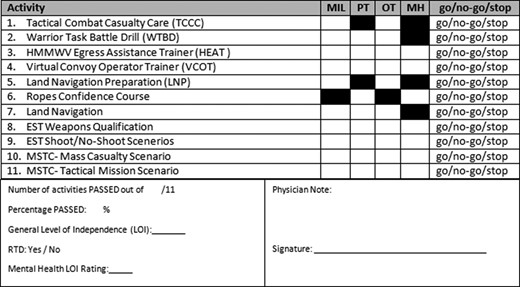
Military Functional Assessment Program final results reporting sheet.
Further establishing the validity and reliability of the MFAP for RTD decision making is needed in order to determine whether and how the program can be implemented at other facilities. The archival dataset used in the previous study4 did not include any information about the MFAP participants following completion of the program thus prohibiting evaluation of the relationships between MFAP task performance and long-term success. Thus, the primary objective of this study was to explore the predictive validity of MFAP performance employing a longitudinal design. A secondary objective was to build upon the archival dataset study and further explore construct validity.
Method and Materials
This longitudinal study examined the relationships between MFAP performance, clinical assessments, and RTD success at 6 months following completion of the MFAP. Additionally, this study evaluated the convergent validity of the MFAP tasks relative to the clinical assessments administered at the beginning and end of the program. This study was reviewed and approved by the U.S. Army Medical Research and Materiel Command’s Institutional Review Board.
Participants
Study participants were 48 U.S. Army Soldiers at NICoE ISIII completing a treatment program following concussion/traumatic brain injury and subsequently taking part in the MFAP. The mean age was 28.90 years (SD = 7.52, min = 19, max = 54). Three participants were female. Rank and Military Occupational Specialty (MOS) data are provided in Table II. Prior to enrollment, a formal power analysis was not conducted to estimate sample size given the exploratory nature of the study. Also, the experienced attrition rate was not anticipated. Note that complete medical histories were not available for review and thus prior injuries are unknown.
Frequencies of Rank and Military Occupational Specialty (MOS) for Study Participants
| Frequency (Percent) | |
|---|---|
| Rank | |
| E3 | 1 (2.1) |
| E4 | 24 (50.0) |
| E5 | 14 (29.2) |
| E6 | 6 (12.5) |
| E7 | 1 (2.1) |
| E8 | 2 (4.2) |
| MOS (description) | |
| 11B (infantry) | 15 (31.3) |
| 92 F (petroleum supply specialist) | 5 (10.4) |
| 13 F (multiple launch rocket system crew member) | 3 (6.3) |
| 88 M (motor transport operator) | 3 (6.3) |
| 89B (ammunition specialist) | 3 (6.3) |
| 91B (wheeled vehicle mechanic) | 3 (6.3) |
| 92 A (automated logistical specialist) | 3 (6.3) |
| 31B (military police) | 2 (4.2) |
| 11 C (indirect fire infantryman) | 1 (2.1) |
| 12B (combat engineer) | 1 (2.1) |
| 12Z (combat engineering senior sergeant) | 1 (2.1) |
| 13D (fire support specialist) | 1 (2.1) |
| 35 N (signal intelligence analyst [linguist]) | 1 (2.1) |
| 68U (ear, nose, and throat specialist) | 1 (2.1) |
| 68 W (health care specialist) | 1 (2.1) |
| 88Z (transportation senior sergeant) | 1 (2.1) |
| 89D (explosive ordnance disposal specialist) | 1 (2.1) |
| 91X (maintenance supervisor) | 1 (2.1) |
| 92Y (unit supply specialist) | 1 (2.1) |
Materials
Participants completed a set of assessments (Table III) including both clinical tests and self-report measures for clinical purposes by the NICoE ISIII personnel. At 6-month post-MFAP, the research team administered the Canadian Occupational Performance Measure (COPM), a self-report measure of one’s perceived level of ability and degree of satisfaction of one’s own job performance. Participants gave consent for their clinical scores and outcomes to be used for the purposes of this research study. The NICoE ISIII assessments were administered at intake and following completion of each individual’s treatment and rehabilitation plan, prior to the MFAP.
Clinical Assessments Used in Data Collection
| Assessment Name | Construct Measured | Format |
|---|---|---|
| Dizziness Handicap Inventory (DHI)8 | Patient’s perceived disabilities related to vestibular dysfunction | Self-report |
| Sensory Organization Test (SOT)9 | Function with respect to abnormalities in the three sensory systems that contribute to postural control: somatosensory, visual, and vestibular | Clinical test |
| Dynamic Visual Acuity (DVA)10 | Gaze stability, which helps identify individuals who may have a deficit of the vestibular system (which regulates internal balance) | Clinical test |
| Neuropsychological Assessment Battery (NAB)11 | Battery of neuropsychological tests consisting of five clinical modules: attention, language, spatial, memory, and executive functions | Clinical test |
| Canadian Occupational Performance Measure (COPM)12 | Self-perception of occupational performance over time including performance and satisfaction | Self-report |
| PTSD Checklist – Military Version (PCLM)13 | PTSD symptoms | Self-report |
| Alcohol Use Disorders Identification Test (AUDIT)14 | Alcohol dependence | Self-report |
| Military Acute Concussion Evaluation (MACE)15 | Concussion symptoms following head trauma including cognitive function | Clinical test |
| Epworth Sleepiness Scale (ESS)16 | Daytime sleepiness | Self-report |
| Patient Health Questionnaire (PHQ)17 | Mental health disorders and symptoms | Self-report |
Procedure
Informed consent was obtained for all participants prior to study procedures and occurred during the week-long MFAP assessment. Following consent procedures, participants completed a brief demographics form requesting rank, age, MOS, and gender. Upon completion of the MFAP, NICoE ISIII provided the research team with the clinical assessment data (Table III), MFAP individual task ratings, MFAP overall ratings, and whether the individual was recommended for RTD. At 6-month post-MFAP completion, participants were contacted by the research team to conduct the first set of follow-up assessments and, for those who were still in the military, to request performance documents, if applicable and available, including NCO evaluation reports, performance points worksheets, standard weapon scorecards, performance/event-related counselings, weapon scorecards – known distance course, weapon scorecards – scaled target course, PT scorecards, and weapon scorecards – combat field fire. All the requested documents are readily accessible to Soldiers. The COPM was administered over the telephone by a member of the research team as it is a structured interview.
Quality Control and Statistical Analysis Approach
All data were inspected to identify any quality concerns (e.g., participant inattention, technical failure). Data distributions were examined for normality as well as skewness and kurtosis. To address the primary objective of evaluating predictive validity, performance data following RTD (including assessments and requested documents) and the individual MFAP task independence level ratings as well as overall MFAP independence level ratings were explored using correlation matrices and stepwise linear regression. To address the secondary objective of evaluating construct validity, MFAP ratings and clinical assessment scores were examined using correlational matrices.
RESULTS
This study experienced a very high attrition rate (58.3%) and none of the requested performance documents were provided by the participants. Multiple attempts were made by the research team to follow-up and despite these efforts, the documents were not provided nor was feedback as to why. Specifically, of the 48 participants, 20 completed the COPM at 6-month post-MFAP completion. No distinguishable pattern with respect to any of the data collected (e.g., MFAP performance, demographics) emerged with respect to those who chose to withdraw nor were reasons for withdrawal and/or non-response provided (withdrawn participants did not respond to repeated attempts to contact for follow-up).
Descriptive Statistics of MFAP Data
Of those who completed the MFAP (N = 47), 4 cases failed (8.51%) and were not recommended for RTD. The mean ratings provided by the NCO, physical therapy (PT), occupational therapy (OT), and mental health (MH) as well as the percentage of failures for each MFAP task are included in Table IV.
Descriptive Statistics and Percentage of Failures for Each MFAP Task
| Task | NCO Mean (SD) | NCO Median | PT Mean (SD) | PT Median | OT Mean (SD) | OT Median | MH Mean (SD) | MH Median | Failures (%) |
|---|---|---|---|---|---|---|---|---|---|
| TCCC | 1.13 (0.40) | 1.00 | NA | NA | 1.26 (0.57) | 1.00 | NA | NA | 0 |
| WTBD | 2.09 (0.83) | 2.00 | 1.32 (0.52) | 1.00 | 2.55 (0.75) | 3.00 | NA | NA | 10.64 |
| HEAT | 1.81 (1.31) | 1.00 | 1.85 (1.35) | 1.00 | 2.02 (1.21) | 2.00 | 2.02 (1.05) | 2.00 | 12.77 |
| LNP | 1.51 (0.78) | 1.00 | NA | NA | 1.94 (0.94) | 2.00 | NA | NA | 6.38 |
| VCOT | 2.30 (0.84) | 2.00 | 1.50 (0.81) | 1.00 | 2.70 (0.96) | 3.00 | 1.96 (0.67) | 2.00 | 19.57 |
| LN | 2.11 (1.18) | 2.00 | 1.23 (0.59) | 1.00 | 2.47 (1.10) | 2.00 | NA | NA | 25.53 |
| WQ-EST 2000 | 2.13 (1.26) | 2.00 | 1.30 (0.59) | 1.00 | 2.53 (1.14) | 2.00 | 2.06 (0.70) | 2.00 | 34.04 |
| SNS-EST 2000 | 1.53 (0.93) | 1.00 | 1.30 (0.59) | 1.00 | 2.32 (1.02) | 2.00 | 2.09 (0.75) | 2.00 | 17.02 |
| MCS | 2.38 (1.10) | 2.00 | 1.34 (0.84) | 1.00 | 2.45 (1.10) | 2.00 | 2.23 (0.87) | 2.00 | 23.40 |
| TMS | 1.93 (0.94) | 2.00 | 1.51 (0.77) | 1.00 | 2.16 (1.07) | 2.00 | 2.05 (0.90) | 2.00 | 20.93 |
Note that for some tasks, the PT, OT, or MH do not provide ratings hence cells are marked “NA.”
Descriptive Statistics of Clinical Assessment Data
Mean and standard deviations were calculated for the clinical assessment data (presented in Table V). Paired-samples t-tests were used to compare scores on the assessments, where available, from pre- to post-treatment (Table V). For the available pre- and post-treatment assessment data, participants performed better at post-treatment (supported by results from the Sensory Organization Test, Dynamic Visual Acuity, and Neuropsychological Assessment Battery assessments) and reported higher levels of self-report performance and satisfaction with their skill levels (supported by results from the COPM performance and satisfaction scores). These results suggest improvement in function over the course of the treatment program.
Descriptive Statistics for Clinical Assessments Pre- and Post-Treatment
| Assessment | n | Mean | SD | t | df | p |
|---|---|---|---|---|---|---|
| SOT | −5.33 | 20 | <0.001 | |||
| Pre | 36 | 69.67 | 12.64 | |||
| Post | 21 | 76.81 | 5.37 | |||
| DVA – left side | 6.48 | 12 | <0.001 | |||
| Pre | 35 | 0.20 | 0.12 | |||
| Post | 13 | 0.11 | 0.06 | |||
| DVA – right side | 4.43 | 11 | =0.001 | |||
| Pre | 34 | 0.19 | 0.13 | |||
| Post | 12 | 0.12 | 0.09 | |||
| NAB – attention | −6.64 | 30 | <0.001 | |||
| Pre | 42 | 83.00 | 18.58 | |||
| Post | 31 | 94.68 | 14.99 | |||
| COPM – performance | −4.83 | 29 | <0.001 | |||
| Pre | 39 | 4.87 | 1.40 | |||
| Post | 30 | 6.55 | 1.11 | |||
| COPM – satisfaction | −6.56 | 29 | <0.001 | |||
| Pre | 39 | 3.59 | 1.73 | |||
| Post | 30 | 6.17 | 1.54 | |||
| DHI | 44 | 28.02 | 21.86 | |||
| PCLM | 46 | 35.61 | 17.20 | |||
| PHQ | 44 | 9.82 | 5.26 | |||
| AUDIT | 45 | 2.58 | 2.67 | |||
| MACE | 47 | 24.79 | 3.56 | |||
| ESS | 44 | 10.34 | 5.62 |
Objective 1: Predictive Validity
Given that the majority of performance outcomes and assessments were not made available or completed by the participants, the analyses to address the primary objective of evaluating predictive validity of the MFAP with respect to RTD success were limited to the two COPM scores, self-reported satisfaction with one’s performance, satisfaction, and self-reported level of performance, performance. Mean COPM performance and satisfaction scores are presented in Figure 3. Paired-samples t-tests were used to evaluate differences in scores from pre- and post-treatment, and at 6 months following the MFAP. Two significant comparisons emerged. Specifically, performance and satisfaction scores increased from pre- to post-treatment, t(29) = −4.831, p < 0.001, t(29) = −6.559, p < 0.001, respectively.
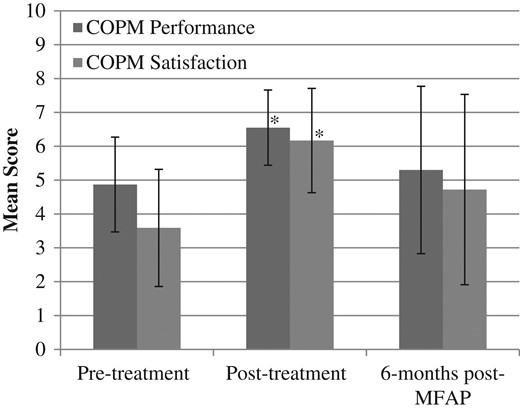
Mean COPM scores. Error bars represent standard deviation. *Indicates significant difference from pre-treatment score.
In order to evaluate the predictive validity of the overall MFAP level of independence ratings and individual MFAP task independence level ratings (provided by the NCO) for self-reported performance and satisfaction, a hierarchical regression model approach was implemented. The independence level ratings were limited to those provided by the NCO given that these ratings are based on performance to U.S. Army standards, the NCO rates all MFAP tasks, and the NCO ratings correlated very strongly with those from the PT, OT, and MH. First, correlational matrices were conducted for the individual MFAP task independence level ratings, overall MFAP independence level rating, and COPM performance and satisfaction scores collected at 6 months post-MFAP (Table VI). Ratings from the TCCC and overall independence level correlated with COPM performance and satisfaction scores at 6 months, respectively.
Correlational Relationships Between Ratings and COPM Scores at 6-Month Post-MFAP
| MFAP Task | COPM Performance Rating | COPM Satisfaction Rating |
|---|---|---|
| TCC | −0.419* | −0.303 |
| WTBD | 0.006 | −0.202 |
| HEAT | 0.075 | 0.078 |
| VCOT | −0.283 | −0.328 |
| SNS-EST 2000 | −0.207 | −0.269 |
| WQ-EST 2000 | −0.297 | −0.355 |
| LN | −0.118 | −0.369 |
| LNP | −0.325 | −0.238 |
| MCS | −0.103 | −0.153 |
| TMS | −0.161 | −0.154 |
| Overall independence level | −0.269 | −0.390* |
*Significant at p < 0.10.
A stepwise linear regression model predicting COPM satisfaction scores at 6 months post-MFAP was not significant, F(5,18) = 0.893, p = 0.603. A stepwise linear regression model predicting COPM performance scores at 6 months post-MFAP was significant, F(2,18) = 5.353, p = 0.017, adjusted R2= 0.326. The predictors included in this model are TCCC ratings, β = −2.623, p = 0.01, and overall independence level ratings, β = −2.175, p = 0.045. Note that age and gender were also included in the analysis and were not related to the outcome variables.
Objective 2: Construct Validity
Correlation matrices were used to evaluate construct validity similar to that in the previous archival database study. The results are presented in Table VII. Findings were primarily consistent with previous findings.4
Results of Correlational analyses Between Clinical Assessments and MFAP Task Ratings
| MFAP Task | Rater | Clinical Assessment | r | n | p | Consistent With Previous Findings? | Consistent With Demands Identified? |
|---|---|---|---|---|---|---|---|
| TCC | NCO | SOT | −0.364 | 36 | 0.029 | No | No |
| OT | SOT | −0.405 | 36 | 0.014 | No | No | |
| WTBD | PT | DVA | −0.668 | 12 | 0.018 | Yes | Yes |
| HEAT | PT | DVA | 0.389 | 35 | 0.021 | Yes | Yes |
| OT | DVA | 0.430 | 35 | 0.010 | Yes | Yes | |
| MH | SOT | 0.476 | 19 | 0.039 | Yes | Yes | |
| VCOT | NCO | DVA | −0.634 | 13 | 0.020 | Yes | Yes |
| OT | SOT | 0.577 | 21 | 0.006 | Yes | Yes | |
| OT | DHI | −0.311 | 43 | 0.042 | Yes | Yes | |
| MH | DVA | 0.406 | 34 | 0.017 | Yes | Yes | |
| LNP | NCO | DVA | 0.490 | 34 | 0.003 | No | No |
| OT | DVA | 0.393 | 34 | 0.022 | No | No | |
| LN | NCO | ESS | −0.363 | 44 | 0.015 | Yes | Yes |
| PT | DVA | −0.684 | 13 | 0.010 | Yes | Yes | |
| PT | ESS | −0.350 | 44 | 0.020 | Yes | Yes | |
| OT | NAB | −0.368 | 42 | 0.017 | No | Yes | |
| SNS-EST 2000 | OT | AUDIT | −0.318 | 45 | 0.033 | No | No |
| OT | ESS | −0.408 | 44 | 0.006 | Yes | Yes | |
| MH | DVA | 0.452 | 35 | 0.006 | Yes | Yes | |
| WQ-EST 2000 | NCO | PHQ | 0.308 | 44 | 0.042 | No | Yes |
| OT | DHI | 0.348 | 44 | 0.021 | Yes | Yes | |
| OT | AUDIT | −0.335 | 45 | 0.024 | No | No | |
| MH | DVA | 0.449 | 35 | 0.007 | Yes | Yes | |
| MCS | OT | ESS | −0.408 | 44 | 0.006 | Yes | Yes |
| MH | DVA | 0.356 | 35 | 0.036 | Yes | Yes | |
| TMS | NCO | DVA | −0.641 | 12 | 0.025 | Yes | Yes |
| MH | DVA | 0.364 | 32 | 0.041 | Yes | Yes | |
| Overall independence level | NA | DVA | −0.726 | 13 | 0.005 | NA | NA |
DISCUSSION
The primary objective of this study was to evaluate the predictive validity of the MFAP with respect to success following RTD or separation from the military. Unfortunately, the study faced a number of challenges that ultimately prohibit drawing any profound inferences regarding predictive validity. The findings with respect to the self-reported levels of satisfaction and performance suggest a potentially meaningful relationship between these outcomes and performance on the TCCC task as well as the overall MFAP independence-level rating.
To speculate as to why these relationships may exist with the TCCC task, two aspects of the task were considered: the demands of the task and the administration of the task. Unlike many of the other MFAP tasks, the TCCC primarily taxes a single domain (cognition). It is possible that the relative simplicity of the task reduces the variability associated with more complex factors and thus is more easily mapped to the outcomes. Additionally, the task includes an instructional portion (provided in Microsoft PowerPoint format) and follows a specific set of tasks with very little flexibility in the administration. Thus, the ratings for this task may be more consistent between raters and administrations also contributing to more easily mapped associations with outcomes. This is supported in part by the findings of an evaluation of the interrater reliability of the MFAP tasks.18
With respect to the MFAP independence level rating and self-reported satisfaction and performance scores, this relationship may possibly be attributed to the collaborative nature of the meetings conducted to determine these overall ratings. Given that the PT, MH, OT, and NCO gather to discuss overall performance, the ratings may be more reflective of overall function than any one specific rating or task.
The secondary objective of the study was to further evaluate the construct validity of the tasks given the findings of an archival data study.4 Overall, the findings are consistent with the previous findings further supporting the vestibular and cognitive demands identified for the individual tasks. However, there are three findings that are postulated by the demands identified by the task that the previous study did not support. Specifically, the current results suggest a cognitive component of the land navigation task and a psychological health component of the weapons qualification and shoot/no-shoot tasks. Two additional findings not supported by previous research nor by the demands identified for the tasks emerged. Both suggest a vestibular component of the land navigation preparation and tactical combat casualty care tasks. Both of the relationships are negative suggesting that worse performance on the tasks corresponds to better performance on the vestibular assessments, which at this time is uninterpretable. Given the lack of vestibular demands in these tasks, and the general concept that correlation does not imply causation, it is possible that there is a third confounding factor driving these associations. Given the available information, it is not reasonable to speculate as to what this third factor may be.
Limitations
The study findings are limited in their generalizability and interpretability given the significant challenges faced in the execution of this study as well as the limited variability in participant demographics and MFAP performance. Specifically, the study experienced a high attrition rate and a lack of compliance with respect to requested performance documentation post-MFAP. More direct interaction between the research team and participants may help eliminate these challenges in future studies. Also, the research team was provided with clinical data and as such did not have control over the clinical assessments administered during the course of treatment. Additional standardized procedures would be preferable in future studies. Given these limitations, inferences with respect to predictive validity of the MFAP for post-RTD success are not possible and further research is needed.
CONCLUSIONS
The findings of this study provide weak support for predictive validity of the MFAP as it was designed to evaluate and are limited in their interpretation. However, this lack of support can largely be attributed to the constraints associated with the study, the high attrition rate, and lack of compliance with respect to requested performance documentation post-MFAP. The findings should not be interpreted as evidence of a lack of predictive validity but a failure to detect it should it exist. Alternatively, the findings do further support the construct validity of the MFAP as previously reported, specifically, confirming results for eight of the tasks and suggesting additional support for the TCCC task.
Supplementary Material
Supplementary material is available at Military Medicine online.
Previous Presentation
Presented as an oral talk at the 2017 Military Health System Research Symposium, August 2017, Kissimmee, FL; abstract # MHSRS-17-0975.
Funding
U.S. Army Medical Research and Materiel Command Military Operational Medicine Research Program. This supplement was sponsored by the Office of the Secretary of Defense for Health Affairs.
Acknowledgments
The authors would like to express their sincere gratitude to the research team who assisted with data collection procedures at the U.S. Army Aeromedical Research Laboratory Aircrew Health and Performance Division as well as the personnel and staff at the National Intrepid Center of Excellence Intrepid Site III.
References
Author notes
The views, opinions, and/or findings contained in this report are those of the authors and should not be construed as an official Department of the Army position, policy, or decision, unless so designated by other official documentation. Citation of trade names in this report does not constitute an official Department of the Army endorsement or approval of the use of such commercial items.

