


Abstract
Herpes zoster (HZ, shingles) affects individuals (60+ years) by reactivation of varicella virus from primary infection. Approximately one-third of the general population will develop HZ and are at increased risk of stroke. Our objective was describing possible associations between self-reported HZ vaccination and stroke with the Centers for Disease Control and Prevention’s Behavioral Risk Factors Surveillance System, a cross-sectional nationwide telephone survey. Non-institutionalized U.S. adults answered items concerning health risk behaviors. 2014 survey data were from 265,568 adults 50–79 years old. Multivariable Cox regressions adjusted for standard demographics, body mass index, and coronary heart disease showed that HZ-vaccinated individuals had lower risk of reporting stroke those not vaccinated (hazard ratio [HR] = 1.73). After stratification of participants into six 5-year age groups, adjusted weighted binary logistic regressions were conducted for each age group with stroke as outcome. The HZ-vaccinated group aged 65–69 years reported stroke approximately 50% less than those unvaccinated (adjusted Odds Ratio [aOR] = 1.51; 99% confidence interval [CI]:1.21,1.88). Secondary analyses indicated that this benefit was among HZ-vaccinated whites (aOR = 1.6, 95%CI:1.4,2.0), but not African Americans or Hispanics. These possible protective effects are not detected 10 years after recommended vaccine uptake. Limitations include not following participants longitudinally and that time between stroke and vaccination could not be determined.
INTRODUCTION
Herpes zoster, commonly known as shingles, is a disease caused by reactivation of varicella-zoster virus (VZV) that typically occurs decades after the primary infection by wild-type varicella (chickenpox). VZV, a neurotropic virus, can remain dormant for years in the dorsal root ganglia and other areas of the neuraxis until reactivation, typically involving a single dermatome. The etiologic mechanism for zoster reactivation, which is characterized by chronic radicular pain generally with cutaneous eruptions, remains poorly understood. Reactivation most frequently occurs in individuals over 50.1 In addition to vesicular rash, zoster is often associated with post-herpetic neuralgia (PHN) that may last for months or even years and has a major impact on an individual’s quality of life.2 It is estimated that approximately one in three persons in the general population will develop zoster over the course of their lifetime.3,4 Recent literature suggests that individuals who develop herpes zoster are at an increased risk of developing a stroke.3,5–9 It has been suggested that prevention of zoster disease with zoster vaccination programs could not only reduce the incidence of zoster and post- herpetic neuropathies but also potentially reduce the incidence of strokes.3
Our objective was to investigate the hypothesis of decreased odds of stroke in persons who have received zoster vaccine by examining data collected by the Behavioral Risk Factor Surveillance System (BRFSS).
METHODS
Study Population and Design
The BRFSS, maintained by the Centers for Disease Control and Prevention (CDC), is a continuously conducted health survey system collecting data from U.S. residents regarding their health-related risk behaviors. The BRFSS is a serial cross-sectional telephone survey conducted monthly over landline and cellular telephones that continuously collects information concerning health risk behaviors, clinical preventive services, and health care access among non-institutionalized adults in the U.S. Adult residents in the 50 states, the District of Columbia, Puerto Rico, and Guam were administered a structured questionnaire.10
In 2014, the BRFSS was representative of more than 102 million individuals in the non-institutionalized U.S. population; it had a mean combined response rate of 45.8%.11 Self-reported zoster vaccination status was assessed as well as self-reported history of stroke. Socio-demographic covariates included age at the time of the survey, gender, race/ethnicity, computed body mass index (BMI), marital status, education level, and smoking status. In the present study, a sample of 265,568 respondents to the 2014 BFRSS aged 50–79 was selected; these were categorized into 5-year age groups. The disposition of 2014 BRFSS respondents is provided in the accompanying diagram (Fig. 1). Pooling of demographic data was conducted as needed.
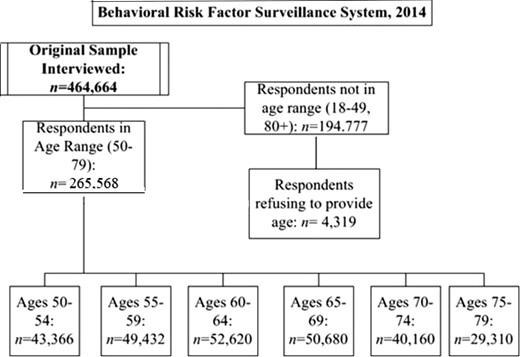
STROBE diagram showing disposition of the 2014 Behavioral Risk Factor Surveillance Survey respondents. n’s are unweighted.
Statistical Analysis
A complex sampling strategy including stratification and clustering was utilized. For landline users, a disproportionate stratified sampling procedure was used. Sampling weights were computed by iterative proportional fitting for more accurately representing each state’s adult aged individuals (≥18 years), gender, and racial/ethnic distribution. This methodological approach minimizes nonresponse bias and error within estimates.10 Variances were estimated with Taylor series linearization. Exploratory data analyses were conducted to establish respondent demographics; weighted percentages were obtained with their 95% confidence intervals (CIs). Rao–Scott adjusted Chi-square tests were calculated. After the adjusted relative risk of self-reported stroke events conditional on vaccination uptake was calculated across age categories by a Poisson regression model, a survival analysis was conducted on these cross-sectional data.12 Cumulative probabilities were assessed with non-parametric survival probabilities (Kaplan–Meier product limit estimations). Censored observations were not included. In analyses of survey data, Kaplan–Meier survival probabilities represent data for all individuals at any given age (50–79 inclusive).
The proportional odds assumption was verified for specific covariates (occurrence of coronary heart disease, BMI category, gender, ethnicity), and this assumption of the constancy of odds across age groups was fulfilled and assessed with log negative log graphs. Regression coefficients were estimated (maximum likelihood solutions) by a multivariable Cox proportional hazards regression model.12 covariates included standard demographics (gender, ethnicity), BMI, and coronary heart disease (CHD). Hazard ratios and corresponding 95% CIs were estimated. A multivariable adjusted weighted binary logistic regression was conducted with the same covariates to estimate the independent relationship between vaccination uptake and stroke occurrence in 5-year age groups. Adjusted odds ratios (95% and 99% CIs) were estimated.
Examination of the potential role of ethnicity in stroke-herpes zoster vaccination relationships was performed with a domain analysis; these secondary analyses were with multivariable adjusted weighted binary logistic regressions. Covariates included the occurrence of coronary heart disease, BMI category, and gender. Adjusted odds ratios were estimated; because of the lower n associated with by-group secondary analyses, 95% confidence limits were estimated only.
Non-parametric Kaplan–Meier survival probabilities, the proportional odds assumption, and survival analyses including Cox regressions were implemented with SAS statistical software (SAS, v9.4; JMP v11) and Poisson regressions with the complex sample package for SPSS 20 (IBM, Armonk, NY, USA). Unadjusted odds ratios (95% and 99% CIs) were first examined; statistical significance for all other statistical tests was declared at p < 0.05. An institutional review board waiver was obtained in accordance with use of publicly available de-identified data.
RESULTS
Characteristics of those aged 50–79 who responded to the 2014 BRFSS telephone survey (n = 265,568) were found with weighted descriptive analyses. About 44.8% were male; 55.2%, female. The majority of respondents self-identified as non-Hispanic white (77.3%); 8.9% identified as non-Hispanic black, 9.2% as Hispanic, and 4.2% as other or multiracial ethnicities. These weighted percentages in each gender and ethnic group varied across age groups (both p < 0.0001). Sample demographic characteristics by 5-year age groups are shown in Table I. No significant differences in reporting of stroke events are found between zoster-vaccinated and unvaccinated respondents in the younger 5-year age groups (50–54, 55–59, Rao–Scott Chi square, p > 0.50). An expected significant increase in proportion of respondents reporting zoster vaccine uptake occurs in the 60–64 age group. Uniformly, in this and older age groups, smaller proportions of zoster-vaccinated respondents report stroke events than those without zoster vaccination (Rao–Scott Chi square, 60–64, p = 0.0107; 65–69, p < 0.0001; 70–74, p = 0.0010; 75–79, p = 0.0116). In older age groups, unadjusted odds ratios (ORs) decrease with 95% CIs approaching 1.0, indicating that associations between stroke and zoster herpes uptake decrease with age (Table II).
Respondent Characteristics by Age Groupa
| Respondent Characteristics | Overall (n = 26,8889) | 50–54 (n = 43,366) | 55–59 (n = 49,432) | 60–64 (n = 52,620) | 65–69 (n = 50,680) | 70–74 (n = 40,160) | 75–79 (n = 29,310) |
|---|---|---|---|---|---|---|---|
| Gender, No. (%) | |||||||
| Male | 11,0031 (44.8) | 18,416 (44.6) | 20,946 (45.5) | 22,260 (45.9) | 21,019 (46.1) | 15,701 (43.6) | 10,727 (41.9) |
| Female | 15,9576 (55.2) | 24,950 (55.4) | 28,486 (54.5) | 30,360 (54.5) | 29,661 (53.9) | 24,459 (56.4) | 18,583 (58.1) |
| BMI, mean (SE) | 28.4 (0.02) | 28.5 (0.05) | 28.6 (0.05) | 28.6 (0.05) | 28.4 (0.05) | 28.0 (0.06) | 27.3 (0.06) |
| Race/ethnicity, No. (%) | |||||||
| White, non-Hispanic | 21,7834 (77.3) | 33,185 (71.2) | 39,072 (75.1) | 42,526 (77.6) | 41,797 (80.1) | 33,593 (82.2) | 24,751 (83.1) |
| Black, non-Hispanic | 19,861 (8.9) | 3,712 (10.8) | 4,121 (10.0) | 4,048 (8.9) | 3,398 (7.9) | 2,499 (7.0) | 1,702 (6.3) |
| Hispanic | 14,361 (9.2) | 3,255 (12.5) | 2,909 (10.2) | 2,660 (8.8) | 2,421 (8.0) | 1,740 (6.8) | 1,261 (7.0) |
| Other, including multiracial | 13,069 (4.6) | 2,628 (5.5) | 2,629 (4.7) | 2,636 (4.8) | 2,232 (4.1) | 1,650 (4.0) | 1,108 (3.7) |
| Marital status, no. (%) | |||||||
| Married/cohabitating | 15,9002 (59.4) | 27,646 (66.9) | 31,028 (66.6) | 32,535 (67.6) | 30,124 (66.4) | 21,756 (63.0) | 13,753 (57.3) |
| Divorced/widowed/ separated/never married | 10,8460 (40.6) | 15,410 (33.1) | 18,024 (33.4) | 19,727 (32.4) | 20,177 (33.6) | 18,157 (37.0) | 15,392 (42.7) |
| Smoking status, no. (%) | |||||||
| Smokes daily/some days | 36,759 (14.3) | 8,294 (19.3) | 8,850 (18.3) | 7,641 (14.6) | 6,028 (11.8) | 3,774 (9.1) | 1,912 (5.9) |
| Former or has never smoked | 22,1775 (85.7) | 33,231 (80.7) | 38,662 (81.7) | 42,919 (85.4) | 42,732 (88.2) | 34,747 (90.9) | 26,126 (94.1) |
| Stroke, no. (%) | |||||||
| Yes | 13,471 (4.8) | 1,245 (3.0) | 1,783 (3.7) | 2,321 (4.6) | 2,750 (5.3) | 2,777 (7.1) | 2,459 (8.4) |
| No | 25,5528 (95.2) | 42,011 (97.0) | 47,527 (96.3) | 50,116 (95.4) | 47,788 (94.7) | 37,251 (92.9) | 26,729 (91.6) |
| Vaccinated, no. (%)b | |||||||
| Yes | 63,166 (21.9) | 1,981 (5.0) | 3,294 (6.9) | 12,458 (23.2) | 18,176 (36.4) | 15,384 (39.0) | 11,177 (39.0) |
| No | 18,8778 (78.1) | 37,918 (95.0) | 42,902 (93.1) | 37,055 (76.8) | 29,650 (63.6) | 22,490 (61.0) | 16,350 (61.0) |
| Coronary heart disease, no. (%) | |||||||
| Yes | 21,345 (7.8) | 1,591 (3.8) | 2,562 (5.2) | 3,843 (7.4) | 4,657 (9.5) | 4,617 (12.5) | 3,877 (14.3) |
| No | 24,5994 (92.2) | 41,546 (96.2) | 46,561 (94.8) | 48,356 (92.6) | 45,521 (90.5) | 35,031 (87.5) | 24,968 (85.7) |
aValues are weighted population frequencies (weighted percentages in parentheses); for BMI, weighted mean and standard error (SE) is shown. Weighted n’s for each age group are shown. Percentages may not sum to 100% due to rounding.
bThe zoster vaccination rate in 2,013, as found by the CDC’s National Health Interview Survey using in-person interviews, was similar (24.2%). 7% of BRFSS participants either did not, or refused to, respond.
Unadjusted Odds Ratios Describing Associations Between Self-reported Stroke With Self-reported Zoster Vaccine Uptake
| Age Group | Odds Ratio | 95% Wald Confidence Limit | 99% Wald Confidence Limit | ||
|---|---|---|---|---|---|
| Lower | Upper | Lower | Upper | ||
| 50–54 | 0.96 | 0.62 | 1.48 | 0.54 | 1.70 |
| 55–59 | 0.86 | 0.60 | 1.23 | 0.54 | 1.38 |
| 60–64 | 1.29 | 1.06 | 1.58 | 1.00 | 1.68 |
| 65–69 | 1.56 | 1.33 | 1.83 | 1.27 | 1.92 |
| 70–74 | 1.30 | 1.11 | 1.53 | 1.06 | 1.61 |
| 75–79 | 1.24 | 1.05 | 1.46 | 1.00 | 1.54 |
Figure 2 shows a non-parametric Kaplan–Meier product limit survival plot indicating cumulative proportions of survey respondents (ages 50–79) not reporting occurrence of stroke with and without zoster vaccine uptake. At age 50, the proportion of respondents with vaccine uptake not reporting stroke does not diverge from that of non-vaccinated individuals (Rao–Scott Chi square, p > 0.50). Potential confounding due to differential initial health is thus reduced.
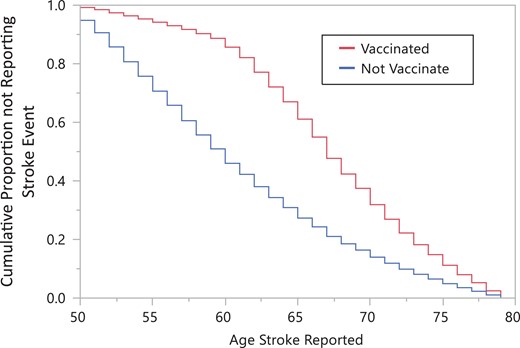
Estimated proportions of respondents within each age (ages 50–79) without a history of stroke, by zoster vaccination status. A different sample of respondents was used at each age. At age 79 despite vaccination status, the cumulative Kaplan–Meier proportions of age cross-sections where respondents were without a stroke history approach 0.0. Behavioral Risk Factor Surveillance System 2014.
A Cox proportional hazards regression model indicates that those without zoster vaccination are at significantly higher risk for stroke compared to those receiving zoster vaccination (HR = 1.73, 95% CI: 1.71, 1.76; Table III). Adjusted odds ratios (aOR) from a weighted binary logistic regression indicate that those in the 65–69 age group without zoster vaccination are 50% more likely to report stroke compared to those with such a vaccination (OR = 1.51, 99% CL: 1.21, 1.88). In the remaining 5 years age groups beginning at 50, respondents with zoster vaccination are generally as likely to report stroke events as those without such vaccination (Table IV, Figure 3). As expected, those with coronary heart disease are significantly more likely to report stroke events across all age groups (Table IV, Figure 3).
Regression Coefficient Estimates and Hazard Ratiosa
| Parameter | p | Hazard Ratio | 95% Hazard Ratio Confidence Limits | |
|---|---|---|---|---|
| Zoster vaccination | ||||
| Yes | <0.0001 | 1.73 | 1.71 | 1.76 |
| No | 1 [Referent] | |||
| Gender | ||||
| Male | 1 [Referent] | |||
| Female | <.0001 | 1.05 | 1.04 | 1.07 |
| Ethnicity | ||||
| White | 1 [Referent] | |||
| African-American | 0.01 | 1.04 | 1.01 | 1.07 |
| Hispanic | <.0001 | 1.10 | 1.07 | 1.14 |
| Other | <.0001 | 1.08 | 1.04 | 1.12 |
| BMI | ||||
| Under/normal weight | 1 [Referent] | |||
| Overweight | 0.66 | 1.00 | 0.99 | 1.02 |
| Obese | <.0001 | 1.08 | 1.06 | 1.10 |
| Coronary heart disease | ||||
| Yes | <.0001 | 1.65 | 1.61 | 1.69 |
| No | 1 [Referent] | |||
aCox proportional hazards model 95% Wald confidence limits for hazard ratios are presented; BRFSS: behavioral risk factor surveillance system; CHD, coronary heart disease.
2,014 BRFSS Survey: OR from discrete time binary logistic regressiona
| Parameter | 5-Year Age Category (OR Estimates, With 99% Confidence Limits) | ||||||||||||||||||
|---|---|---|---|---|---|---|---|---|---|---|---|---|---|---|---|---|---|---|---|
| 50–55 | 55–59 | 60–64 | 65–69 | 70–74 | 75–79 | ||||||||||||||
| OR | 99% Wald CI | OR | 99% Wald CI | OR | 99% Wald CI | OR | 99% Wald CI | OR | 99% Wald CI | OR | 99% Wald CI | ||||||||
| Zoster vaccination | Uptake = yes vs Uptake = no | 0.97 | 0.54 | 1.77 | 0.89 | 0.56 | 1.41 | 1.12 | 0.85 | 1.48 | 1.51 | 1.21 | 1.88 | 1.19 | 0.95 | 1.49 | 1.25 | 1.00 | 1.56 |
| Gender | Male vs Female | 1.15 | 0.86 | 1.53 | 0.92 | 0.71 | 1.18 | 1.06 | 0.85 | 1.32 | 1.01 | 0.82 | 1.23 | 1.00 | 0.81 | 1.24 | 1.14 | 0.90 | 1.44 |
| Ethnicity | |||||||||||||||||||
| African-American vs White | 0.51 | 0.34 | 0.75 | 0.34 | 0.24 | 0.48 | 0.39 | 0.29 | 0.53 | 0.71 | 0.50 | 1.01 | 0.60 | 0.41 | 0.87 | 0.79 | 0.52 | 1.21 | |
| Hispanic vs White | 1.24 | 0.70 | 2.21 | 0.99 | 0.61 | 1.61 | 0.79 | 0.52 | 1.21 | 1.16 | 0.74 | 1.81 | 0.85 | 0.51 | 1.40 | 1.35 | 0.71 | 2.60 | |
| Other vs White | 0.46 | 0.28 | 0.75 | 0.54 | 0.33 | 0.88 | 0.65 | 0.42 | 1.01 | 0.53 | 0.34 | 0.81 | 0.78 | 0.49 | 1.24 | 0.56 | 0.30 | 1.04 | |
| BMI | |||||||||||||||||||
| Overweight vs under/normal weight | 1.11 | 0.76 | 1.63 | 0.97 | 0.70 | 1.35 | 0.93 | 0.69 | 1.24 | 1.06 | 0.82 | 1.36 | 1.05 | 0.81 | 1.37 | 0.77 | 0.59 | 1.00 | |
| Obese vs under/normal weight | 0.83 | 0.58 | 1.18 | 0.88 | 0.64 | 1.20 | 0.67 | 0.51 | 0.90 | 0.80 | 0.62 | 1.02 | 0.82 | 0.63 | 1.08 | 0.80 | 0.60 | 1.07 | |
| CHD | CHD = yes vs CHD = no | 5.56 | 3.73 | 8.30 | 5.13 | 3.80 | 6.92 | 4.75 | 3.67 | 6.14 | 3.65 | 2.89 | 4.62 | 3.42 | 2.65 | 4.42 | 2.64 | 2.04 | 3.42 |
aOdds ratios (OR) with 99% confidence limits not including 1.00 are italicized. CI = Confidence limits; CHD = Coronary Heart Disease.
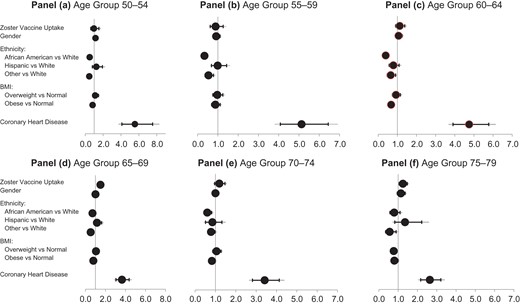
Associations between zoster vaccination and reporting stroke events, Behavioral Risk Factors Surveillance System (BRFSS) respondents: Odds ratios adjusted for demographic and clinical covariates are shown for 5-year age groups in 2014 BRFSS respondents; estimates are representative of the non-institutionalized U.S. population. Estimates are from multivariable binary logistic regression accounting for complex sampling procedures. Modeled is the probability of not reporting a stroke. Forest plots show adjusted odds ratios (+ 95% CI (black), and + 99% CI (gray)). Panel d indicates that zoster-vaccinated respondents 65–69 years of age are significantly less likely (approximately 50%) to report a stroke outcome than those not vaccinated. The strength of this association appears to dissipate in older age groups. Panel a. Age Group 50–54, Panel b. Age Group 55–59, Panel c. Age Group 60–64, Panel d. Age Group 65–69, Panel e. Age Group 70–74, Panel f. Age Group 75–79.
When a secondary analysis was conducted by ethnicity, a reduction in odds of reporting stroke associated with HZ vaccination is detected for whites in the 65–69 age group (Fig. 3 Panel B, aOR = 1.6, 95% CL: 1.4, 2.0), but not for similarly-aged African Americans (aOR = 1.30, 95% CL: 0.7, 2.3) or Hispanics (aOR = 0.9, 95% CL: 0.3, 2.2). A marginal relationship between probability of stroke and herpes zoster vaccination is detected among whites aged 75–79 (Fig. 3 Panel C, aOR = 1.2, 95% CL: 1.03, 1.5) but not in other ethnic groups.
DISCUSSION
There is precedence for the hypothesis that immunization against vaccine-preventable diseases provides primary prevention against cardiovascular events. Vila-Corcoles et al in 2012 demonstrated that PPSV23 (Pneumovax) vaccine was effective against stroke among the general population over 60 years, suggesting a possible protective role against some acute thrombotic events.13 Additionally, literature suggests that influenza vaccine is associated with a reduced rate to first myocardial infection.14
Associations between VZV-induced vasculopathy and stroke events have been reported since the early 1970’s;3,5,6,15 clinical associations have been extensively reviewed.16 As previously documented, there is mounting epidemiological evidence from several study designs demonstrating a strong association between acute systemic infections and risk of acute vascular events.3,5–9 Several potential multifactorial physiologic mechanisms have been proposed for this interaction between VZV activation and such vascular events that can lead to stroke. Due to VZV’s replication in human cerebral arteries, one hypothesis postulates that shingles virus directly affects blood vessels as it spreads along nerve fibers.3 A second hypothesis is that higher levels of inflammation in the body during a severe systemic infection lead to endothelial dysfunction resulting in disruption of atheromatous plaques and hypercoagulability.3,15 Results from the present study suggest that vaccination against VZV activation protects against these possible disruptive events leading to stroke when administered to elderly adults at specific ages.
Our serial cross-sectional study identified associations between zoster vaccination and reporting of stroke in adults aged 50–79. Non-vaccinated respondents reported a stroke event at a 70% greater rate than did zoster-vaccinated respondents. In a series of binary logistic regressions, we investigated 5-year age categories with adjusted odds ratios; in the 65–69 age group, respondents with zoster vaccination were approximately 50% less likely to report stroke than those not vaccinated.
An association indicating a possible protective effect was observed in zoster-vaccinated respondents aged 65–69, but not among those in other age groups. The presence of this association was not due to differences in overall health between vaccinated and non-vaccinated respondents. There are several considerations that may explain this discrepancy. First, the ACIP recommended age for shingles vaccination begins at 60 years of age, which was evident in our data that showed a significant increase in zoster vaccine uptake at this age threshold. The younger age groups may not have adequate immunization rates to be statistically meaningful, particularly coupled with decreased stroke rates in this younger cohort. Various studies document the incidence and severity of herpes zoster disease correlates with loss of VZV-specific cell-mediated immunity as well as declining host immune responses, immunosuppression from any cause, and decreased levels of protection due to the increased time interval since vaccination.4 Immunosenesence is less prevalent in younger age groups, thus less benefit from vaccine. This effect is also seen with pneumococcal disease and influenza, both of which demonstrate significantly higher morbidity and mortality in age groups over age 65.17,18 This is also a possible explanation for the decreased protective benefit of stroke prevention observed in our data for the older age groups. Furthermore, this is consistent with the known efficacy of the vaccine for the prevention of zoster and PHN. According to the Shingles Prevention Study, vaccine efficacy for both zoster prevention and PHN declined during the first year following vaccination, but remained relatively stable through the remaining 3 years of study. The Short-Term Persistence Sub-Study (STPS) showed declining vaccine efficacy after 5 years post-vaccination.19 Additional evaluation by Morrison et al demonstrated that the vaccine efficacy continued to decrease in year 8 post-vaccination.20 Thus, our data demonstrating decreased benefit on stroke reduction with advancing age is consistent with the efficacy of the vaccine for the prevention of zoster and PHN and the expected immunosenescence observed with aging. With a new inactivated shingles vaccine coming to market that provides better long-term efficacy, it would be interesting to see if stroke protective benefits are conferred by the new vaccine.21,22
In addition to age, a race-based disparity was demonstrated by our analysis. Our study showed zoster vaccination had a significant risk reduction of stroke among Caucasians but no significant benefit among African Americans or Hispanics. Previous data have suggested gender and racial disparities among those who develop zoster/PHN. One study reported the lifetime occurrences and reported incidence of zoster were lower in African Americans by 65% and 75%, respectively.23,24 Although it is unclear why the stroke protection benefit is not evenly distributed among all races, we propose that the lack of this benefit may be related to the decreased incidence of zoster among African Americans and thus the decreased protection by zoster vaccine in this population. Comparatively, the stroke incidence rate in African Americans is 191 per 100,000 compared to 88 per 100,000 in whites,25 suggesting differing underlying mechanisms of stroke in this population. Respondents identifying as Hispanics also did not demonstrate increased stroke protection from zoster vaccination. Further, for each 5-year age group, significant gender disparities were not detected in our research.
There are several salient limitations to this research that may hinder generalizability of results. Data were from self-reported data from telephone-based interviews; no data is directly from health care providers. Since individual respondents were not followed longitudinally, statistical analyses of the reporting of stroke events are age-group specific. As the timing between zoster vaccination and subsequent stroke events was not assessed, causal relationships between these cannot be inferred. There is a likelihood of selection bias: adults with a moderate to severe stroke may be unavailable for telephone interviews, and differential attrition due to mortality from stroke may lead to an exaggeration of benefits from zoster vaccination.
CONCLUSION
Our study is the first to report that receiving the zoster vaccine may confer benefits beyond HZ and PHN prevention from the vaccine. Specifically, we describe a decreased risk of stroke for some populations. Zoster vaccination significantly reduces risk of stroke among Caucasians and in particular, in those aged 60–69. No benefit was seen in younger cohorts, African Americans or Hispanics.
Given zoster vaccine already demonstrates significant benefits for shingles and PHN primary prevention, sharing such potential additional benefits with individuals who may otherwise be hesitant with vaccination may help to improve acceptance and vaccination rates. We suggest there would be merit in further evaluating this potential benefit in a prospective clinical study to further elucidate our findings. In addition, further evaluation of this benefit may be indicated in adults receiving inactivated, non-live virus, zoster vaccines recently approved by the Food and Drug Administration.26
The findings presented here provide a basis for exploring the potential role of zoster vaccination against the occurrence of stroke events. Given our data support potential benefit beyond prevention of HZ and PHN such as possible stroke prevention the potential cost savings from an aggressive zoster vaccination program could be very significant. A longitudinal prospective study for the assessment of relations between zoster vaccination and stroke prevention is warranted.
Presentation
Presented as an oral talk at the 2017 Military Health System Research Symposium, August 2017, Kissimmee, FL; abstract # MHSRS-17–0033.
Funding
This supplement was sponsored by the Office of the Secretary of Defense for Health Affairs.
Acknowledgments
The authors thank Ms. Ann Morse, Mrs. Laurie Housel, Mrs. Christina Spooner, Mrs. Gervon Collins, Dr Renata Engler and Lt Col Heather Halvorson for their assistance with the preparation of the manuscript.
References
Author notes
The views expressed herein are those of the authors and do not reflect the official policy of the U.S. Army Medical Department, Department of the Army, the Defense Health Agency, the Department of Defense, or the U.S. Government.

