


Abstract
Elevated homocysteine (Hcy) level during pregnancy is positively associated with various gestational-specific diseases. However, there is no uniform standard for the reference interval (RI) of Hcy in pregnancy.
From January 2017 to January 2019, 14,530 singleton pregnant women registered at our institute were included for the establishment of trimester-specific RIs of Hcy with both the nonparametric approach and the indirect Hoffmann method, followed by pregnancy outcome association analysis conducted with logistic regression.
The serum Hcy level in the nonpregnant group was significantly higher than that of pregnant women. A relatively decreased Hcy concentration was observed in the second trimester when compared with that of the first or third trimester. The direct RIs of Hcy in the first or third, and second trimesters were 4.6 to 8.0 mmol/L (merged) and 4.0 to 6.4 mmol/L, respectively, which showed no significant difference compared with the RI derived from the indirect Hoffmann method. In the subsequent risk analysis, the first trimester Hcy was found to be negatively associated with GDM development; whereas the third trimester Hcy conferred increased risk of postpartum hemorrhage after delivery.
Having established trimester-specific RIs, our study sheds light on the complicated roles of Hcy in pregnancy-related complications.
Introduction
Homocysteine (Hcy) is a sulfur-containing amino acid that is formed during the metabolism of methionine to cysteine, serving as the most important methyl group donor in the human body.1 As a key monitoring indicator of human health, an abnormally elevated level of Hcy is associated with increased risks for various cardiovascular diseases.2 Due to the increase of circulating fluid or blood volume, Hcy concentration in pregnancy has been shown to be lower than that of nonpregnant controls, suggesting the clinical need to establish Hcy reference intervals (RIs) in the pregnant population.3 However, whether there is a distinction in Hcy levels among different trimesters remains controversial.3-6
It has been reported that elevated maternal Hcy level typically introduced by poor folate status was associated with a variety of perinatal complications and postpartum syndromes.7-12 For instance, in a case-control study, significantly elevated maternal serum Hcy was observed in patients diagnosed with preeclampsia (PE), whereas the folate and vitamin B12 levels in PE patients were essentially the same as normal pregnancy.13,14 In another retrospective cohort study, a high level of Hcy in the first trimester was found to be an independent risk factor for severe PE, but it is not a helpful marker for predicting the subsequent development of gestational hypertension (GH) or mild PE.15 A moderately positive correlation between plasma total Hcy level and gestational diabetes mellitus (GDM) was reported in a Chinese Han population.16 A significant association was even observed between increased Hcy level and a previous history of GDM in pregnant women.17 In contrast, in a prospective study including 243 pregnant women, an association between hyperhomocysteinemia and GDM could not be demonstrated.12 Other studies have shown that maternal Hcy concentration was inversely associated with neonatal weights.18,19 However, few studies to date have systematically evaluated the impacts of maternal Hcy levels on the risks of developing adverse pregnancy complications or outcomes.
The traditional method of RI establishment requires at least 120 healthy subjects in whom there is no standard definition for absolute “heathy status.” It is also difficult for laboratory professionals to rule out all subclinical diseases and abnormalities that may affect analysis results. The indirect (Hoffmann) method is a method proposed by Hoffmann to screen the normal population based on the cumulative probability distribution of data so as to establish the reference interval,20,21 with no requirement of recruiting healthy subjects. Whether the Hoffmann method is suitable for the estimation of Hcy RIs in pregnant women still needs to be confirmed.
To fill these knowledge gaps, we conducted a population-based cohort study, focusing on the establishment of instrument-specific gestational RIs of Hcy and the associations between Hcy and maternal/fetal risks of peri- and postpartum complications.
Materials and Methods
Subjects and Laboratory Data
To establish the trimester-specific RIs of Hcy, 150 healthy singleton pregnant women (aged 25 to 40) who gave live birth at our institute and presented normal pregnancy test results (ie, routine blood, urine, and biochemical tests) and 150 nonpregnant healthy controls with matching ages were enrolled. The selection and exclusion criteria were as previous described22 (see Supplementary Methods).
For the association study, the first and third trimester Hcy laboratory results as well as the corresponding pregnancy/delivery outcomes were retrieved from the digital history records of the women who were registered at the Beijing Obstetrics and Gynecology Hospital with regular antenatal checkups. As a result, from October 2018 to September 2020, a total of 14,530 eligible singleton pregnant women were included in the study. Considering the completeness and availability of the medical records, the following peri- and postpartum complications or adverse outcomes were involved for the subsequent risk association analyses: gestational hypertension (GH), gestational diabetes mellitus (GDM), preeclampsia (PE), intrahepatic cholestasis of pregnancy (ICP), macrosomia, and postpartum hemorrhage (PPH), the definitions of which are provided in Supplementary Table 1.
The study protocol was approved by the Ethics Committee of Beijing Obstetrics and Gynecology Hospital (2022-KY-007-02). The ethics committee waived the requirement for informed consent from participants because all Hcy tests are part of routine antenatal care during pregnancy. All the laboratory data were anonymous before use.
Hcy Measurement Method
Serum Hcy levels were assayed on the fully automated ARCHITECT ci16200 Integrated System Chemistry/Immunology Analyzer (Abbott) with the Homocysteine Assay Kit (enzymatic cycling method). The limit of quantitation for the serum Hcy assay was 0.01 mmol/L. The intra-assay coefficient of variation (CV) of serum Hcy was 3.8%; the interassay CV was 5.3%. The serum samples of the subjects were stored at 4°C for less than 24 hours or at −20°C for longer time storage (less than 1 month) before testing. The ARCHITECT homocysteine assay is a 1-step immunoassay for the quantitative determination of total L-homocysteine in human serum or plasma. Bound or dimerized Hcy (the oxidized form) is reduced by dithiothreitol to free Hcy, which is subsequently converted to S-adenosyl homocysteine by the action of the recombinant enzyme S-adenosyl homocysteine hydrolase. The S-adenosyl homocysteine then competes with acridinium-labeled S-adenosyl cysteine for particle-bound monoclonal antibody. An indirect relationship exists between the amount of homocysteine in the sample and the relative light units detected by the ARCHITECT iSystem optics, which is used to calculate the serum concentration of Hcy.
Statistical Analysis
The normality of quantitative data was tested by Kolmogorov-Smirnov test. The standard deviation was used for descriptive statistics and t-test was used for comparison between the 2 groups. Descriptive statistics were performed by interquartile spacing for data that did not conform to normal distribution, and rank-sum test was used for comparison between groups. Multivariate logistic regression analysis was used to analyze odds ratios (ORs) and 95% CIs with maternal age and prepregnancy body mass index (BMI) adjusted as confounders. Basically, the 2 variables of age and prepregnancy BMI were included as covariates into the logistic regression analysis to calculate the resulting OR and P values for the adjusted risk relationship between serum Hcy and pregnancy outcomes. Outlying values were tested by Tukey’s method, in which outlying values were defined as less than Q1−1.5 × interquartile range (IQR) or more than Q3−1.5 × IQR (Q1 is the 25th percentage, Q3 the 75th percentage and the IQR is Q3−Q1). The Mann-Whitney U-test was used to detect the statistical significance of Hcy in the first and third trimester, and P < .05 was considered statistically significant. The above data analyses were performed using SPSS 22.0 software.
To estimate the trimester-specific RIs using the direct method, nonparametric analysis was used with the Hcy testing results of the 150 healthy singleton pregnant women. The 2.5th and 97.5th percentiles were used as the lower and upper limits of RIs, respectively. The Hoffmann method used to indirectly calculate the reference intervals of Hcy in pregnancy was as previously described.21,22 The approach for statistical testing of mean difference between subgroups is based on the proportion criterion developed by Lahti.15 Briefly, the lower limit (2.5th percentile) and upper limit (97.5th percentile) were first calculated using data covering 2 neighboring subgroups. Next, the outlier was determined as proportions of the subgroup distribution outside reference limits established by combining neighboring subgroups. If at least 1 of the 4 proportions of the subgroups outside the common reference limits exceeded or was equal to 4.1%, or laid below or was equal to 0.9%, partitioning was considered necessary.23
Results
As shown by the boxplot in FIGURE 1, the serum Hcy level in the nonpregnant control women was significantly higher than that of pregnant women in the first, second, or third trimester, with medians (25th-75th percentile) of 8.6 (7.3-10.3), 5.0 (4.6-5.4), 6.3 (5.5-6.8), and 6.0 (5.4-6.7) mmol/L, respectively. By contrast, the Hcy level was essentially unchanged between the first and third trimesters but was significantly decreased in the second trimester (FIGURE 1). The Hcy RI of the first and third trimester merged using the Lahti method (TABLE 1) was 4.6-8.0 mmol/L compared with the RI of 3.9-9.1 mmol/L derived from the Hoffmann method. There was no significant difference between the observed RI of the healthy women and the RIs calculated by Hoffmann’s method (absolute difference percentage smaller than reference change value percentage), suggesting the validity of the indirect method of Hcy RI estimation in pregnancy. The second trimester Hcy RI, which was not mergeable with the other trimesters, was estimated as 4.0-6.4 mmol/L by the direct method (TABLE 1).
Trimester-specific reference intervals of serum homocysteine using both direct and indirect methods
| Trimestera | Trimester-specific Rls, mmol/L | Absolute difference, % | RCV, % | |
|---|---|---|---|---|
| Observed RI | Hoffmann RI | |||
| First or third | 4.6-8.0 | 3.9-9.1 | 13.8-15.2 | 17.3 |
| Second | 4.0-6.4 | — | — | — |
| Trimestera | Trimester-specific Rls, mmol/L | Absolute difference, % | RCV, % | |
|---|---|---|---|---|
| Observed RI | Hoffmann RI | |||
| First or third | 4.6-8.0 | 3.9-9.1 | 13.8-15.2 | 17.3 |
| Second | 4.0-6.4 | — | — | — |
RCV, reference change value; RI, reference interval.
aFirst trimester is 1 to 12 gestational weeks (GWs); second trimester, 13 to 28 GWs; third trimester, 29 to 40 GWs.
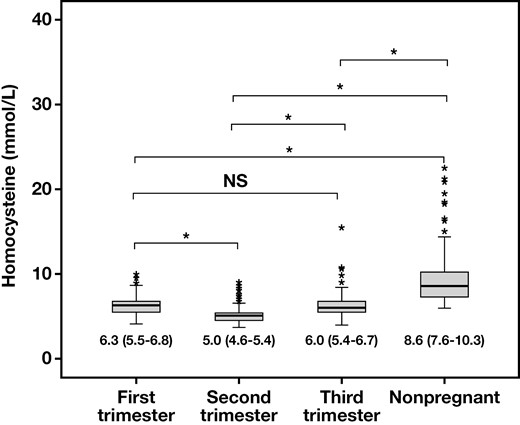
Box plots representing the serum homocysteine level of nonpregnant and pregnant women in the first, second, or third trimester. The homocysteine concentrations of different patient groups were presented as median (25th-75th percentile). *P < .001; NS, not significant.
Given the onset time of various pregnancy diseases, the multivariate logistic regression analysis to estimate the risks of GDM, GH, PE, and ICP was carried out using first trimester Hcy; the analysis for macrosomia and PPH was conducted using both first and third trimester Hcy. The baseline characteristics of age and prepregnancy BMI and the medians of Hcy levels in different complication groups are summarized in TABLE 2, showing that the first trimester Hcy was significant decreased in the GDM and macrosomia groups. However, in the patients who experienced PPH, the third-trimester Hcy level was significantly elevated. In the subsequent logistic regression analysis, the OR values were calculated with cutoffs set around the upper reference limit (URL) of Hcy. The Hcy cutoff values used in the multivariate logistic regression analysis, as well as the number and percentage of the Hcy data points greater than the corresponding cutoffs, are listed in Supplementary Table 2.
Demographic data and basic statistics of the serum homocysteine in patients with different pregnancy complications or outcomesa
| Age, y | Prepregnancy BMI, kg/m2 | Hcy, mmol/Lb | Hcy, mmol/Lc | |
|---|---|---|---|---|
| GDM positive (n = 1075, 7.3%) | 33 (30-36) | 23.01 (20.94-25.63) | 6.6 (6.0-7.4) | — |
| GDM negative (n = 13,455) | 31 (29-34) | 21.11 (19.49-23.31) | 6.8 (6.1-7.7) | — |
| P | <.001 | <.001 | <.001 | — |
| GH positive (n = 276, 1.8%) | 31 (29-35) | 23.14 (20.82-26.00) | 6.8 (6.0-7.6) | — |
| GH negative (n = 14,254) | 31 (29-34) | 21.23 (19.53-23.44) | 6.8 (6.1-7.7) | — |
| P | .123 | <.001 | .172 | — |
| PE positive (n = 554, 3.8%) | 32 (29-35) | 24.09 (21.36-27.04) | 6.9 (6.1-7.7) | — |
| PE negative (n = 13,976) | 31 (29-34) | 21.22 (19.53-23.34) | 6.8 (6.1-7.7) | — |
| P | <.001 | <.001 | .193 | — |
| ICP positive (n = 37, 0.2%) | 31 (29-35) | 20.96 (19.20-23.52) | 6.9 (6.5-7.9) | — |
| ICP negative (n = 14,493) | 31 (29-34) | 21.26 (19.53-23.44) | 6.8 (6.1-7.7) | — |
| P | .497 | .476 | .219 | — |
| Macrosomia positive (n = 258, 1.7%) | 32 (30-35) | 22.90 (21.22-25.36) | 6.5 (5.9-7.4) | 6.1 (5.4-6.9) |
| Macrosomia negative (n = 14,272) | 31 (29-34) | 21.23 (19.53-23.44) | 6.8 (6.1-7.7) | 6.0 (5.4-6.9) |
| P | <.001 | <.001 | .006 | .378 |
| PPH positive (n = 1116, 7.6%) | 32 (29-35) | 22.03 (20.04-24.46) | 6.8 (6.1-7.6) | 6.2 (5.4-7.1) |
| PPH negative (n = 13,414) | 31 (29-34) | 21.22 (19.53-21.38) | 6.8 (6.1-7.7) | 6.0 (5.3-6.9) |
| P | <.001 | <.001 | .223 | <.001 |
BMI, body mass index; GDM, gestational diabetes mellitus; GH, gestational hypertension; Hcy, homocysteine; ICP, intrahepatic cholestasis of pregnancy; PE, preeclampsia; PPH, postpartum hemorrhage.
aAll the numerical values were presented as median (25th-75th percentile). P < .05 is considered significant.
bFirst trimester.
cThird trimester.
Interestingly, as shown in TABLE 3, the first trimester Hcy was negatively associated with the risk of GDM development, with ORs ranged between 0.43 (95% CI, 0.28-0.66) and 0.74 (95% CI, 0.65-0.84) when the cutoffs were set at 80% to 120% URLs of Hcy. In contrast, the third-trimester Hcy posed moderately increased risk in women suffering PPH after delivery (TABLE 3).
Logistic regression analysis of serum Hcy for the risks of pregnancy complications and adverse pregnancy outcomesa
| GDM | GH | PE | |||||
|---|---|---|---|---|---|---|---|
| OR (95% CI) | P | OR (95% CI) | P | OR (95% CI) | P | ||
| Hcyb | 80% URL | 0.74 (0.65-0.84) | <.01 | 0.83 (0.65-1.06) | .14 | 1.14 (0.95-1.36) | .16 |
| 85% URL | 0.70 (0.62-0.80) | <.01 | 0.90 (0.71-1.15) | .40 | 1.13 (0.95-1.34) | .17 | |
| 90% URL | 0.68 (0.59-0.79) | <.01 | 0.80 (0.61-1.03) | .08 | 1.10 (0.92-1.31) | .31 | |
| 95% URL | 0.70 (0.60-0.82) | <.01 | 0.85 (0.64-1.14) | .28 | 1.07 (0.88-1.30) | .49 | |
| 100% URL | 0.73 (0.61-0.87) | <.01 | 0.72 (0.51-1.02) | .06 | 1.15 (0.93-1.43) | .20 | |
| 105% URL | 0.67 (0.54-0.83) | <.01 | 0.68 (0.45-1.03) | .07 | 1.09 (0.84-1.40) | .51 | |
| 110% URL | 0.53 (0.40-0.70) | <.01 | 0.58 (0.34-0.98) | .04 | 1.23 (0.93-1.64) | .15 | |
| 115% URL | 0.52 (0.37-0.73) | <.01 | 0.71 (0.40-1.24) | .23 | 1.10 (0.78-1.54) | .60 | |
| 120% URL | 0.43 (0.28-0.66) | <.01 | 0.72 (0.38-1.39) | .33 | 1.04 (0.70-1.55) | .86 | |
| Hcyc | 80% URL | — | — | — | — | — | — |
| 85% URL | — | — | — | — | — | — | |
| 90% URL | — | — | — | — | — | — | |
| 95% URL | — | — | — | — | — | — | |
| 100% URL | — | — | — | — | — | — | |
| 105% URL | — | — | — | — | — | — | |
| 110% URL | — | — | — | — | — | — | |
| 115% URL | — | — | — | — | — | — | |
| 120% URL | — | — | — | — | — | — | |
| ICP | Macrosomia | PPH | |||||
|---|---|---|---|---|---|---|---|
| OR (95% CI) | P | OR (95% CI) | P | OR (95% CI) | P | ||
| Hcyb | 80% URL | 1.93 (0.91-4.10) | .09 | 0.67 (0.52-0.86) | <.01 | 0.95 (0.83-1.07) | .39 |
| 85% URL | 1.16 (0.61-2.21) | .66 | 0.73 (0.57-0.94) | .01 | 0.97 (0.85-1.09) | .57 | |
| 90% URL | 1.14 (0.58-2.21) | .70 | 0.76 (0.58-1.00) | .05 | 0.92 (0.80-1.04) | .19 | |
| 95% URL | 1.45 (0.73-2.88) | .30 | 0.75 (0.55-1.02) | .06 | 0.92 (0.80-1.07) | .29 | |
| 100% URL | 1.11 (0.48-2.52) | .81 | 0.67 (0.46-0.96) | .03 | 0.89 (0.75-1.05) | .17 | |
| 105% URL | 0.65 (0.20-2.13) | .48 | 0.78 (0.51-1.17) | .23 | 0.87 (0.71-1.06) | .16 | |
| 110% URL | 0.62 (0.15-2.59) | .51 | 0.86 (0.54-1.37) | .53 | 0.87 (0.69-1.10) | .24 | |
| 115% URL | 0.43 (0.06-3.17) | .41 | 0.84 (0.48-1.44) | .52 | 0.81 (0.61-1.07) | .14 | |
| 120% URL | 0.61 (0.08-4.44) | .62 | 0.71 (0.63-1.39) | .32 | 0.79 (0.57-1.09) | .15 | |
| Hcyc | 80% URL | — | — | 1.00 (0.78-1.30) | .96 | 1.32 (1.16-1.49) | <.01 |
| 85% URL | — | — | 1.01 (0.76-1.34) | .93 | 1.30 (1.14-1.49) | <.01 | |
| 90% URL | — | — | 1.10 (0.80-1.49) | .57 | 1.24 (1.07-1.45) | <.01 | |
| 95% URL | — | — | 1.16 (0.82-1.64) | .42 | 1.25 (1.05-1.48) | .01 | |
| 100% URL | — | — | 1.04 (0.68-1.57) | .87 | 1.36 (1.12-1.65) | <.01 | |
| 105% URL | — | — | 1.03 (0.63-1.67) | .91 | 1.43 (1.15-1.78) | <.01 | |
| 110% URL | — | — | 0.84 (0.46-1.56) | .59 | 1.35 (1.04-1.74) | .02 | |
| 115% URL | — | — | 0.95 (0.48-1.86) | .87 | 1.39 (1.03-1.86) | .03 | |
| 120% URL | — | — | 1.08 (0.53-2.21) | .83 | 1.30 (0.93-1.82) | .13 | |
BMI, body mass index; GDM, gestational diabetes mellitus; GH, gestational hypertension; Hcy, homocysteine; ICP, intrahepatic cholestasis of pregnancy; OR, odds ratio; PE, preeclampsia; PPH, postpartum hemorrhage; URL, upper reference limit.
aP < .05 is considered significant.
bFirst trimester.
cThird trimester.
Discussion
The Hoffmann method that has been widely adopted to determine the RIs of clinical laboratory tests does not require additional effort to recruit and collect samples from healthy people. It has also been applied to situations where it would be difficult to obtain samples (such as cerebrospinal fluid) from healthy subjects.24,25 To the best of our knowledge, the Hoffman method was used in our study for the first time to estimate trimester-specific Hcy RIs, further proving its merit and validity in the pregnant population.
As shown in FIGURE 1, serum Hcy was decreased naturally in pregnancy compared with nonpregnant controls. Second trimester Hcy concentration was the lowest of all 3 trimesters, which is consistent with other reports from previous studies.3,26 It is associated with a physiological decline in albumin during pregnancy and also with folic acid supplementation.27 The decrease in Hcy level during normal pregnancy is helpful to maintain the integrity of maternal vascular endothelial cells and the elasticity of coronary arteries.5,6 Therefore, given the influence of multidimensional information such as age, diet, and prepregnancy BMI, it is of great clinical value to formulate a reasonable RI for Hcy during pregnancy through a large-sample sized study.
Further, our study showed that serum Hcy level was negatively associated with GDM (TABLE 3). The higher the Hcy level in the first trimester, the lower the risk of GDM development observed. Robillon et al28 found that plasma Hcy concentration was significantly reduced in patients with type 1 diabetes with virtually no microvascular complications, which they believed was attributed to renal hyperperfusion. Renal hyperperfusion in early diabetes has been reported to lead to increased catabolism of homocysteine.29 In another study, it was shown that the patients with albuminuria diabetes had lower Hcy than matched control subjects. In addition, in their univariate and multivariate analyses, Hcy was negatively associated with blood glucose levels in the diabetic group.30 However, the mechanism behind the negative association between first trimester Hcy level and GDM development remains unclear and requires further clinical and biological investigations.
Although this is a large-sized population-based cohort study that rendered significant statistical power to the subsequent association analysis, a few limitations still exist. First, our work is a single-center study that lacks ethnic background diversity. Studies involving multiple centers and other populations in different regions would be more comprehensive and representative. Second, the gravidity, parity, and folic acid supplementation that may be contributive to the prevalence of variable pregnancy complications were not included or available in this analysis.
Conclusion
In this population-based cohort study, trimester-specific RIs of Hcy were established with both direct observational and indirection Hoffmann methods. Further, first-trimester Hcy was found to be negatively associated in GDM development, whereas third-trimester Hcy indicated increased risk of PPH after delivery. Our results have shed light on the complicated roles of Hcy in pregnancy-related complications.
Abbreviations:
- Hcy
homocysteine
- RI
reference interval
- PE
preeclampsia
- GH
gestational hypertension
- GDM
gestational diabetes mellitus
- ICP
intrahepatic cholestasis of pregnancy
- PPH
postpartum hemorrhage
- CV
coefficient of variation
- BMI
body mass index
- OR
odds ratio
- URL
upper reference limit
Funding
This work was supported by the Training Fund for Open Projects at Clinical Institutes and Departments of Capital Medical University (CCMU2022ZKYXZ006), the Beijing Municipal Administration of Hospitals Incubating Program (No. PX2020060), and Beijing Obstetrics and Gynecology Hospital, Capital Medical University, Beijing Maternal and Child Health Care Hospital “Discipline Backbone” Plan Special Funds (No. XKGG201802). The funding bodies did not take part in the design of the study, the collection, analysis, or interpretation of the data, nor manuscript writing.
Conflict of Interest Disclosure
The authors have nothing to disclose.
Data Availability
According to the patients’ verbal consent, their relevant demographic and medical records are only available from the corresponding author on reasonable request.
